Technology
Enterprise Data Warehouse (EDW) Market size is set to grow by USD 39.23 billion from 2024-2028, Data explosion across industries boost the market, Technavio
Published
2 years agoon
By
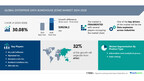
NEW YORK, June 26, 2024 /PRNewswire/ — The global enterprise data warehouse (EDW) market size is estimated to grow by USD 39.23 billion from 2024-2028, according to Technavio. The market is estimated to grow at a CAGR of 30.08% during the forecast period. Data explosion across industries is driving market growth, with a trend towards significant focus on new solution launches. However, data security concerns poses a challenge. Key market players include Accur8 Software, Alphabet Inc., Amazon.com Inc., Amitech Solutions Inc., AtScale Inc., CitiusTech Healthcare Technology Pvt. Ltd., Cloudera Inc., Fusion Consulting AG, HCL Technologies Ltd., Health Catalyst Inc., International Business Machines Corp., Microsoft Corp., Open Text Corporation, Oracle Corp., SAP SE, Snowflake Inc., Solver Inc., Tata Sons Pvt. Ltd., Teradata Corp., and Veeva Systems Inc..
Get a detailed analysis on regions, market segments, customer landscape, and companies- View the snapshot of this report
Enterprise Data Warehouse (Edw) Market Scope
Report Coverage
Details
Base year
2023
Historic period
2018 – 2022
Forecast period
2024-2028
Growth momentum & CAGR
Accelerate at a CAGR of 30.08%
Market growth 2024-2028
USD 39236.2 million
Market structure
Fragmented
YoY growth 2022-2023 (%)
23.2
Regional analysis
North America, Europe, APAC, Middle East and Africa, and South America
Performing market contribution
APAC at 32%
Key countries
US, China, UK, India, and Germany
Key companies profiled
Accur8 Software, Alphabet Inc., Amazon.com Inc., Amitech Solutions Inc., AtScale Inc., CitiusTech Healthcare Technology Pvt. Ltd., Cloudera Inc., Fusion Consulting AG, HCL Technologies Ltd., Health Catalyst Inc., International Business Machines Corp., Microsoft Corp., Open Text Corporation, Oracle Corp., SAP SE, Snowflake Inc., Solver Inc., Tata Sons Pvt. Ltd., Teradata Corp., and Veeva Systems Inc.
Market Driver
The enterprise data warehouse (EDW) market is experiencing growth due to increased adoption in small-medium enterprises and large businesses. Vendors are investing in new solutions and upgrades, such as Snowflake Inc.’s introduction of new large language models, enhanced retrieval capabilities, and AI safety measures in May 2024. These advancements, like Snowflake Arctic’s SQL generation and execution capabilities, contribute to market growth under the Apache 2.0 license, ensuring openness and collaboration.
The Enterprise Data Warehouse (EDW) market is experiencing significant growth due to the increasing demand for data analysis and business intelligence. Businesses are recognizing the importance of having a centralized system to manage and analyze their data. Trends in this market include the use of advanced analytics and machine learning to gain insights from data. Data sources are becoming more diverse, including social media and IoT devices. Data volumes are growing rapidly, requiring the use of cloud-based solutions for scalability. Data security and governance are also key concerns. Tools such as ETL (Extract, Transform, Load) and data visualization software are essential for effective EDW implementation. Overall, the EDW market is evolving to meet the needs of businesses seeking to make data-driven decisions.
Research report provides comprehensive data on impact of trend. For more details- Download a Sample Report
Market Challenges
The global Enterprise Data Warehouse (EDW) market faces significant data security challenges. Threats such as DDoS attacks, data breaches, unsecured APIs, data loss, and account hijacking pose risks to stored data. Vendors and enterprises are addressing these concerns through service-level agreements (SLAs) and security measures like data management software and security appliances. Despite efforts to enhance security, data breaches and loss remain potential issues, underscoring the importance of ongoing vigilance in the EDW market.Enterprise Data Warehouses (EDW) play a crucial role in businesses by collecting and storing data from various sources. However, implementing an EDW comes with several challenges. One major challenge is data integration from multiple sources, ensuring consistency and accuracy. Another challenge is data security and privacy, as sensitive data needs protection. Scalability is also a concern, as businesses grow and generate more data. Additionally, keeping up with technology advancements and ensuring compatibility with new systems can be a challenge. Lastly, cost is a significant factor, as EDW implementation and maintenance can be expensive. Despite these challenges, businesses continue to invest in EDWs to gain valuable insights and make informed decisions.
For more insights on driver and challenges – Request a sample report!
Segment Overview
This enterprise data warehouse (edw) market report extensively covers market segmentation by
Product Type1.1 Information and analytical processing1.2 Data miningDeployment 2.1 Cloud based2.2 On-premisesGeography 3.1 North America3.2 Europe3.3 APAC3.4 Middle East and Africa3.5 South America
1.1 Information and analytical processing- The Enterprise Data Warehouse (EDW) market is driven by the expansion of IT, BFSI, education, healthcare, and retail sectors. Data warehouses facilitate the processing of information for querying, analysis, and reporting. OLAP operations like slice-and-dice, drill-down, and pivoting enable multidimensional data analysis. The integration of web-based accessing tools and the use of both summarized and comprehensive historical data are current trends. These factors contribute to the growth of the information and analytical processing segment of the EDW market.
For more information on market segmentation with geographical analysis including forecast (2024-2028) and historic data (2017-2021) – Download a Sample Report
Research Analysis
The Enterprise Data Warehouse (EDW) market encompasses solutions that enable organizations to collect, process, and store data from various business units and data sources for analysis and reporting. EDWs facilitate the integration of flat files and physical recordings into a centralized, structured database. This collection of databases serves as valuable assets for businesses, providing a single source of truth for the organization’s information. EDWs employ an ingestion layer to handle data from multiple sources and ensure data consistency. Business intelligence (BI) tools, such as Tableau, PowerBI, Qlik, Teradata, Netezza, Exadata, Amazon Redshift, and Google BigQuery, are commonly used to derive insights from the data stored in EDWs, thereby enhancing decision-making capabilities across departments. Data engineering plays a crucial role in designing, building, and maintaining these complex systems. Cloud-based EDWs offer scalability and flexibility, making them an attractive option for businesses looking to modernize their data management infrastructure.
Market Research Overview
The Enterprise Data Warehouse (EDW) market encompasses solutions and services that enable organizations to collect, store, manage, and analyze large volumes of data from various sources. EDW solutions provide a centralized repository for data integration, ensuring data consistency and accuracy. They utilize advanced technologies such as artificial intelligence, machine learning, and predictive analytics to derive valuable insights from complex data sets. These insights help businesses make informed decisions, optimize operations, and enhance customer experiences. EDW solutions cater to various industries, including finance, healthcare, retail, and manufacturing, among others. They offer benefits such as improved data accessibility, reduced data redundancy, and increased data security.
Table of Contents:
1 Executive Summary
2 Market Landscape
3 Market Sizing
4 Historic Market Size
5 Five Forces Analysis
6 Market Segmentation
Product TypeInformation And Analytical ProcessingData MiningDeploymentCloud BasedOn-premisesGeographyNorth AmericaEuropeAPACMiddle East And AfricaSouth America
7 Customer Landscape
8 Geographic Landscape
9 Drivers, Challenges, and Trends
10 Company Landscape
11 Company Analysis
12 Appendix
About Technavio
Technavio is a leading global technology research and advisory company. Their research and analysis focuses on emerging market trends and provides actionable insights to help businesses identify market opportunities and develop effective strategies to optimize their market positions.
With over 500 specialized analysts, Technavio’s report library consists of more than 17,000 reports and counting, covering 800 technologies, spanning across 50 countries. Their client base consists of enterprises of all sizes, including more than 100 Fortune 500 companies. This growing client base relies on Technavio’s comprehensive coverage, extensive research, and actionable market insights to identify opportunities in existing and potential markets and assess their competitive positions within changing market scenarios.
Contacts
Technavio Research
Jesse Maida
Media & Marketing Executive
US: +1 844 364 1100
UK: +44 203 893 3200
Email: media@technavio.com
Website: www.technavio.com/
View original content to download multimedia:https://www.prnewswire.com/news-releases/enterprise-data-warehouse-edw-market-size-is-set-to-grow-by-usd-39-23-billion-from-2024-2028–data-explosion-across-industries-boost-the-market-technavio-302182777.html
SOURCE Technavio
You may like
Technology
Horizon Petroleum Ltd. Announces Proposed $2,000,000 Secured Grid Promissory Note and Close of Its Shares for Debt Settlement
Published
53 minutes agoon
October 22, 2026By
/NOT FOR DISTRIBUTION TO U.S. NEWSWIRE SERVICES OR FOR DISSEMINATION IN THE UNITED STATES OF AMERICA. ANY FAILURE TO COMPLY WITH THIS RESTRICTION MAY CONSTITUTE A VIOLATION OF U.S. SECURITIES LAWS./
CALGARY, AB, Oct. 22, 2026 /CNW/ — Horizon Petroleum Ltd. (the “Company” or “Horizon”) (TSXV: HPL) (FRA: HPM) (Tradegate: HPM) is pleased to announce that it intends to enter into a secured grid promissory note (the “Promissory Note”) with Wilco Investments Ltd., a company controlled by Trevor Williams who is a director of the Company, in the aggregate principal amount of up to CAD $2,000,000.
The proceeds will be used to make deposits on three generators and on production facilities. The generators will have a combined generating capacity of 3 megawatts. This equipment is Horizon’s next investment in its gas to power strategy for its Lachowice natural gas development in Poland.
The Promissory Note will bear interest from the applicable issuance date at 12% per annum. The Promissory Note and accrued interest will be due on December 31, 2026 (the “Maturity Date”). The Maturity Date may be extended by mutual agreement between the parties. The Promissory Note may be prepaid in whole or in part at any time without penalty. The Promissory Note will be immediately due and payable upon completion by the Company of a financing of equity or debt of CAD $5,000,000 or more. The Promissory Note will be secured by Horizon’s electrical generating equipment in Poland.
The closing date is anticipated to be October 22, 2026.
Entering into the Promissory Note and the advance of funds thereunder are subject to the satisfaction of customary conditions, including the approval of the TSXV.
As Trevor Williams is a director of the Company, the Promissory Note will constitute a “related party transaction” pursuant to Multilateral Instrument 61-101 – Protection of Minority Security Holders in Special Transactions (“MI 61-101”). The Company intends to rely on the exemption from the formal valuation requirement pursuant to section 5.5(b) of MI 61-101 as the Company does not have securities listed on a specified market, and on the exemption from the minority shareholder approval requirement pursuant to section 5.7(1)(a) of MI 61-101 as the fair market value of the Promissory Note will not exceed 25% of the Company’s market capitalization.
In addition, the Company announces that it has completed an agreement to settle a total of CAD $524,000 of the Company’s debt (the “Debt”) with certain arm’s length and non-arm’s length parties (the “Shares for Debt Settlement”). The Debt payable to directors and officers of the Company who are Insiders (as such term is defined under the policies of the TSXV) is an aggregate of CAD $465,000 and the Company will settle the same by issuing to such parties 2,657,143 common shares at a deemed price of CAD $0.175 per common share. The Debt payable to arm’s length service providers is an aggregate of CAD $59,000 and the Company will settle the same by issuing to such parties 337,143 common shares at a deemed price of $0.175 per common share.
The Shares for Debt Settlement was approved by disinterested shareholders at the shareholder meeting held on July 28, 2026. All securities issued in connection with the Shares for Debt Settlement will be subject to a statutory four-month hold period in accordance with applicable securities legislation.
The Company has received final approval for the Shares for Debt Settlement from the TSXV.
The Company relied on exemptions from the formal valuation and minority approval requirements of sections 5.5(b) and 5.7(1)(a) of MI 61-101 in respect of such insider participation in the Shares for Debt Settlement, based on a determination that fair market value of the participation by insiders did not exceed 25% of the market capitalization of Horizon, as determined in accordance with MI 61-101.
About Horizon Petroleum Ltd.
Calgary-based Horizon Petroleum Ltd. is focused on the appraisal and development of natural gas resources and clean energy opportunities in Europe, with the objective of contributing to European energy independence and security. Horizon is advancing its Polish natural gas assets through a technically focused, phased development strategy designed to unlock their commercial potential. Horizon’s management team and Board of Directors comprise oil and gas, business and finance professionals with significant international experience.
Neither the TSX Venture Exchange nor its Regulation Services Provider (as that term is defined in the policies of the TSX Venture Exchange) accepts responsibility for the adequacy or accuracy of this release.
This press release contains “forward-looking statements” or “forward-looking information” (collectively referred to herein as “forward-looking statements”) within the meaning of applicable securities legislation. Such forward-looking statements include, without limitation, forecasts, estimates, expectations and objectives for future operations that are subject to a number of assumptions, risks and uncertainties, many of which are beyond the control of Horizon. Forward-looking statements are statements that are not historical facts and are generally, but not always, identified by the words “expects”, “plans”, “anticipates”, “believes”, “intends”, “estimates”, “projects”, “potential” and similar expressions, or that events or conditions “will”, “would”, “may”, “could” or “should” occur or be achieved. This press release contains forward-looking statements pertaining to, among other things, the Company entering into the Promissory Note, the terms of the Promissory Note, the anticipated closing date, reliance on exemptions under MI 61-101, the anticipated use of proceeds and the approval of the TSX-V.
Forward-looking information is based on current expectations, estimates and projections that involve a number of risks, which could cause actual results to vary and in some instances, to differ materially from those anticipated by Horizon and described in the forward-looking information contained in this press release.
Although Horizon believes that the material factors, expectations and assumptions expressed in such forward-looking statements are reasonable based on information available to it on the date such statements were made, no assurances can be given as to future results, levels of activity and achievements and such statements are not guarantees of future performance.
SOURCE Horizon Petroleum Ltd.
Technology
BMO Announces Cash Distributions for Certain BMO ETFs and ETF Series of BMO Mutual Funds for October 2026
Published
53 minutes agoon
October 22, 2026By
TORONTO, Oct. 22, 2026 /CNW/ — BMO Asset Management Inc., as manager of the BMO ETFs, and BMO Investments Inc., as manager of the BMO Mutual Funds, today announced the October 2026 cash distributions for unitholders of BMO ETFs and unitholders of exchange-traded series of units of the BMO Mutual Funds (collectively, the “ETF Series”)¹ that distribute monthly, as set out in the table below. Unitholders of record of the BMO ETFs and the ETF Series of the BMO Mutual Funds at the close of business on October 29, 2026, will receive cash distributions payable on November 3, 2026.
The ex-dividend date and record date for all BMO ETFs and ETF Series of BMO Mutual Funds is October 29, 2026.
Details of the per unit cash distribution amount are as follows:
Monthly Distributions
FUND NAME
FUND TICKER
CASH DISTRIBUTION PER UNIT $
BMO AAA CLO ETF
ZAAA
0.124
BMO AAA CLO ETF (Hedged Units)
ZAAA.F
0.117
BMO AAA CLO ETF (USD Units)*
ZAAA.U
0.120
BMO Aggregate Bond Index ETF
ZAG
0.038
BMO All-Equity ETF (Target Cash Flow Units)
ZEQT.T
0.100
BMO Asset-Backed Securities ETF
ZABS
0.123
BMO Asset-Backed Securities ETF (Hedged Units)
ZABS.F
0.119
BMO Asset-Backed Securities ETF (USD Units)*
ZABS.U
0.119
BMO Balanced ETF (Target Cash Flow Units)
ZBAL.T
0.049
BMO BBB CLO ETF
ZBBZ
0.163
BMO BBB CLO ETF (Hedged Units)
ZBBZ.F
0.155
BMO BBB CLO ETF (USD Units)*
ZBBZ.U
0.158
BMO Canadian Core Plus US Balanced ETF
ZBCB
0.060
BMO Canadian Dividend ETF
ZDV
0.075
BMO Canadian High Dividend Covered Call ETF
ZWC
0.120
BMO Canadian High Dividend Covered Call ETF (Target Cash Flow Units)
ZWC.T
0.333
BMO Canadian MBS Index ETF
ZMBS
0.082
BMO Core Bond Fund (ETF Series)
ZCRB
0.044
BMO Covered Call Canadian Banks ETF
ZWB
0.170
BMO Covered Call Canadian Banks ETF (Target Cash Flow Units)
ZWB.T
0.488
BMO Covered Call Canadian Banks ETF (USD Units)*
ZWB.U
0.210
BMO Covered Call Dow Jones Industrial Average Hedged to CAD ETF
ZWA
0.150
BMO Covered Call Dow Jones Industrial Average Hedged to CAD ETF (Target Cash Flow Units)
ZWA.T
0.413
BMO Covered Call Energy ETF
ZWEN
0.220
BMO Covered Call Energy ETF (Target Cash Flow Units)
ZWEN.T
0.488
BMO Covered Call Health Care ETF
ZWHC
0.160
BMO Covered Call Health Care ETF (Target Cash Flow Units)
ZWHC.T
0.413
BMO Covered Call Spread Gold Bullion ETF
ZWGD
0.170
BMO Covered Call Spread Gold Bullion ETF (Target Cash Flow Units)
ZWGD.T
0.333
BMO Covered Call Technology ETF
ZWT
0.350
BMO Covered Call Technology ETF (Target Cash Flow Units)
ZWT.T
0.413
BMO Covered Call US Banks ETF
ZWK
0.160
BMO Covered Call US Banks ETF (Target Cash Flow Units)
ZWK.T
0.450
BMO Covered Call Utilities ETF
ZWU
0.070
BMO Covered Call Utilities ETF (Target Cash Flow Units)
ZWU.T
0.625
BMO Credit Stress Opportunities ETF
ZCDX
0.000
BMO Credit Stress Opportunities ETF (USD Units)*
ZCDX.U
0.000
BMO Discount Bond Index ETF
ZDB
0.022
BMO Emerging Markets Bond Hedged to CAD Index ETF
ZEF
0.045
BMO Emerging Markets Bond Fund (ETF Series)
ZEMB
0.053
BMO Equal Weight Banks Index ETF
ZEB
0.150
BMO Equal Weight REITs Index ETF
ZRE
0.090
BMO Equal Weight Utilities Index ETF
ZUT
0.071
BMO Europe High Dividend Covered Call ETF
ZWP
0.110
BMO Europe High Dividend Covered Call ETF (Target Cash Flow Units)
ZWP.T
0.333
BMO Europe High Dividend Covered Call Hedged to CAD ETF
ZWE
0.120
BMO Europe High Dividend Covered Call Hedged to CAD ETF (Target Cash Flow Units)
ZWE.T
0.333
BMO Floating Rate High Yield ETF
ZFH
0.062
BMO Global Dividend Opportunities Fund (Active ETF Series)
ZGDV
0.034
BMO Global Enhanced Income Fund (ETF Series)
ZWQT
0.085
BMO Global High Dividend Covered Call ETF
ZWG
0.190
BMO Global High Dividend Covered Call ETF (Target Cash Flow Units)
ZWG.T
0.333
BMO Global Infrastructure Fund (Active ETF Series)
ZGIF
0.050
BMO Global REIT Fund (Active ETF Series)
ZGRT
0.055
BMO Government Bond Index ETF
ZGB
0.111
BMO Growth ETF (Target Cash Flow Units)
ZGRO.T
0.058
BMO High Yield US Corporate Bond Hedged to CAD Index ETF
ZHY
0.060
BMO High Yield US Corporate Bond Index ETF
ZJK
0.103
BMO High Yield US Corporate Bond Index ETF (USD Units)*
ZJK.U
0.098
BMO International Dividend ETF
ZDI
0.085
BMO International Dividend Hedged to CAD ETF
ZDH
0.085
BMO Laddered Preferred Share Index ETF
ZPR
0.060
BMO Laddered Preferred Share Index ETF (USD Units)*
ZPR.U
0.096
BMO Long Corporate Bond Index ETF
ZLC
0.053
BMO Long Federal Bond Index ETF
ZFL
0.027
BMO Long Provincial Bond Index ETF
ZPL
0.034
BMO Mid Corporate Bond Index ETF
ZCM
0.055
BMO Mid Federal Bond Index ETF
ZFM
0.035
BMO Mid Provincial Bond Index ETF
ZMP
0.043
BMO Mid-Term US IG Corporate Bond Hedged to CAD Index ETF
ZMU
0.049
BMO Mid-Term US IG Corporate Bond Index ETF
ZIC
0.071
BMO Mid-Term US IG Corporate Bond Index ETF (USD Units)*
ZIC.U
0.052
BMO Money Market Fund (ETF Series)
ZMMK
0.100
BMO Monthly Income ETF
ZMI
0.049
BMO Monthly Income ETF (USD Units)*
ZMI.U
0.026
BMO MSCI Canada IMI High Dividend Yield Index ETF
ZDIV
0.108
BMO Premium Yield ETF
ZPAY
0.200
BMO Premium Yield ETF (Hedged Units)
ZPAY.F
0.175
BMO Premium Yield ETF (USD Units)*
ZPAY.U
0.180
BMO Real Return Bond Index ETF
ZRR
0.060
BMO Short Corporate Bond Index ETF
ZCS
0.047
BMO Short Federal Bond Index ETF
ZFS
0.028
BMO Short Provincial Bond Index ETF
ZPS
0.024
BMO Short-Term US IG Corporate Bond Hedged to CAD Index ETF
ZSU
0.050
BMO Strategic Autocallable Income US Large Cap ETF
ZACU
0.305
BMO Strategic Autocallable Income US Large Cap ETF (Hedged Units)
ZACU.F
0.305
BMO Strategic Autocallable Income US Large Cap ETF (USD Units)*
ZACU.U
0.305
BMO Ultra Short-Term Bond ETF
ZST
0.110
BMO Ultra Short-Term US Bond ETF (USD Units)*
ZUS.U
0.178
BMO US Aggregate Bond Index ETF
ZUAG
0.075
BMO US Aggregate Bond Index ETF (Hedged Units)
ZUAG.F
0.069
BMO US Aggregate Bond Index ETF (USD Units)*
ZUAG.U
0.072
BMO US Dividend ETF
ZDY
0.080
BMO US Dividend ETF (USD Units)*
ZDY.U
0.060
BMO US Dividend Growth ETF
ZBDU
0.070
BMO US Dividend Growth ETF (Hedged Units)
ZBDU.F
0.070
BMO US Dividend Hedged to CAD ETF
ZUD
0.055
BMO US High Dividend Covered Call ETF
ZWH
0.140
BMO US High Dividend Covered Call ETF (Target Cash Flow Units)
ZWH.T
0.413
BMO US High Dividend Covered Call ETF (USD Units)*
ZWH.U
0.140
BMO US High Dividend Covered Call Hedged to CAD ETF
ZWS
0.120
BMO US High Dividend Covered Call Hedged to CAD ETF (Target Cash Flow Units)
ZWS.T
0.413
BMO US Preferred Share Hedged to CAD Index ETF
ZHP
0.080
BMO US Preferred Share Index ETF
ZUP
0.096
BMO US Preferred Share Index ETF (USD Units)*
ZUP.U
0.090
BMO US Put Write ETF
ZPW
0.125
BMO US Put Write ETF (USD Units)*
ZPW.U
0.125
BMO US Put Write Hedged to CAD ETF
ZPH
0.120
BMO USD Cash Management ETF
ZUCM
0.108
BMO USD Cash Management ETF (USD Units)*
ZUCM.U
0.104
*Cash distribution per unit ($) amounts are USD for ZAAA.U, ZABS.U, ZBBZ.U, ZWB.U, ZCDX.U, ZJK.U, ZPR.U, ZIC.U, ZMI.U, ZPAY.U, ZACU.U, ZUS.U, ZUAG.U, ZDY.U, ZWH.U, ZUP.U, ZPW.U, ZUCM.U.
1 BMO ETFs are managed by BMO Asset Management Inc., an investment fund manager, a portfolio manager, and a separate legal entity from Bank of Montreal. ETF Series of the BMO Mutual Funds are managed by BMO Investments Inc., an investment fund manager and a separate legal entity from Bank of Montreal
Any statement that necessarily depends on future events may be a forward-looking statement. Forward-looking statements are not guarantees of performance. They involve risks, uncertainties and assumptions. Although such statements are based on assumptions that are believed to be reasonable, there can be no assurance that actual results will not differ materially from expectations. Investors are cautioned not to rely unduly on any forward-looking statements. In connection with any forward-looking statements, investors should carefully consider the areas of risk described in the most recent prospectus.
This communication is for information purposes. The information contained herein is not, and should not be construed as, investment, tax or legal advice to any party. Investments should be evaluated relative to the individual’s investment objectives and professional advice should be obtained with respect to any circumstance.
The BMO ETFs or securities referred to herein (ZDIV) are not sponsored, endorsed or promoted by MSCI Inc. (MSCI), and MSCI bears no liability with respect to any such BMO ETFs or securities or any index on which such BMO ETFs or securities are based. The prospectus of the BMO ETFs contains a more detailed description of the limited relationship MSCI has with BMO Asset Management Inc. and any related BMO ETFs.
The Dow Jones Industrial Index is a product of S&P Dow Jones Indices LLC or its affiliates (SPDJI), and has been licensed for use by BMO Asset Management Inc. S&P®, S&P 500®, US 500, The 500, iBoxx®, iTraxx® and CDX® are trademarks of S&P Global, Inc. or its affiliates (S&P) and Dow Jones® is a registered trademark of Dow Jones Trademark Holdings LLC (Dow Jones), and these trademarks have been licensed for use by SPDJI and sublicensed for certain purposes by BMO Asset Management Inc. The relevant BMO ETF (ZWA, ZWA.T) is not sponsored, endorsed, sold or promoted by SPDJI, Dow Jones, S&P, their respective affiliates, and none of such parties make any representation regarding the advisability of investing in such product(s), nor do they have any liability for any errors, omissions, or interruptions of the Index.
BLOOMBERG® and the Bloomberg Index are service marks of Bloomberg Finance L.P. and its affiliates, including Bloomberg Index Services Limited (BISL), the administrator of the index (collectively, Bloomberg) and have been licensed for use for certain purposes by BMO Asset Management Inc. Bloomberg is not affiliated with BMO Asset Management Inc., and Bloomberg does not approve, endorse, review, or recommend any BMO ETFs. Bloomberg does not guarantee the timeliness, accuracy or completeness of any data or information relating to the BMO ETFs.
BMO ETFs are not in any way sponsored, endorsed, sold or promoted by FTSE Global Debt Capital Markets Inc. (FGDCM), FTSE International Limited (FTSE), Frank Russell Company (Frank Russell), FTSE Fixed Income LLC (FTSE FI) or the London Stock Exchange Group companies (together with FGDCM, FTSE, Frank Russell and FTSE FI, the Licensor Parties). The Licensor Parties make no claim, prediction, warranty or representation whatsoever, expressly or impliedly, either as to (i) the results to be obtained from the use of the FTSE BMO ETF Indices, (ii) the figure at which any of the FTSE BMO ETF Indices stands at any particular time on any particular day or otherwise, or (iii) the suitability of an Underlying Index for the particular purpose to which it is being put in connection with the FTSE BMO ETFs. Each of the FTSE BMO ETF Indices is compiled and calculated by FGDCM of FTSE and all copyright in any of the FTSE BMO ETF Indices values and constituent lists vests in FGDCM or FTSE, respectively. The Licensor Parties shall not be liable (whether in negligence or otherwise) to any person for any error in any of the FTSE BMO ETF Indices and the Licensor Parties shall not be under any obligation to advise any person of any error therein. FTSE® is a trade mark of the London Stock Exchange Group companies and is used under licence.
Commissions, management fees and expenses all may be associated with investments in BMO ETFs and ETF Series units of the BMO Mutual Funds. Please read the ETF facts, fund facts or prospectus of the relevant BMO ETF or ETF Series of BMO Mutual Fund before investing. BMO ETFs and ETF Series units of the BMO Mutual Funds are not guaranteed, their values change frequently and past performance may not be repeated. BMO ETFs and ETF Series units may be bought and sold at market price on a stock exchange and brokerage commissions will reduce returns.
Distributions are not guaranteed and are subject to change and/or elimination depending on market conditions. The payment of distributions should not be confused with an investment fund’s performance, rate of return or yield. If distributions paid by an investment fund are greater than the performance of the fund, investors’ original investment will shrink. Distributions of net income and net taxable gains of a BMO ETF or an ETF Series will be included in the unitholder’s income for tax purposes in the year they are paid, whether or not such amounts are reinvested in additional units. A unitholder’s adjusted cost base (“ACB”) will be reduced by the amount of any return of capital (“ROC”). If a unitholder’s ACB goes below zero, such unitholder will have to pay capital gains tax on the amount below zero. Please refer to the summary of the principal income tax considerations set out in the prospectus for the relevant BMO ETF or ETF Series. Investors should also consult their own tax advisors about their individual circumstances.
The Target Cash Flow Units are subject to capital depletion risk. Target Cash Flow Units make monthly distributions of a fixed amount which may be comprised of, in whole or in part, a ROC. A ROC reduces the amount of an original investment and may result in the return to investors of the entire amount of an original investment.
The Target Cash Flow Units’ monthly distribution dollar amount is reset at the beginning of each calendar year. The dollar amount is a factor of the annualized distribution rate for the Target Cash Flow Units (which is the rate set out in the individual BMO ETF profiles in the applicable BMO ETF’s prospectus), the net asset value per unit of a series of a BMO ETF (NAVPS) as of the end of the previous calendar year, and the number of Target Cash Flow Units of the BMO ETF held at the time of the distribution. Although not expected, we may also adjust the monthly distribution during the year, if capital market conditions have significantly affected the ability of the BMO ETF to maintain the applicable distribution. If we make any such adjustment to the monthly distribution, we will issue a press release to communicate the change. The distribution rate applicable to the Target Cash Flow Units may be higher than the rate of return or the portfolio yield of the BMO ETF that offers such units. As a result, if you elect to receive some or all of the regular monthly distributions in cash, the value of your investment in the BMO ETF may decline over time.
For a summary of the risks of an investment in the BMO ETFs or ETF Series units of the BMO Mutual Funds, please see the specific risks set out in the relevant ETF facts, fund facts or prospectus. BMO ETFs and ETF Series units of the BMO Mutual Funds trade like stocks, fluctuate in market value and may trade at a discount to their net asset value, which may increase the risk of loss.
BMO ETFs are managed by BMO Asset Management Inc., an investment fund manager, a portfolio manager, and a separate legal entity from Bank of Montreal. BMO Mutual Funds are managed by BMO Investments Inc., an investment fund manager and a separate legal entity from Bank of Montreal.
BMO Global Asset Management is a brand name under which BMO Asset Management Inc. and BMO Investments Inc. operate.
“BMO (M-bar roundel symbol)” is a registered trademark of Bank of Montreal, used under licence.
Further information about BMO ETFs and ETF Series of the BMO Mutual Funds can be found at www.bmoetfs.com.
About BMO Financial Group
BMO Financial Group is the eighth largest bank in North America by assets, with total assets of $1.5 trillion as of July 31, 2026. Serving clients for more than 200 years, BMO provides a broad range of personal and commercial banking, wealth management, global markets and investment banking products and services across Canada, the United States, and select markets globally. BMO is innovating for business value, by deploying and integrating human, digital and artificial intelligence to personalize client experiences, augment teams, and automate its business responsibly. Driven by its purpose, to Boldly Grow the Good in business and life, BMO is committed to driving positive change in the world, and making progress for a thriving economy, sustainable future, and stronger communities.
SOURCE BMO Financial Group
Technology
ACL Digital Launches AgentixCare, a Human-in-the-Loop Agentic AI Platform for Healthcare Payers, Providers, and MedTech
Published
54 minutes agoon
October 22, 2026By
The AI-first platform applies agentic AI, generative AI, and predictive models across clinical care, revenue cycle management, and connected MedTech, with humans in control of every critical decision.
SAN JOSE, Calif., Oct. 22, 2026 /PRNewswire/ — ACL Digital, part of the ALTEN Group, today announced the launch of AgentixCare, a Human-in-the-Loop (HITL) Agentic AI platform for healthcare payers, providers, and MedTech organizations. A trusted AI-led Digital Enterprise & Systems Engineering Partner, ACL Digital drives innovation by designing and building intelligent systems across the full technology stack, from chip-to-cloud.
Traditional healthcare platforms record what happened but rarely act on it. Fragmented EHRs, manual prior authorizations, rising claim denials, and disconnected device data bury clinicians in documentation and leave revenue teams chasing paperwork. AgentixCare closes that gap, cutting costs by up to 30–50% while improving productivity, care quality, cash flow, and asset uptime, with HITL oversight at every decision point.
“Healthcare does not need another dashboard. It needs AI that does real clinical, financial, and operational work, safely. AgentixCare puts autonomous agents to work on the tasks that slow care down, from prior authorizations to denials to documentation, while keeping clinicians firmly in control. That is how our clients will move from AI pilots to measurable outcomes in weeks, not years,” said Ramandeep Singh, CEO of ACL Digital.
Unlike point solutions that bolt AI onto legacy workflows, the platform is built AI-first. Its agents assess data, gather clinical and policy evidence, assemble submissions, trace root causes, and recommend next-best actions.
End-to-End Coverage Across the Healthcare Value Chain
Clinical Care & Intelligence: EHR-ready AI notes, predictive early warnings, real-time clinical decision support (CDS), and formulary mapping.Agentic Revenue Cycle & Payer Operations: Electronic prior authorization and end-to-end claim and denial management, from scrubbing to recovery and reconciliation.Intelligent Connected MedTech: Predictive maintenance, performance analytics, a GenAI copilot for surgical robotics fleets, and infusion pump monitoring.AI-Governed Trust, Risk & Compliance: A compliance copilot for HIPAA and HITECH readiness.Future-Ready Interoperability: HL7 v2, FHIR R4, and SMART on FHIR connectors for leading enterprise and open-source EMRs.
The platform is designed to significantly reduce manual prior authorization work and administrative costs, speed up routine authorization decisions, cut claim denials and unplanned device downtime, catch more patient anomalies, and deliver faster answers through AI copilots and natural language processing.
“We engineered AgentixCare the way we build medical-grade systems: interoperable from day one, secure by design, and governed end to end. Every agent works on FHIR and HL7 data, every recommendation shows its evidence, and every action is approved and recorded. That combination of agentic AI and Human-in-the-Loop governance is what makes enterprise adoption fast and safe,” said Suresh Venkateswaran, Head – Digital Product Engineering Services at ACL Digital.
AgentixCare draws on ACL Digital’s decades of domain and product engineering experience with healthcare, life sciences, and medical device companies. Developed by the company’s Healthcare Center of Excellence, it combines first-hand knowledge of Clinical, Payer, and MedTech workflows with interoperability standards and responsible AI practices.
AgentixCare is available now for pilot programs. To request a demonstration, visit AgentixCare programs.
About ACL Digital
ACL Digital, part of the ALTEN Group, is a trusted AI-led Digital Enterprise & Systems Engineering Partner driving innovation by designing and building intelligent systems across the full technology stack from chip to cloud. By integrating AI and data-powered solutions, we help enterprises accelerate digital transformation, optimize operations, and achieve scalable business outcomes. Partner with us to turn complexity into clarity and shape the future of your organization. Learn more at www.acldigital.com.
View original content to download multimedia:https://www.prnewswire.com/news-releases/acl-digital-launches-agentixcare-a-human-in-the-loop-agentic-ai-platform-for-healthcare-payers-providers-and-medtech-302916672.html
SOURCE ACL Digital
Horizon Petroleum Ltd. Announces Proposed $2,000,000 Secured Grid Promissory Note and Close of Its Shares for Debt Settlement
BMO Announces Cash Distributions for Certain BMO ETFs and ETF Series of BMO Mutual Funds for October 2026
ACL Digital Launches AgentixCare, a Human-in-the-Loop Agentic AI Platform for Healthcare Payers, Providers, and MedTech
Send Rakhi to UK swiftly with UK Gifts Portal
Whiteboard Series with NEAR | Ep: 45 Joel Thorstensson from ceramic.network
Nullmax and Renesas Forge Strategic Partnership to Deliver Competitive ADAS Solutions for the Global Market
Why You Should Build on #NEAR – Co-founder Illia Polosukhin at CV Labs
Whiteboard Series with NEAR | Ep: 45 Joel Thorstensson from ceramic.network
NEAR End of Year Town Hall 2021: The Open Web World, MetaBUILD 2 Hackathon and 2021 recap
Trending
-
Technology4 days agoBioethanol from human hair – Indian start-up’s solution to rising prices of grains and sugar
-
Technology3 days agoGMIF2026: AI Inference Powers the “Token Factory” and Drives System-Level Rethinking of Memory & Storage
-
Technology3 days agoInstaMall Launches Same-Day Fashion Delivery Experience, Bringing 80+ Brands to Shoppers’ Doors in Miami
-
Technology3 days agoTruecaller announces preliminary numbers for the third quarter 2026
-
Coin Market3 days agoWorld Liberty’s USD1 stablecoin sheds $400M in market cap in two weeks
-
Technology4 days agoLinktel Technologies Highlights Breakthrough 1.6T LPO Performance & Strong Market Pull at OCP 2026
-
Technology3 days agoSALMON SECURES $140 MILLION (PHP 8.8 BILLION) TO DOUBLE DOWN ON THE GROWTH OPPORTUNITY IN THE PHILIPPINES
-
Technology3 days agoTreasuries Rallied as Tech Slid, and the Crowded Bet Against Bonds Felt It