Connect with us

Technology

Nauticus Robotics Announces Results for the Second Quarter of 2024

Published

on

HOUSTON, Aug. 13, 2024 /PRNewswire/ — Nauticus Robotics, Inc. (NASDAQ: KITT), a leading innovator in subsea robotics and software, today announced its financial results for the quarter ended June 30, 2024.

“I would like to thank our existing lenders for their continued support. Their steady conversion of warrants and convertible debentures improve our market cap and reduce our interest burden and our leverage,” said John Gibson, Nauticus’ CEO and President. “We successfully completed Phase I of a program for the largest offshore producer in Brazil. This phase has been billed and collected. We expect to complete Phase II without additional deepwater tests and can execute a significant portion of Phase III while in the Gulf of Mexico this year. We are committed to delivering supervised autonomy to subsea assets during Q3.”

Operational Highlights

Vehicle 2 Testing: Nauticus’ flagship vehicle, Aquanaut Mark 2 (Vehicle 2), underwent planned maintenance this quarter before shipping to Florida Atlantic University (FAU) for open water testing of capabilities refined after the vehicle’s initial Gulf of Mexico (GOM) testing during the first half of the year. The vehicle is planned to ship to Louisiana this month in anticipation of completing qualification testing.

Vehicle 1 Assembly: Vehicle 1 deepwater electronics upgrades are ongoing. Once the vehicle is fully assembled it is planned to ship to FAU to continue development and testing of the next set of vehicle capabilities. Vehicle 1 will become the test and qualification vehicle for these capabilities while Vehicle 2 remains revenue generating. Once new capability qualifications are complete, they will be loaded onto Vehicle 2 to expand Nauticus’ revenue generating opportunities by having two working vehicles with additional capabilities.

Vehicle 3 Assembly: Assembly of Vehicle 3 remains pending. Company focus has been on Vehicles 1 and 2 throughout the quarter.

FAU versus GOM Testing: The partnership with FAU for open water testing allows Nauticus to continue testing Vehicle 2 at a reduced cost compared to GOM open water testing. In addition, FAU provides the team with warehousing and shop facilities to perform minor maintenance as needed. The Atlantic Coast provides multiple deepwater locations close to shore containing bottom artifacts to fully test sensors and capabilities. These benefits will continue with testing of Vehicle 1 once its deepwater upgrades are complete.

Revenue: Nauticus reported second-quarter revenue of $0.5 million, compared to $1.1 million for the prior-year period and $0.5 million for the prior quarter. Q2 includes revenue recognized for the largest South American deepwater operator, an important step in reducing dependence on historical defense revenues.

Operating Expenses: Total expenses during the second quarter were $6.5 million, a $1.5 million decrease from the prior-year period, and a $0.5 million increase from Q1 2024.

Net Income: For the second quarter, Nauticus recorded a net loss of $5.4 million, or basic loss per share of $2.75. This compares with a net income of $20.7 million from the same period in 2023, and a net income of $0.4 million in the prior quarter.

Adjusted Net Loss: Nauticus reported adjusted net loss of $9.0 million for the second quarter, compared to $6.8 million for the same period in 2023. Adjusted net loss is a non-GAAP measure which excludes the impact of certain items, as shown in the non-GAAP reconciliation table below.

2024 G&A Cost: Nauticus reported G&A second-quarter costs of $3.2 million, which is a decrease of $2.3 million compared to the same period in 2023.

Balance Sheet and Liquidity

As of June 30, 2024, the Company had cash and cash equivalents of $8.1 million, compared to $0.8 million as of December 31, 2023.

In Q2, the Company closed additional debt financing of $1 million and raised $9.4 million through an at-the-market equity offering to provide liquidity needed for operations and testing.

Conference Call Details

Nauticus will host a conference call on August 14, 2024 at 10:00 a.m. Central Daylight Time (11:00 a.m. EDT) to discuss its results for the quarter ending June 30, 2024. To participate in the earnings conference call, participants should dial toll free at 800-445-7795, conference ID: KITT, or access the listen-only webcast at the following link: https://events.q4inc.com/attendee/706796022. A link to the webcast will also be available on the Company’s website (https://ir.nauticusrobotics.com/). Following the conclusion of the call, a recording will be available on the Company’s website.

About Nauticus Robotics

Nauticus Robotics, Inc. develops autonomous robots for the ocean industries. Autonomy requires the extensive use of sensors, artificial intelligence, and effective algorithms for perception and decision allowing the robot to adapt to changing environments. The company’s business model includes using robotic systems for service, selling vehicles and components, and licensing of related software to both the commercial and defense business sectors. Nauticus has designed and is currently testing and certifying a new generation of vehicles to reduce operational cost and gather data to maintain and operate a wide variety of subsea infrastructure. Besides a standalone service offering and forward-facing products, Nauticus’ approach to ocean robotics has also resulted in the development of a range of technology products for retrofit/upgrading traditional ROV operations and other third-party vehicle platforms. Nauticus’ services provide customers with the necessary data collection, analytics, and subsea manipulation capabilities to support and maintain assets while reducing their operational footprint, operating cost, and greenhouse gas emissions, to improve offshore health, safety, and environmental exposure. 

Cautionary Language Regarding Forward-Looking Statements

This press release contains forward-looking statements within the meaning of Section 21E of the Securities Exchange Act of 1934, as amended (the “Act”), and are intended to enjoy the protection of the safe harbor for forward-looking statements provided by the Act as well as protections afforded by other federal securities laws. Such forward-looking statements include but are not limited to: the expected timing of product commercialization or new product releases; customer interest in Nauticus’ products; estimated operating results and use of cash; and Nauticus’ use of and needs for capital. Generally, statements that are not historical facts, including statements concerning possible or assumed future actions, business strategies, events, or results of operations, are forward-looking statements. These statements may be preceded by, followed by, or include the words “believes,” “estimates,” “expects,” “projects,” “forecasts,” “may,” “will,” “should,” “seeks,” “plans,” “scheduled,” “anticipates,” “intends,” or “continue” or similar expressions. Forward-looking statements inherently involve risks and uncertainties that may cause actual events, results, or performance to differ materially from those indicated by such statements. These forward-looking statements are based on Nauticus’ management’s current expectations and beliefs, as well as a number of assumptions concerning future events. There can be no assurance that the events, results, or trends identified in these forward-looking statements will occur or be achieved. Forward-looking statements speak only as of the date they are made, and Nauticus is not under any obligation and expressly disclaims any obligation, to update, alter, or otherwise revise any forward-looking statement, whether as a result of new information, future events, or otherwise, except as required by law. Readers should carefully review the statements set forth in the reports which Nauticus has filed or will file from time to time with the Securities and Exchange Commission (the “SEC”) for a more complete discussion of the risks and uncertainties facing the Company and that could cause actual outcomes to be materially different from those indicated in the forward-looking statements made by the Company, in particular the sections entitled “Risk Factors” and “Cautionary Note Regarding Forward-Looking Statements” in documents filed from time to time with the SEC, including Nauticus’ Annual Report on Form 10-K filed with the SEC on April 10, 2024. Should one or more of these risks, uncertainties, or other factors materialize, or should assumptions underlying the forward-looking information or statements prove incorrect, actual results may vary materially from those described herein as intended, planned, anticipated, believed, estimated, or expected. The documents filed by Nauticus with the SEC may be obtained free of charge at the SEC’s website at www.sec.gov


NAUTICUS ROBOTICS, INC.
UNAUDITED CONDENSED CONSOLIDATED BALANCE SHEETS

June 30, 2024

December 31, 2023

(Unaudited)

ASSETS

Current Assets:

Cash and cash equivalents

$                    8,122,943

$                       753,398

Restricted certificate of deposit

51,223

201,822

Accounts receivable, net

176,458

212,428

Inventories

2,217,507

2,198,797

Contract assets

482,576

Prepaid expenses

1,283,088

1,889,218

Other current assets

490,419

1,025,214

Assets held for sale

289,430

2,940,254

Total Current Assets

13,113,644

9,221,131

Property and equipment, net

16,500,849

15,904,845

Operating lease right-of-use assets

1,380,434

834,972

Other assets

204,296

187,527

Total Assets

$                  31,199,223

$                  26,148,475

LIABILITIES AND STOCKHOLDERS’ DEFICIT

Current Liabilities:

Accounts payable

$                    5,594,270

$                    7,035,450

Accrued liabilities

5,212,935

7,339,099

Contract liability

457,872

2,767,913

Operating lease liabilities – current

420,910

244,774

Total Current Liabilities

11,685,987

17,387,236

Warrant liabilities

1,192,693

18,376,180

Operating lease liabilities – long-term

1,035,713

574,260

Notes payable – long-term, net of discount (related party)

46,644,908

31,597,649

Total Liabilities

$                  60,559,301

$                  67,935,325

Stockholders’ Deficit

Common stock, $0.0001 par value; 625,000,000 shares authorized, 4,131,426
     and 1,389,884 shares issued, respectively, and 4,131,426 and 1,389,884
     shares outstanding, respectively (As adjusted)

$                               413

$                               139

Additional paid-in capital (As adjusted)

94,390,920

77,004,714

Accumulated deficit

(123,751,411)

(118,791,703)

Total Stockholders’ Deficit

(29,360,078)

(41,786,850)

Total Liabilities and Stockholders’ Deficit

$                  31,199,223

$                  26,148,475


NAUTICUS ROBOTICS, INC.
Unaudited Condensed Consolidated Statements of Operations

Three Months Ended

Six Months Ended

6/30/2024

3/31/2024

6/30/2023

6/30/2024

6/30/2023

Revenue:

Service

$          501,708

$          464,354

$      1,128,115

$          966,062

$      3,948,395

Service – related party

500

Total revenue

501,708

464,354

1,128,115

966,062

3,948,895

Costs and expenses:

Cost of revenue (exclusive of items shown
separately below)

2,875,394

2,093,955

1,900,602

4,969,349

4,832,869

Depreciation

411,586

426,185

53,209

837,771

326,308

Research and development

63,534

482,761

63,534

709,728

General and administrative

3,227,288

3,430,010

5,560,565

6,657,298

10,773,209

Total costs and expenses

6,514,268

6,013,684

7,997,137

12,527,952

16,642,114

Operating loss

(6,012,560)

(5,549,330)

(6,869,022)

(11,561,890)

(12,693,219)

Other (income) expense:

Other (income) expense, net

118,274

(96,473)

746

21,801

1,153,127

Gain on lease termination

(8,532)

(15,365)

(3,908)

(23,897)

(3,908)

Foreign currency transaction loss (gain)

4,296

5,147

(17,709)

9,443

(27,593)

Loss on exchange of warrants

590,266

590,266

Change in fair value of warrant liabilities

(4,422,701)

(8,309,623)

(29,668,454)

(12,732,324)

(27,431,550)

Interest expense, net

3,669,423

2,453,372

1,556,597

6,122,795

6,491,664

Total other income, net

(639,240)

(5,962,942)

(27,542,462)

(6,602,182)

(19,227,994)

Net income (loss)

$     (5,373,320)

$          413,612

$    20,673,440

$    (4,959,708)

$      6,534,775

Basic earnings (loss) per share (As adjusted)

$               (2.75)

$                 0.33

$              18.62

$              (2.97)

$                5.90

Diluted earnings (loss) per share (As adjusted)

$               (2.75)

$               (4.06)

$              17.70

$              (2.97)

$                5.79

Basic weighted average shares outstanding (As
adjusted)

1,950,563

1,239,881

1,110,091

1,667,187

1,107,580

Diluted weighted average shares outstanding (As
adjusted)

1,950,563

1,853,967

1,231,814

1,667,187

1,127,853


NAUTICUS ROBOTICS, INC.
UNAUDITED CONDENSED CONSOLIDATED STATEMENTS OF CASH FLOWS

Six Months ended June 30,

2024

2023

Cash flows from operating activities:

Net income (loss)

$         (4,959,708)

$           6,534,775

Adjustments to reconcile net income (loss) to net cash used in operating activities:

Depreciation

837,771

326,308

Amortization of debt discount

3,242,443

1,878,376

Amortization of debt issuance cost

312,440

Accretion of RCB Equities #1, LLC exit fee

48,475

Stock-based compensation

1,339,965

3,077,027

Loss on exchange of warrants

590,266

Change in fair value of warrant liabilities

(12,732,324)

(27,431,550)

Non-cash impact of lease accounting

171,962

145,253

Gain on disposal of assets

(3,102)

Write off of property and equipment

29,350

Gain on lease termination

(23,897)

Gain on short-term investments

(40,737)

Changes in current assets and liabilities:

Accounts receivable

35,969

319,940

Inventories

(18,710)

(5,869,092)

Contract assets

(482,576)

(37,341)

Other assets

1,232,368

(1,045,514)

Accounts payable and accrued liabilities

(1,715,646)

8,733,185

Contract liabilities

(2,310,041)

Operating lease liabilities

(55,937)

(193,257)

Net cash used in operating activities

(15,051,198)

(13,012,361)

Cash flows from investing activities:

Capital expenditures

(351,942)

(6,102,253)

Proceeds from sale of assets held for sale

419,720

Proceeds from sale of property and equipment

6,802

Proceeds from sale of short-term investments

5,000,000

Net cash from (used in) investing activities

74,580

(1,102,253)

Cash flows from financing activities:

Proceeds from notes payable

14,305,000

Payment of debt issuance costs on notes payable

(1,316,791)

Proceeds from at-the-market (ATM) offering

9,857,857

Payment of at-the-market (ATM) commissions and fees

(499,903)

Proceeds from exercise of stock options

342,579

Proceeds from exercise of warrants

338,055

Net cash from financing activities

22,346,163

680,634

Net change in cash and cash equivalents

7,369,545

(13,433,980)

Cash and cash equivalents, beginning of year

753,398

17,787,159

Cash and cash equivalents, end of year

$           8,122,943

$           4,353,179

NAUTICUS ROBOTICS, INC.
Unaudited Reconciliation of Net Income (Loss) Attributable to Common Stockholders (GAAP) to Adjusted Net Loss
 Attributable to Common Stockholders (NON-GAAP)

Adjusted net loss attributable to common stockholders is a non-GAAP financial measure which excludes certain items that are included in net income (loss) attributable to common stockholders, the most directly comparable GAAP financial measure. Items excluded are those which the Company believes affect the comparability of operating results and are typically excluded from published estimates by the investment community, including items whose timing and/or amount cannot be reasonably estimated or are non-recurring.

Adjusted net loss attributable to common stockholders is presented because management believes it provides useful additional information to investors for analysis of the Company’s fundamental business on a recurring basis. In addition, management believes that adjusted net loss attributable to common stockholders is widely used by professional research analysts and others in the valuation, comparison, and investment recommendations of companies such as Nauticus.

Adjusted net loss attributable to common stockholders should not be considered in isolation or as a substitute for net income (loss) attributable to common stockholders or any other measure of a company’s financial performance or profitability presented in accordance with GAAP. A reconciliation of the differences between net income (loss) attributable to common stockholders and adjusted net loss attributable to common stockholders is presented below. Because adjusted net loss attributable to common stockholders excludes some, but not all, items that affect net income (loss) attributable to common stockholders and may vary among companies, our calculation of adjusted net loss attributable to common stockholders may not be comparable to similarly titled measures of other companies.

Three Months Ended

Six Months Ended

6/30/2024

3/31/2024

6/30/2023

6/30/2024

6/30/2023

Net income (loss) attributable to common stockholders
(GAAP)

$  (5,373,320)

$        413,612

$  20,673,440

$  (4,959,708)

$    6,534,775

Change in fair value of warrant liabilities

(4,422,701)

(8,309,623)

(29,668,454)

(12,732,324)

(27,431,550)

Stock compensation expense

809,310

432,053

1,214,863

1,339,965

3,077,027

Sales and use tax assessment

1,189,164

Loss on exchange of warrants

590,266

590,266

Interest and penalties on RRA Amendment

362,045

4,320,690

Adjusted net loss attributable to common stockholders
(non-GAAP)

$  (8,986,711)

$   (7,463,958)

$  (6,827,840)

$  (16,352,067)

$  (11,719,628)


View original content to download multimedia:https://www.prnewswire.com/news-releases/nauticus-robotics-announces-results-for-the-second-quarter-of-2024-302221750.html

SOURCE Nauticus Robotics, Inc.

Continue Reading
Click to comment

Leave a Reply

Your email address will not be published. Required fields are marked *

Technology

Secretary of State Belanger announces expansion of high-speed Internet access in Saskatchewan

Published

on

By

Federal investment of over $141 million will help connect more than 30,000 homes to high–speed Internet

HUMBOLDT, SK, July 24, 2026 /CNW/ — Reliable and affordable high-speed Internet is essential for all Canadians. It enables access to important online resources, connects friends and families, and drives economic growth and innovation. This is why the Government of Canada is helping bring high-speed Internet access to underserved communities–including Indigenous communities–in Saskatchewan.

Today, the Honourable Buckley Belanger, Secretary of State for Rural Development, announced over $141 million in federal funding for six projects to bring high-speed Internet access to more than 30,000 households in over 500 rural and remote communities across Saskatchewan.

This funding is provided through the Universal Broadband Fund, a program designed to ensure that Canadians in rural, remote and Indigenous communities have access to reliable high-speed Internet.

The Government of Canada has committed to ensuring that every household in Canada has access to high-speed Internet by 2030, and it is on track to meet this connectivity target. These projects will build toward that goal, and the government will continue to invest in infrastructure that creates new opportunities and makes sure communities can benefit from all of Canada’s potential.

Quotes

“High-speed Internet is no longer just a luxury–it’s essential infrastructure, no matter where you live in Canada. It’s how people access health care virtually, start a business or just stay in touch with their loved ones. That’s why we made a historic commitment to provide 100% of Canadian households with access to high-speed Internet by 2030. The projects announced today are a major milestone for connectivity in Saskatchewan, providing reliable and affordable high-speed Internet to more than 30,000 underserved homes in over 500 rural and remote communities across the province.”
– The Honourable Buckley Belanger, Secretary of State for Rural Development

“In many rural and remote areas, connectivity projects like these face a number of financial and structural barriers. Federal tools like the Canada Infrastructure Bank help bridge that gap, ensuring critical infrastructure is built where it otherwise would not be. By supporting initiatives like this, we are advancing economic growth today and helping close the connectivity gap for underserved communities well into the future.”
– The Honourable Gregor Robertson, Minister of Housing and Infrastructure and Minister responsible for Pacific Economic Development Canada

“Access to dependable high-speed Internet should not be determined by where people live. Thanks to support from the Government of Canada through the Universal Broadband Fund, RFNOW is delivering the infrastructure needed to connect underserved rural and First Nations communities across Saskatchewan. Together, we are building a stronger digital future that will enhance economic development, support essential services and improve quality of life for thousands of Canadians.”
– Chris Kennedy, Chief Executive Officer, RFNOW Inc.

“Every community deserves the opportunity that comes with access to reliable high-speed Internet–and that’s exactly what this investment delivers. In partnership with the Government of Canada’s Universal Broadband Fund, Xplore is bringing high-speed Internet connectivity to nearly 20,000 homes and businesses in Saskatchewan. Better connectivity means more than faster downloads–it means students can learn without interruption, families can access health care from home, and local businesses can compete on a level playing field.”
– Brent Johnston, Chief Executive Officer, Xplore Inc.

“Since our establishment in 2007, we have been committed to providing dependable Internet service and strengthening connections in the communities we serve. With support from the Government of Canada’s Universal Broadband Fund, we’re excited to expand our network and introduce new 6 GHz fixed wireless technology capable of delivering speeds of up to 1 Gbps. This project will help more residents of rural and remote communities access the reliable high-speed connectivity they need for work, education, health care, business and everyday life.”
– Allen Stafford, President, Stafford Communications Inc.

“Beaver River Broadband has secured federal Universal Broadband Fund support to deliver fibre-to-the-home infrastructure directly to Peepeekisis Cree Nation. This critical investment guarantees gigabit-capable Internet access that will transform local opportunities in digital education, remote health care and community-led economic development. Crucially, the project underscores the importance of partnering with smaller, regional Internet providers that bring deep community roots, agile deployment and a dedicated focus on serving areas that larger national carriers often overlook. As an Indigenous-led regional provider working closely with First Nations, Beaver River Broadband understands the unique needs of the area and delivers tailored, reliable customer support on the ground. Empowering local providers through initiatives like the Universal Broadband Fund ensures that underserved First Nations are not just connected but also supported by partners invested in their long-term digital sovereignty.”
– John DeGraauw, CEO, Beaver River Broadband

“MCSnet’s fibre-to-the-tower expansion in Saskatchewan will deliver fast, highly reliable Internet access to underserved homes in rural Saskatchewan, courtesy of a dedicated, community-invested provider. As a family-owned company based in the Prairies, we have been serving rural communities with our innovative technology and exceptional customer service for over 30 years.”
– Jerome VanBrabant, Chief Projects Officer, MCSnet

Quick facts

Canada’s Connectivity Strategy aims to provide all Canadians with access to Internet speeds of at least 50 megabits per second (Mbps) download / 10 Mbps upload.The Universal Broadband Fund is a $3.225 billion investment by the Government of Canada designed to help provide high-speed Internet access to 98% of Canadian households by the end of 2026 and achieve the national target of 100% access by 2030.Today, 97.4% of Canadian households have access to high-speed Internet, compared to just 79% in 2014.In Saskatchewan, 89.2% of households currently have access to high-speed internet.Since 2015, the Government of Canada has invested $242 million in connectivity projects in Saskatchewan.The Canada Infrastructure Bank has committed more than $2 billion toward digital (broadband) infrastructure, closing last-mile connectivity gaps across Canada.Indigenous women, girls, Two-Spirit individuals and gender diverse people are more likely to go missing or be murdered than non-Indigenous women. Better connectivity means more tools in moments of danger, enabling victims of violence to access critical online resources and get help when they need it most.Building on the Building a Green Prairie Economy Act, the Government of Canada launched the Prairie Partnership Initiative to build a dynamic, sustainable and inclusive economy in the Prairie provinces.

Associated links

Rural economic developmentHigh-Speed Internet Access DashboardUniversal Broadband FundBackgrounder: Universal Broadband Fund and Telesat low Earth orbit capacity agreementCanada Infrastructure Bank: Digital Infrastructure and AIHigh-Speed Access for All: Canada’s Connectivity StrategyNational Broadband MapFederal Pathway to Address Missing and Murdered Indigenous Women, Girls and 2SLGBTQQIA+ PeoplePrairie Partnership Initiative

Stay connected

Follow Innovation, Science and Economic Development Canada on social media. X (Twitter): @ISED_CA | Facebook: Canadian Innovation | Instagram: @cdninnovation | LinkedIn: Innovation, Science and Economic Development Canada

For easy access to government programs for businesses, download the Canada Business app.

SOURCE Innovation, Science and Economic Development Canada

Continue Reading

Technology

Fragmented Web Strategies Leave Organizations Exposed as Digital Expectations Rise, Warns Info-Tech Research Group

Published

on

By

Organizations are increasingly focused on modernizing their digital presence to meet rising user expectations, yet many still rely on decentralized content models, inconsistent governance, and legacy platforms. New findings from Info-Tech Research Group show that without a structured web experience management (WEM) strategy, web initiatives often fail to align with business goals and user needs. The firm’s blueprint Develop Your Web Experience Management Strategy provides a five-phase framework and tools to help IT leaders strengthen governance and align web priorities with organizational objectives.

ARLINGTON, Va., July 24, 2026 /CNW/ — Organizations continue to invest in digital platforms and web modernization efforts, but progress is often limited by unclear priorities, inconsistent ownership, and a lack of shared performance measures. New insights from Info-Tech Research Group indicate that without a clear understanding of web experience maturity and readiness, digital investments fail to translate into consistent and measurable outcomes. The global research and advisory firm’s recently published blueprint, Develop Your Web Experience Management Strategy, provides a structured five-phase methodology to assess current-state capabilities, define priority audiences and journeys, and build a practical roadmap for evolving the web ecosystem in alignment with organizational objectives.

“Web experience management has moved beyond basic websites to become a core driver of growth and engagement,” says Hriday Gulrajani, senior research analyst at Info-Tech Research Group. “CIOs and IT leaders need to align marketing, data, and technology teams under clear governance and a structured roadmap to deliver consistent, scalable digital experiences.”

Info-Tech’s blueprint shows that many organizations treat web modernization as a technology upgrade rather than a coordinated experience strategy. As a result, content operations remain decentralized, integration between core systems such as CMS, CRM, and analytics platforms is inconsistent, and governance responsibilities are not clearly defined. While capabilities such as personalization, automation, and advanced analytics offer opportunities to improve engagement and operational efficiency, organizations often lack a structured framework for prioritizing initiatives and measuring progress across the web ecosystem.

Key Challenges IT Leaders Face in Web Experience Management
Despite ongoing investment in digital platforms and experience initiatives, many organizations encounter structural and operational barriers that limit progress. Info-Tech’s research highlights several persistent challenges:

Content decisions are often made in silos, resulting in inconsistent messaging, fragmented governance, and unclear ownership across teams.Limited integration between CMS, CRM, analytics, and other core systems restricts visibility into user behavior and makes it difficult to measure and improve web experience performance.Legacy platforms and constrained architectures limit personalization, automation, accessibility, and multichannel delivery capabilities.Misalignment between marketing, IT, and data teams slows decision-making and weakens the organization’s ability to evolve its web ecosystem strategically.

Info-Tech’s Practical Framework for Web Experience Management
To address these challenges, Info-Tech recommends a structured five-phase approach that connects organizational strategy, customer experience priorities, and web execution. The Develop Your Web Experience Management Strategy blueprint outlines the following priorities for CIOs and IT leaders:

Phase 1: Define Vision & Success Criteria – Align WEM objectives to organizational strategy, define strategic outcomes, and establish experience KPIs to measure performance across digital touchpoints.

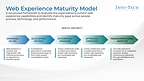
Phase 2: Assess Current State & Readiness – Use a web experience maturity model to evaluate capabilities across people, process, technology, and performance, and identify integration gaps and readiness risks.

Phase 3: Understand Audiences & Experience Priorities – Define priority personas, map end-to-end journeys, and translate organizational goals into structured web experience use cases prioritized by value and feasibility.

Phase 4: Architect & Govern the Ecosystem – Establish architecture principles, design the target-state WEM ecosystem, and define governance structures and operating models that clarify roles, ownership, and decision rights.

Phase 5: Launch, Communicate, & Measure – Develop a phased roadmap aligned to key value drivers, implement performance measurement frameworks, and enable continuous optimization across the web ecosystem.

Info-Tech’s Develop Your Web Experience Management Strategy blueprint is supported by a Web Experience Management Business Case Template and a Web Experience Initiatives Prioritization and Roadmap Planning Tool. These resources are designed to help CIOs and IT leaders build a clear case for modernization, prioritize initiatives based on value and feasibility, and develop phased roadmaps aligned to organizational objectives. By applying this framework and its supporting tools, organizations can strengthen governance, improve cross-functional alignment, and evolve their web ecosystem in a measurable and scalable way.

For exclusive and timely commentary from Info-Tech’s experts, including Hriday Gulrajani, and access to the complete Develop Your Web Experience Management Strategy blueprint, please contact pr@infotech.com.

About Info-Tech Research Group
Info-Tech Research Group is one of the world’s leading and fastest-growing research and advisory firms, serving over 30,000 IT, HR, and marketing professionals around the globe. As a trusted product and service leader, the company delivers unbiased, highly relevant research and industry-leading advisory support to help leaders make strategic, timely, and well-informed decisions. For nearly 30 years, Info-Tech has partnered closely with teams to provide everything they need, from actionable tools to expert guidance, ensuring they deliver measurable results for their organizations. 

To learn more about Info-Tech’s HR research and advisory services, visit McLean & Company, and for data-driven software buying insights and vendor evaluations, visit the firm’s SoftwareReviews platform. 

Media professionals can register for unrestricted access to research across IT, HR, and software, as well as hundreds of industry analysts through the firm’s Media Insiders program. To gain access, contact pr@infotech.com

For information about Info-Tech Research Group or to access the latest research, visit infotech.com and connect via LinkedIn and X

View original content to download multimedia:https://www.prnewswire.com/news-releases/fragmented-web-strategies-leave-organizations-exposed-as-digital-expectations-rise-warns-info-tech-research-group-302834308.html

SOURCE Info-Tech Research Group

Continue Reading

Technology

In HelloNation, Custom Fabrication Expert Mark Coyle Explains What to Know Before Choosing an Aluminum Fabrication Partner

Published

on

By

The article explains how an integrated fabrication process supports better quality, efficiency, and long-term project success.

ROCHESTER, N.Y., July 24, 2026 /PRNewswire/ — What should someone look for before selecting an aluminum fabrication partner who can guide a project from the first design sketch through final delivery? That question is answered in a HelloNation article featuring insights from Custom Fabrication Expert  Mark Coyle of American Custom Metals, Inc. in Rochester, New York, that explains how the full aluminum production workflow shapes accuracy, consistency, and long-term reliability. The article shows why a clear understanding of each stage in the process helps people make informed decisions before committing to a fabrication partner.

The article begins by explaining that aluminum fabrication involves far more than cutting or welding. It describes how every project moves through a connected chain of design support, extrusion, machining, finishing, and logistics. Each step affects the next, and the article notes that the best results come from choosing an aluminum fabrication partner who keeps these stages aligned. By showing how coordination prevents errors, the article gives readers a practical way to evaluate a potential shop.

Early design support is a major focus of the article. It states that many projects benefit when design engineering is handled in-house because small adjustments to a profile can influence strength, weight, and final performance. The HelloNation article explains that an aluminum fabrication partner with internal design capabilities can review shapes before tooling begins, reducing the risk of delays caused by unrealistic or difficult-to-extrude features. This design stage sets the direction for everything that follows, making it one of the most valuable parts of the process.

The article also examines extrusion, which it calls one of the most specialized stages in aluminum manufacturing. It notes that some shops do not extrude their own material, which forces them to rely on outside mills. That structure can lead to longer schedules and more points of communication. By contrast, an aluminum fabrication partner with direct access to extrusion equipment can control die design, schedule production runs, and manage metal flow more precisely. The article explains that this control reduces variation between batches, which supports stable timelines and more predictable quality.

Machining receives detailed attention as well. The article states that accuracy depends on how well each machine is calibrated for the specific alloy and geometry involved. It describes how a fabricator who machines their own extrusions becomes familiar with how those profiles respond to different tool paths and cutting forces. This familiarity supports tighter tolerances and more dependable results. The article explains that when machining is outsourced, the receiving shop may not know the conditions under which the material was extruded or aged, which can cause small adjustments that affect uniformity across long runs.

Finishing is another important stage explored in the article. It explains how anodizing, powder coating, polishing, or protective layers interact with thickness and alloy. The article notes that when finishing is spread across multiple vendors, the project moves more often, which increases the chance for delays or inconsistency. An aluminum fabrication partner with integrated finishing services can keep color and coating texture more uniform while maintaining a tighter schedule.

Logistics also plays a key role in the article’s guidance. It highlights that aluminum profiles, especially long or delicate ones, require thoughtful packaging, palletizing, and freight planning. A shop with its own logistics team can reduce damage risks and speed up the time between manufacturing and delivery. The article explains that when logistics is outsourced, communication slows down and the chances of errors increase, making it harder to keep a project on schedule.

Tolerance control is another subject the article describes. It explains that aluminum reacts to heat, pressure, and machining forces in predictable ways only when the team understands how the material was formed at every stage. The article notes that when extrusion, aging, machining, and inspection all occur within one operation, teams can maintain a closed loop of information. This reduces the risk of dimensional issues and strengthens consistency from batch to batch.

As the article moves toward its conclusion, it emphasizes that choosing the right aluminum fabrication partner comes down to understanding how many stages the shop directly manages. When a partner controls design, extrusion, machining, finishing, and logistics, communication becomes clearer, and the workflow becomes more predictable. The article explains that this unified structure allows teams to adjust quickly because they understand every step of the operation.

The article ends by stating that dependable performance in aluminum work depends on how well each stage connects to the next. A strong aluminum fabrication partner is defined not by one capability but by how the entire process fits together. This guidance gives readers a practical way to evaluate potential partners and make decisions that support long-term project success.

What to Know Before Choosing an Aluminum Fabrication Partner features insights from Mark Coyle, Custom Fabrication Expert of Rochester, NY, in HelloNation.

About HelloNation
HelloNation is America’s Good News Network, a premier media platform built on the idea that good news travels faster when real people tell real stories. Through its community-focused publications and innovative “edvertising” approach, HelloNation delivers content that informs, inspires, and spotlights the leaders making a meaningful impact in their communities.

View original content to download multimedia:https://www.prnewswire.com/news-releases/in-hellonation-custom-fabrication-expert-mark-coyle-explains-what-to-know-before-choosing-an-aluminum-fabrication-partner-302834344.html

SOURCE HelloNation

Continue Reading

Trending