Connect with us

Technology

MRO for Automation Solutions Market to Grow by USD 53.3 Billion (2024-2028) as Outsourcing Operations Boosts Trends Impacted by AI, Reports Technavio

Published

on

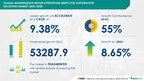
NEW YORK, Oct. 21, 2024 /PRNewswire/ — Report on how AI is redefining market landscape- The global maintenance repair operations (MRO) for automation solutions market size is estimated to grow by USD 53.3 billion from 2024-2028, according to Technavio. The market is estimated to grow at a CAGR of over 9.38%  during the forecast period. Growth in outsourcing of operations is driving market growth, with a trend towards use of analytics for predictive maintenance. However, US-China trade war  poses a challenge. Key market players include ABB Ltd., AMETEK Inc., Danaher Corp., Emerson Electric Co., Endress Hauser Group Services AG, FANUC Corp., Festo SE and Co. KG, General Electric Co., Hitachi Ltd., Honeywell International Inc., IMI Plc, Mitsubishi Electric Corp., MKS Instruments Inc., OMRON Corp., Rockwell Automation Inc., Schneider Electric SE, SICK AG, Siemens AG, W.W. Grainger Inc., and Yokogawa Electric Corp..

Key insights into market evolution with AI-powered analysis. Explore trends, segmentation, and growth drivers- View the snapshot of this report

Maintenance Repair Operations (MRO) For Automation Solutions Market Scope

Report Coverage

Details

Base year

2023

Historic period

2018 – 2022

Forecast period

2024-2028

Growth momentum & CAGR

Accelerate at a CAGR of 9.38%

Market growth 2024-2028

USD 53287.9 million

Market structure

Fragmented

YoY growth 2022-2023 (%)

8.65

Regional analysis

APAC, Europe, North America, South America, and Middle East and Africa

Performing market contribution

APAC at 55%

Key countries

China, US, Japan, Germany, and UK

Key companies profiled

ABB Ltd., AMETEK Inc., Danaher Corp., Emerson Electric Co., Endress Hauser Group Services AG, FANUC Corp., Festo SE and Co. KG, General Electric Co., Hitachi Ltd., Honeywell International Inc., IMI Plc, Mitsubishi Electric Corp., MKS Instruments Inc., OMRON Corp., Rockwell Automation Inc., Schneider Electric SE, SICK AG, Siemens AG, W.W. Grainger Inc., and Yokogawa Electric Corp.

Market Driver

Service providers in the Maintenance Repair Operations (MRO) market for automation solutions are utilizing analytics and statistical models in their maintenance tools to enhance the decision-making process and pinpoint errors early on. Siemens, in collaboration with SAP, is constructing a new open cloud platform for industrial end-users. This platform, which leverages SAP’s HANA Cloud Platform for data analysis on an open platform, has gained popularity among end-users. HANA’s technology enables machines and systems to record and analyze vast amounts of data, employing simulation or intelligent pattern recognition for the early identification of potential errors before system or product failure. This predictive maintenance tool offers significant advantages to end-users, including the detection of process deviations, operation optimization, predictive modeling, production forecasting, and cost-benefit analysis. With the development of more such solutions anticipated during the forecast period, this market segment presents substantial growth opportunities for vendors. 

The Maintenance, Repair, and Operations (MRO) market for automation solutions is experiencing significant trends in various industries. In process and discrete industries, vaccination drives and sustainability are driving the demand for green MRO practices. The power industry, including energy and power, water and wastewater, oil and gas, and the manufacturing sectors, prioritize minimizing downtime through smart technologies like IoT, big data, and sensors. MRO product suppliers, such as Airgas, E-commerce platforms like GoExpedi, and distributors like Air Works, Wesco, Sonepar, and Rexel, are adapting to these trends. New technologies like 3D printing, smart sensors, and safety standards are essential for a skilled workforce. However, raw material shortages, shipping delays, and economic slowdown pose challenges. Outsourcing strategies and inventory management are crucial for MRO product availability. Pumps, industrial motors, sealants, tapes, lubricants, lab supplies, test equipment, blowers, and Industry 4.0 digitization are key MRO product categories. 

Request Sample of our comprehensive report now to stay ahead in the AI-driven market evolution!

 Market Challenges

The global automation solutions market for Maintenance, Repair, and Operations (MRO) in the semiconductor and electronics industry is facing challenges due to the US-China trade war. US and Chinese economies, being major players, have resulted in disruptions affecting numerous countries. Tariffs on goods and services, including electronics components, have increased their prices, causing significant cost hikes for businesses. For instance, AudioControl, a US-based company, sources 70% of its components domestically and has incurred over USD200,000 in additional costs due to tariffs. This price increase not only affects the automation solutions but also their MRO, negatively impacting market growth during the forecast period.In the Maintenance, Repair, and Operations (MRO) market for automation solutions, businesses face several challenges. Big data requires advanced analysis tools to optimize inventory and maintenance schedules. New technologies like 3D printing offer opportunities but also bring challenges in terms of raw material shortages and shipping delays. Skilled workforce shortages add to the complexity. Economic slowdowns impact operating expenses. Suppliers like Air Works, Wesco, Sonepar, Rexel, Applied Industrial Technologies, and GoExpedi provide MRO products, but the adoption of smart technologies and Industry 4.0 demands continuous innovation. MRO product categories include pumps, industrial motors, sealants, tapes, lubricants, lab supplies, test equipment, sensors, and safety standards. New technologies like energy-efficient water pumps, industrial robots, blowers, fans, and medical equipment offer energy savings and reduced carbon footprint. However, the availability of semiconductor chips and other raw materials can impact production. Outsourcing strategies can help manage costs, but ensuring compliance with safety standards is crucial. Urbanization and the growth of data centers, sustainable buildings, and green facilities create new opportunities for MRO solutions. Overall, the MRO market for automation solutions requires a proactive approach to address these challenges and stay competitive.

Discover how AI is revolutionizing market trends- Get your access now!

Segment Overview 

This maintenance repair operations (mro) for automation solutions market report extensively covers market segmentation by  

End-user 1.1 Process industries1.2 Discrete industriesType 2.1 MRO items2.2 ServicesGeography 3.1 APAC3.2 Europe3.3 North America3.4 South America3.5 Middle East and Africa

1.1 Process industries-  The process industries, including energy and power, water and wastewater, and oil and gas, are experiencing significant growth during the forecast period. In the power industry, the increasing global demand for electricity, urbanization, and the use of electronic appliances have led to a heightened need for electricity. Renewable energy sources, such as solar and biomass, are gaining popularity due to depleting coal reserves and the need to reduce carbon emissions. This shift towards green energy production is attracting substantial investments, leading to the restructuring of power plants and the establishment of new ones. The water and wastewater industry is also witnessing growth due to the growing demand for freshwater resources and rising concerns over water reuse and recycling. Technologies like desalination and nanotechnology are being utilized to treat wastewater. Increased investments in water and wastewater treatment facilities and the demand for high-quality water from industries such as pharmaceuticals and semiconductors are fostering the demand for automation solutions. The oil and gas industry is also contributing to the demand for automation solutions due to ongoing exploration of new fields and refinery units, as well as expansions of onshore and offshore production activities.

Download a Sample of our comprehensive report today to discover how AI-driven innovations are reshaping competitive dynamics

Research Analysis

The Maintenance Repair Operations (MRO) market for automation solutions is witnessing significant growth, particularly in process industries and discrete industries, as they prioritize automation to enhance productivity and efficiency. The market is fragmented with numerous players, but the focus is shifting towards new technologies such as Internet of Things (IoT) and sensors to optimize maintenance and inventory management. The power industry and energy and power sectors are major consumers of MRO products due to the critical nature of their operations. Green energy production is also driving demand for automation solutions to ensure optimal performance and reduce downtime. However, challenges such as raw material shortages, shipping delays, and economic slowdown are impacting the market. Skilled workforce shortages are also a concern, leading to outsourcing strategies becoming increasingly popular. MRO solutions are essential for maintaining critical equipment such as pumps and ensuring safety standards are met. New technologies are continuously being introduced to improve efficiency and reduce costs, making the market an exciting space to watch.

Market Research Overview

The Maintenance, Repair, and Operations (MRO) market for automation solutions is witnessing significant growth in various industries, including process and discrete industries, as automation becomes increasingly essential for sustainability and efficiency. The market is fragmented, with numerous players offering MRO products and services for sectors such as power, energy and power, water and wastewater, oil and gas, and manufacturing industries. Vaccination drives and the economic slowdown have impacted supply chains, leading to raw material shortages and shipping delays. However, the adoption of new technologies like e-commerce, IoT, big data, 3D printing, and smart technologies is streamlining MRO operations. Green energy production is a growing focus, with the need for energy-efficient technology and a reduced carbon footprint driving demand for MRO products and services. Sustainability initiatives, such as green MRO practices, are also gaining traction. MRO products include a wide range of items, from pumps and industrial motors to sealants, tapes, lubricants, lab supplies, test equipment, sensors, and safety standards. The market is also seeing the integration of Industry 4.0 and digitization, with the use of sensors, automation, and industrial robots becoming more prevalent. Outsourcing strategies are becoming increasingly common, with companies seeking to reduce downtime and operating expenses. The automotive spare parts, semiconductor chips, data centers, urbanization, sustainable buildings, and green facilities sectors are also significant consumers of MRO solutions. Key challenges include the skilled workforce shortage and the need to adapt to new technologies. Companies like Airgas, Air Works, Wesco, Sonepar, Rexel, Applied Industrial Technologies, GoExpedi, and others are leading the way in providing innovative MRO solutions to meet the evolving needs of industries.

Table of Contents:

1 Executive Summary
2 Market Landscape
3 Market Sizing
4 Historic Market Size
5 Five Forces Analysis
6 Market Segmentation

End-userProcess IndustriesDiscrete IndustriesTypeMRO ItemsServicesGeographyAPACEuropeNorth AmericaSouth AmericaMiddle East And Africa

7 Customer Landscape
8 Geographic Landscape
9 Drivers, Challenges, and Trends
10 Company Landscape
11 Company Analysis
12 Appendix

About Technavio

Technavio is a leading global technology research and advisory company. Their research and analysis focuses on emerging market trends and provides actionable insights to help businesses identify market opportunities and develop effective strategies to optimize their market positions.

With over 500 specialized analysts, Technavio’s report library consists of more than 17,000 reports and counting, covering 800 technologies, spanning across 50 countries. Their client base consists of enterprises of all sizes, including more than 100 Fortune 500 companies. This growing client base relies on Technavio’s comprehensive coverage, extensive research, and actionable market insights to identify opportunities in existing and potential markets and assess their competitive positions within changing market scenarios.

Contacts

Technavio Research
Jesse Maida
Media & Marketing Executive
US: +1 844 364 1100
UK: +44 203 893 3200
Email: media@technavio.com
Website: www.technavio.com/

View original content to download multimedia:https://www.prnewswire.com/news-releases/mro-for-automation-solutions-market-to-grow-by-usd-53-3-billion-2024-2028-as-outsourcing-operations-boosts-trends-impacted-by-ai-reports-technavio-302281376.html

SOURCE Technavio

Continue Reading

Technology

Epsilon3 Launches Preventative Maintenance to Keep Complex Hardware Mission-Ready

Published

on

By

New capability turns the hours, cycles and readings that procedures already record into maintenance actions, and stops due or out-of-limit equipment before it is used

EL SEGUNDO, Calif., Nov. 19, 2026 /PRNewswire/ — Epsilon3, the operations platform that teams use to build, test and operate complex hardware, today announced Preventative Maintenance, a new capability that maintains aircraft, engines, launch vehicles, ships, ground vehicles and spacecraft hardware based on the use and condition each asset actually sees. Available today to every Epsilon3 customer, Preventative Maintenance carries the digital thread teams already run in Build and Test into Sustain, so the same platform that proves how hardware was made now proves how it is kept in service.

Today, fleets across aviation, space and defense are older, worked harder and kept longer. The average airline aircraft was just under 13 years old in 2025 and flying more hours than the year before, according to Oliver Wyman. The U.S. Government Accountability Office estimates that operating and support costs account for about 70% of a weapon system’s life-cycle cost. Much of that maintenance still runs on fixed calendar intervals, in systems separate from the work itself. An engine that flew 200 cycles this month and one that flew two can receive the same service date: one is pulled for work it did not need, while the other wears past its limit.

“Every cycle counts, and that’s why we help our customers track procedures to capture how every flight, test and shift uses their hardware,” said Laura Crabtree, CEO and co-founder of Epsilon3. “Now Preventative Maintenance puts that record to work, so teams maintain each asset on what it actually went through, stop equipment that isn’t ready before anyone uses it, and finish every job with a signed record that proves it was done right.”

How it works:

Usage comes from the work. A new Record Usage step inside procedures captures cycles, hours, readings and conditions as the work happens. Teams define usage types once, whether a running total such as flight cycles, a measurement such as pressure, or a condition such as oil color, and apply them to parts, tools and locations.Maintenance triggers on real use. Maintenance routines can come due on a calendar schedule, a usage threshold or a number of tool check-outs. Triggers are ranked, so completing an annual overhaul also resets the monthly check. One routine can cover every item of a part or every instance of a tool across the fleet.Limits are enforced at the point of use. Teams set each limit to allow use, warn and confirm, or block use when equipment is checked out, kitted or installed. A routine can also hold equipment out of service while its maintenance is due.Every maintenance action is a signed procedure. Maintenance runs step by step as written, and finishing the run records it automatically. Deferrals and cancellations include a reason, and a single status view shows what is Due Soon, Due or Overdue across the fleet.

The result is assets that last longer and cost less to maintain, safer work, and more of the fleet ready to fly, launch or deploy.

Availability
Preventative Maintenance is available now to all Epsilon3 customers at no additional setup. Existing maintenance schedules, maintenance history and usage history migrate automatically, so no team has to rebuild anything, and the capability works alongside the condition monitoring tools customers already run. To learn more, visit https://tours.epsilon3.io/pages/maintenance.

About Epsilon3
Epsilon3 is the purpose-built operations platform for aerospace, defense, and advanced manufacturing, built for environments where errors, delays, or data loss are not an option. Founded by engineers from SpaceX, NASA, Northrop Grumman, and Google, Epsilon3 unifies procedure authoring, controlled execution, inspection workflows, nonconformance management, calibration coordination, traceability, and operational intelligence into a single platform. The result is a system of record that helps teams manage quality, compliance, and mission-critical work with full visibility from release through execution and closeout. Learn more at epsilon3.io.

View original content to download multimedia:https://www.prnewswire.com/news-releases/epsilon3-launches-preventative-maintenance-to-keep-complex-hardware-mission-ready-302945740.html

SOURCE Epsilon3

Continue Reading

Technology

HOME PURCHASE LOANS FALL TO LOWEST THIRD-QUARTER LEVEL SINCE 2012

Published

on

By

Home purchase lending falls 9 percent quarter-over-quarter to 729,968 loans;
Refinance lending drops 16 percent quarter-over-quarter to 561,290 loans

IRVINE, Calif., Nov. 19, 2026 /PRNewswire/ — ATTOM, the leading provider of property data, AI-powered intelligence, and real estate analytics solutions, today released its U.S. Residential Property Mortgage Origination Report for the third quarter of 2026, showing purchase and refinance lending slowed from the previous quarter as mortgage rates climbed and home purchase loans fell to their lowest third-quarter level since 2012.

A total of 1.29 million purchase and refinance mortgages secured by residential property (1 to 4 units) were originated in the third quarter, down 12 percent from the previous quarter and 15 percent from a year earlier. Total loan volume reached $498.1 billion, down 15 percent quarterly and 12 percent year-over-year.

The quarterly slowdown was driven by declines in both home purchase and refinance lending. Purchase loans fell 9 percent from the previous quarter to 729,968, marking the lowest third-quarter total since 2012. Purchase loans were down 12 percent from a year earlier, even as the average purchase loan amount rose 3 percent over the same period to $411,756.

“The increase in refinance activity we saw late last year and into early this year cooled in the third quarter, with refinancing declining more than purchase lending,” said Rob Barber, CEO of ATTOM. “Purchase loans also slipped to their lowest third-quarter level since 2012, as higher mortgage rates and elevated average purchase loan amounts continued to strain affordability for many buyers.”

Purchase lending slips quarterly in most markets
Purchase lending totaled $300.6 billion in the third quarter, down 10 percent from the previous quarter and 10 percent below year-ago levels. Purchase loans accounted for 56.5 percent of all purchase and refinance originations, up from 54.5 percent in both the second quarter of 2026 and the third quarter of 2025.

Purchase activity declined quarterly in 73.6 percent of analyzed metro areas with a population of 200,000 or more and sufficient data. Among metros with populations above 1 million, the largest quarterly increases were in Buffalo, NY (up 61 percent); Memphis, TN (up 50 percent); Rochester, NY (up 32 percent); New York, NY (up 22 percent); and Hartford, CT (up 20 percent). The steepest quarterly drops among large metros were in Salt Lake City, UT; New Orleans, LA; Denver, CO; Atlanta, GA; and Richmond, VA.

Refinancing activity falls sharply quarter-over-quarter
Refinancing activity fell 16 percent quarter-over-quarter to 561,290 loans, the lowest quarterly total since the second quarter of 2024, and was 19 percent below the third quarter of 2025. Refinance originations accounted for 43.5 percent of all purchase and refinance loans, down from 45.5 percent in both the previous quarter and a year earlier. Refinance lending declined quarterly in 89.4 percent of analyzed metro areas, with the steepest quarterly drops among large metros in San Jose, CA; Dallas, TX; San Francisco, CA; Austin, TX; and Louisville, KY.

FHA and VA loan shares decline quarterly
Loans backed by the Federal Housing Administration accounted for 15.7 percent of all purchase and refinance originations in the third quarter, down from 16.1 percent in the second quarter and 17.9 percent a year earlier. VA-backed loans represented 6.9 percent of originations, down from 8.2 percent in the second quarter and 7.2 percent a year earlier, the lowest share since the second quarter of 2024.

Mortgage rates climb above 7 percent by early October
Mortgage rates trended higher during the quarter. According to Freddie Mac, the average rate on a 30-year fixed mortgage rose from 6.43 percent in early July to 7.28 percent by early October, adding pressure to an already constrained housing market.

Loan Origination Report key takeaways
According to the Q3 2026 Loan Origination Report, purchase and refinance lending slowed in the third quarter of 2026, with originations falling 12 percent from the previous quarter to 1.29 million loans as mortgage rates climbed above 7 percent. Home purchase lending dropped 9 percent quarter-over-quarter to 729,968 loans, the lowest third-quarter level since 2012, while refinance lending fell 16 percent quarter-over-quarter to 561,290 loans.

Report methodology
ATTOM analyzed recorded mortgage and deed of trust data for single-family homes, condos, town homes and multi-family properties of two to four units for this report. This report covers purchase and refinance loan originations. Each recorded mortgage or deed of trust was counted as a separate loan origination. Dollar volume was calculated by multiplying the total number of loan originations by the average loan amount for those loan originations.

About ATTOM
ATTOM delivers AI-driven property intelligence built on the nation’s most trusted property data repository, covering 160+ million U.S. properties—99% of the population. Our engineered, multi-sourced, semantically rich real estate data spans property tax, deeds, mortgages, foreclosure, environmental risk, property conditions, natural hazards, neighborhood insights, and geospatial boundaries, rigorously validated for advanced analytics. ATTOM supports analytics, AI applications, and AI agents through flexible delivery options including APIs, bulk licensing, cloud delivery, and the MCP Server for AI-powered, agentic access to engineered property data, enabling organizations to automate analysis, power intelligent workflows, and scale property intelligence across industries.

Media Contact:
Megan Hunt
megan.hunt@attomdata.com 

Data and Report Licensing:
949.502.8313
datareports@attomdata.com

View original content to download multimedia:https://www.prnewswire.com/news-releases/home-purchase-loans-fall-to-lowest-third-quarter-level-since-2012-302944983.html

SOURCE ATTOM

Continue Reading

Technology

Explorance Global Response Rates Report Finds Top Survey Programs Use a Common Foundation, Deploy Targeted Features and Strategies

Published

on

By

Inaugural 2026 Global Response Rates Tournament draws 85 submissions and more than 762,000 respondents, with leaders reaching up to 100%

MONTREAL, Nov. 19, 2026 /PRNewswire/ — Explorance, a global leader in feedback analytics, today released the Global Response Rates Tournament: 2026 Report. It draws on 85 survey submissions from Explorance customers across higher education and corporate learning, which collectively reached over 760,000 respondents with an average response rate of 74.5%.

The report’s central finding is that high survey response rates don’t come from a single tactic. Regardless of industry, the strongest programs start with a foundation that makes surveys easy to reach, then layer on targeted features and strategies suited to their audience.

Why response rates matter

For higher education leaders, response rates determine how much weight a decision can bear. Course evaluations and student surveys inform decisions at every level: Instructors act on feedback about their teaching, program leaders on patterns across courses, deans on patterns across programs and faculty, and provosts on institution-wide trends. When participation is low, each of those decisions rests on feedback that may not reflect the students it’s meant to represent.

The stakes extend beyond individual courses. Higher participation gives institutional research teams, teaching and learning leaders, and administrators a clearer view of where the student experience needs attention. The report also ties stronger response rates to an institution’s reputation, brand, and global ranking, where increased participation can lead to sustained momentum in other areas. When students see their feedback lead to visible change, they are more likely to respond again.

Every student voice matters, but institutions need to hear from enough students to understand the bigger picture. Strong participation gives instructors greater confidence to improve their courses, helps program leaders identify patterns across the learning experience, and enables institutional leaders to make better-informed decisions. Response rates aren’t simply a measure of survey engagement. They reflect how effectively institutions are listening to their communities and creating opportunities to turn feedback into meaningful action.”

– Zelbrey Bédard, Chief Product Officer, Explorance

Many of the same takeaways apply to corporate learning organizations, where training teams rely on survey results to improve programs and need to trust the data behind those decisions.

That is why leading institutions treat response-rate optimization as part of the measurement process rather than a separate administrative task. The report’s guidance is to treat it as a decision-quality issue, not only a participation issue.

The leaderboard

The five highest individual response rates came from:

1

Johnson Controls (Johnson Controls Training Institute): 100%

2

University of Sharjah: 97%

3

Singapore University of Social Sciences (SUSS): 92%

4

Singapore Institute of Management: 81%

T5

Batterjee Medical College: 78%

T5

University of Nevada, Las Vegas (UNLV): 78%

A shared foundation, then deliberate layering

Nearly every submission relied on the same access basics: strategic email delivery (100%), QR code access (89%), and timed reminders (74%). The leaders went further, adding more selective capabilities that matched their audience, including:

Grade or course blocking was used in only 7% of submissions overall, yet it appears among five of the six leaderboard organizations. At the University of Sharjah, a targeted course-level restriction helped lift response rates from below 30% to above 95%.Response rate monitoring (16% of submissions) gave instructors and administrators live visibility into participation gaps. Johnson Controls, Sharjah, and SUSS all used it.LMS integration (25% of submissions) met students where they already work. UNLV’s response rate rose from about 32% to over 45% after its Canvas integration, before climbing to 77.77% once content blocking was added.

These features were paired with strategies that gave people a reason to respond. Leaders communicated the survey’s purpose, and instructors gave learners time in class to complete it. Instructors at Johnson Controls introduce the survey at the start of class and use it as an “exit ticket.” Batterjee Medical College closed the feedback loop by showing students what changed. Every submission that cited that strategy reached at least a 46% response rate.

More features did not automatically mean better results. Sharjah reached 97% with six features, while other participants used more without matching it. The report concludes that the right mix depends on audience size, structure, and timing.

Availability

The full report, including six customer stories and a survey response rate best practices checklist, is available at: https://www.explorance.com/lp/response-rates-tournament/. 

The tournament returns in 2027 with additional categories, including rankings by country and institution type. Pre-registration is open on the Global Response Rates Hub.

About Explorance

Explorance is a global feedback analytics company that helps organizations listen deeply, act confidently, and grow meaningfully. Founded in 2003 and headquartered in Montreal, Explorance supports over 1,000 organizations across 50+ countries, including 30% of the world’s top-ranked universities and 25% of the Fortune 500. Through purpose-built platforms—Blue, MLY, MTM, and BlueX—and expert services in change management and analytics consulting, Explorance enables institutions to drive teaching effectiveness, employee engagement, and learning impact. With more than 25 million users and over 2 billion feedback data points, Explorance powers cultures of accountability built on trust. 

For more information, visit www.explorance.com. 


View original content to download multimedia:https://www.prnewswire.com/news-releases/explorance-global-response-rates-report-finds-top-survey-programs-use-a-common-foundation-deploy-targeted-features-and-strategies-302945209.html

SOURCE Explorance Inc.

Continue Reading

Trending