
Technology
The Inner Circle acknowledges, Ravindra Perera as a Pinnacle Professional Member Inner Circle of Excellence

Published
2 years agoon
By

EDISON, N.J., Dec. 16, 2024 /PRNewswire/ — Prominently featured in The Inner Circle, Ravindra Perera is acknowledged as a Pinnacle Professional Member Inner Circle of Excellence for his contributions to Pioneering Digital Transformation and Business Architecture with 20 Years of Expertise.
Ravindra Perera, a seasoned leader in business development and digital transformation, has spent over two decades shaping strategy and driving innovation in the information technology consulting industry. With a robust portfolio of expertise—including TOGAF® Enterprise Architecture, Pega Business Architecture, and Six Sigma Green Belt certifications—Mr. Perera is renowned for delivering cutting-edge solutions that enhance business and technology capabilities.
Currently serving as a Principal Business Architect, Mr. Perera plays a pivotal role in delivering transformational initiatives and spearheading projects that leverage emerging technologies. His work includes expertise in natural language understanding, omni-channel customer service with Pega, AWS Connect, Google Vision API, Voice AI, DocuSign, and Robotic Process Automation (RPA/RDA). His passion for digital transformation is rooted in enabling organizations to evolve from functional system discussions to broader organizational capabilities that bridge business and technology.
Mr. Perera holds an MBA from Sri Lanka University and has enriched his professional skillset with certifications in TOGAF®, SAFE Agility, Design Thinking, and more. His philosophy, inspired by his father’s relentless pursuit of excellence, emphasizes continuous learning and professional growth. He has presented at Regional Scrum Gatherings in Sri Lanka and Pakistan, created course materials for the Open University of Sri Lanka, and trained students for prestigious competitions like the Microsoft Imagine Cup.
Beyond his professional achievements, Mr. Perera is a dedicated Toastmaster and the creator of CXO School (cxoschools.com), where he trains corporate leaders and communicators. He aspires to further his impact by becoming a Chief Digital Officer, leveraging his expertise to guide organizations through comprehensive digital transformations. To achieve this, he plans to participate in MIT’s Chief Digital Officer program, aligning his skills with the evolving demands of the digital economy.
Ravindra Perera’s leadership and vision have left an indelible mark on organizations ranging from Mercer and WellPoint to his current role as Principal Business Architect. His commitment to innovation, combined with his extensive background in CRM, customer service, and call center applications, positions him as a leading figure in the business architecture and technology consulting landscape.
Contact: Katherine Green, 516-825-5634, editorialteam@continentalwhoswho.com
View original content to download multimedia:https://www.prnewswire.com/news-releases/the-inner-circle-acknowledges-ravindra-perera-as-a-pinnacle-professional-member-inner-circle-of-excellence-302333072.html
SOURCE The Inner Circle

You may like
Technology
eBay Inc. Reports Third Quarter 2026 Results
Published
8 minutes agoon
October 28, 2026By

Revenue of $3.2 billion, up 14% on an as-reported basis and up 13% on an FX-Neutral basis Gross Merchandise Volume of $23.2 billion, up 15% on an as-reported basis and up 16% on an FX-Neutral basisGAAP and Non-GAAP earnings per diluted share of $1.11 and $1.51, respectively, on a continuing operations basisGAAP and Non-GAAP operating margins of 19.2% and 26.3%, respectivelyReturned $827 million to stockholders in Q3, including $689 million of share repurchases and $138 million paid in cash dividends
SAN JOSE, Calif., Oct. 28, 2026 /PRNewswire/ — eBay Inc. (Nasdaq: EBAY), a global commerce leader that connects millions of buyers and sellers around the world, today reported financial results for its third quarter ended September 30, 2026.
“eBay’s strong third quarter results reflect continued momentum across our business priorities and customer segments as more consumers embrace recommerce,” said Jamie Iannone, Chief Executive Officer at eBay. “Our Focus Categories, C2C marketplace, and Recommerce leadership are driving strong, sustained growth, while innovations across eBay Live, Shipping, and our portfolio are making the platform more trusted, seamless, and compelling for buyers and sellers around the world.”
“Our third quarter results demonstrate that eBay’s strategy is delivering strong GMV growth and meaningful earnings expansion,” said Peggy Alford, Chief Financial Officer at eBay. “By investing with discipline in our highest strategic priorities and focusing on the areas where we have a clear competitive advantage, we are positioning eBay for durable, profitable growth and long-term shareholder value.”
Third Quarter 2026 Business Highlights
eBay continued to enhance its C2C selling experience with comprehensive improvements in France and Italy, bringing together free selling, buyer protection, enhanced local discovery, eBay Balance and simplified shipping.The company expanded the latest generation of its AI-powered Magical Listing technology to all new and reactivated listers in the U.S., U.K., Germany, Australia, France and Italy.eBay Live delivered another record quarter and is generating Gross Merchandise Volume (“GMV”) at a multibillion-dollar annualized run rate. GMV growth remained well into the triple digits year over year, similar to recent quarters, as sellers, buyers, content hours and viewership continued to expand across all seven markets.eBay continued to enhance its Live shopping experience by introducing multistreaming capabilities that allow sellers to broadcast simultaneously across eBay Live and social platforms, and strengthened trust by introducing new features for sellers, including AI-powered moderation of chat, audio and video and enhanced content screening.Depop further strengthened its buying and selling experience by enabling faster personal discovery on the homepage, simplifying its AI-assisted listing flow and offering more affordable shipping options in the U.S.eBay created standout moments at New York and London Fashion Weeks with Endless Runway activations, showcasing rare archival and pre-loved fashion, celebrating iconic designers and leveraging eBay Live to bring the collection to buyers worldwide. In Motors Parts & Accessories, eBay expanded Easy and Free Returns to Germany following successful U.S. and U.K. launches and introduced Certified Recycled badging in the U.S., helping buyers shop for compatible, quality parts with greater confidence.eBay’s Vehicle Purchase Protection now covers eligible transactions up to $500,000. The company also facilitated several vehicle transactions exceeding $1 million, including the sale of a 2005 Porsche Carrera GT for $5 million.eBay expanded Authenticity Guarantee to eligible collectible coins in the U.S. through a partnership with Professional Coin Grading Service, a leading authority in coin grading and authentication. The company also extended trading card authentication services to a broader range of collectors by lowering the mandatory price thresholds in the U.S. and U.K. eBay expanded its Authenticity Guarantee service for luxury fashion across Europe, enabling buyers in 23 European Union countries to shop for authenticated Luxury Fashion from sellers in Germany, France and Italy. In Australia, eBay introduced authentication for watches, further strengthening trust and confidence in its global luxury resale marketplace.TCGplayer surpassed $1 billion in GMV over the trailing 12 months and began onboarding international sellers in the U.K. and Canada.Goldin achieved another quarter of record GMV and hosted an auction commemorating the 250th anniversary of the United States, highlighted by the $3.65 million sale of a rare 1776 Exeter Broadside copy of the Declaration of Independence.eBay expanded Managed Shipping to all new and reactivated listers in the U.S. for domestic transactions and launched eBay International Shipping in the U.K. and Germany, which will enable sellers to reach buyers in more than 190 markets by shipping to a domestic eBay hub.
Impact
In October, eBay released its sixth annual Recommerce Report, which found that 47% of consumers surveyed purchase secondhand goods at least monthly, up from 35% in 2025, underscoring the growing adoption of recommerce worldwide.eBay for Charity enabled buyers and sellers on the platform to raise $59 million worldwide in the third quarter.eBay Foundation’s Global Give Program granted nearly $3 million to over 30 nonprofits around the world that are supporting entrepreneurs in geographies where eBayers live and work.eBay was recognized with numerous awards, including Forbes’ World’s Best Employers 2026, TIME’s World’s Best Companies 2026, Newsweek’s America’s Best Online Platforms 2026 and Business Insider’s America’s Most Innovative Businesses 2027.
Third Quarter 2026 Financial Highlights
Revenue was $3.2 billion, up 14% on an as-reported basis and up 13% on a foreign exchange (“FX”) neutral basis.GMV was $23.2 billion, up 15% on an as-reported basis and up 16% on an FX-Neutral basis.GAAP net income from continuing operations was $501 million, or $1.11 per diluted share.Non-GAAP net income from continuing operations was $685 million, or $1.51 per diluted share.GAAP and Non-GAAP operating margins were 19.2% and 26.3%, respectively.Generated $875 million of operating cash flow and $749 million of free cash flow from continuing operations.Returned $827 million to stockholders, including $689 million of share repurchases and $138 million paid in cash dividends.
(In millions, except per share data and percentages)
Third Quarter
2026
2025
Change
eBay Inc.
Net revenues
$ 3,206
$ 2,820
$ 386
14 %
GAAP – Continuing Operations
Net income
$ 501
$ 593
$ (92)
(16) %
Earnings per diluted share
$ 1.11
$ 1.27
$ (0.16)
(13) %
Non-GAAP – Continuing Operations
Net income
$ 685
$ 633
$ 52
8 %
Earnings per diluted share
$ 1.51
$ 1.35
$ 0.16
12 %
Other Selected Financial and Operational Results
Advertising revenue – The company’s total advertising offerings generated $607 million of revenue in the third quarter of 2026. First-party advertising products on the eBay platform delivered $575 million of revenue in the third quarter of 2026, up 16% on an as-reported basis and up 16% on an FX-Neutral basis.Operating margin – GAAP operating margin decreased to 19.2% for the third quarter of 2026, compared to 20.3% for the same period last year. Non-GAAP operating margin decreased to 26.3% for the third quarter of 2026, compared to 27.0% for the same period last year.Income tax rate – The GAAP effective tax rate for continuing operations for the third quarter of 2026 was 17.1%, compared to (4.3)% for the third quarter of 2025. The non-GAAP effective tax rate for continuing operations for the third quarter of 2026 was 17.5%(1).Cash flow – The company generated $875 million of operating cash flow and $749 million of free cash flow during the third quarter of 2026 from continuing operations.Capital returns – The company repurchased $689 million of its common stock, or approximately 6 million shares, in the third quarter of 2026. The company’s total repurchase authorization remaining as of September 30, 2026 was approximately $1.3 billion. The company also paid cash dividends of $138 million during the third quarter of 2026.Cash and cash equivalents and non-equity investments – The company’s cash and cash equivalents and non-equity investments portfolio totaled $3.3 billion as of September 30, 2026.
(1) We are using a non-GAAP effective tax rate of 17.5% in 2026 for evaluating our operating results, up from 16.5% in 2025. This rate could continue to change for various reasons including significant changes in our geographic earnings mix or fundamental tax law changes in major jurisdictions in which we operate.
Business Outlook
eBay is providing the following guidance for continuing operations for the fourth quarter and full year 2026. This outlook includes the expected impact from Depop.
(In billions, except per share data and percentages)
Q4 2026 Guidance
Full Year 2026 Guidance
Revenue
$3.19 – $3.24
$12.62 – $12.67
FX-Neutral Y/Y Growth
7% – 9%
12% – 13%
Gross Merchandise Volume
$23.7 – $24.1
$91.5 – $91.9
FX-Neutral Y/Y Growth
12% – 14%
14% – 14%
Diluted GAAP EPS
$0.82 – $0.87
$4.26 – $4.31
Diluted Non-GAAP EPS
$1.48 – $1.53
$6.25 – $6.30
Dividend Declaration
eBay’s Audit Committee declared a fourth quarter 2026 cash dividend of $0.31 per share of the company’s common stock. The dividend is payable on December 18, 2026 to stockholders of record as of December 4, 2026.
Acquisition of Depop
On July 30, 2026, we completed the acquisition of Depop, a leading C2C fashion marketplace, from Etsy, Inc. We paid $1.4 billion in cash, inclusive of a preliminary purchase price adjustment, which is subject to finalization. We believe the acquisition strengthens our leadership in circular fashion and recommerce.
Quarterly Conference Call and Webcast
eBay Inc. will host a conference call to discuss third quarter 2026 results at 2:30 p.m. Pacific Time today. A live webcast of the conference call, together with a slide presentation that includes supplemental financial information and reconciliations of certain non-GAAP measures to their nearest comparable GAAP measures, can be accessed through the company’s Investor Relations website at https://investors.ebayinc.com. In addition, an archive of the webcast will be accessible for at least three months through the same link.
eBay Inc. uses its Investor Relations website at https://investors.ebayinc.com and social media channels as a means of disclosing material non-public information and for complying with its disclosure obligations under Regulation FD. Accordingly, investors should monitor this website, in addition to following our press releases, Securities and Exchange Commission (“SEC”) filings, public conference calls and webcasts.
About eBay
eBay Inc. (Nasdaq: EBAY) is a global commerce leader that connects people and builds communities to create economic opportunity for all. Our technology empowers millions of buyers and sellers in more than 190 markets around the world, providing everyone the opportunity to grow and thrive. Founded in 1995 in San Jose, California, eBay is one of the world’s largest and most vibrant marketplaces for discovering great value and unique selection. In 2025, eBay enabled nearly $80 billion of gross merchandise volume. For more information about the company and its global portfolio of online brands, visit www.ebayinc.com.
Presentation
All growth rates represent year-over-year comparisons, except as otherwise noted. All amounts in tables are presented in U.S. dollars, rounded to the nearest million, except as otherwise noted. As a result, certain amounts may not sum or recalculate using the rounded dollar amounts provided. References to “revenue” refer to “net revenues” as reported in the company’s consolidated statement of income.
New Accounting Standard
In September 2025, the Financial Accounting Standards Board issued Accounting Standards Update (“ASU”) 2025-06, Intangibles—Goodwill and Other—Internal-Use Software (Subtopic 350-40): Accounting for and Disclosure of Software Costs. eBay adopted the standard effective January 1, 2026 using the full retrospective method, which required the restatement of each prior reporting period presented.
Non-GAAP Financial Measures
This press release includes the following financial measures defined as “non-GAAP financial measures” by the SEC: non-GAAP net income, non-GAAP earnings per diluted share, non-GAAP operating income and margin, non-GAAP effective tax rate, free cash flow and FX-Neutral basis. These non-GAAP financial measures are presented on a continuing operations basis. These measures may be different from non-GAAP financial measures used by other companies. The presentation of this financial information, which is not prepared under any comprehensive set of accounting rules or principles, is not intended to be considered in isolation of, or as a substitute for, the financial information prepared and presented in accordance with generally accepted accounting principles (“GAAP”). For a reconciliation of these non-GAAP financial measures, except for figures in this press release presented on an “FX-Neutral basis,” to the nearest comparable GAAP measures, see “Non-GAAP Measures of Financial Performance,” “Reconciliation of GAAP Operating Income to Non-GAAP Operating Income,” “Reconciliation of GAAP Net Income to Non-GAAP Net Income and GAAP Effective Tax Rate to Non-GAAP Effective Tax Rate” and “Reconciliation of Operating Cash Flow to Free Cash Flow” included in this press release. For figures in this press release reported “on an FX-Neutral basis,” we calculate the year-over-year impact of foreign currency movements using prior period foreign currency rates, excluding hedging activity, applied to current year transactional currency amounts.
Forward-Looking Statements
This press release contains forward-looking statements relating to, among other things, the future performance of eBay Inc. and its consolidated subsidiaries that are based on the company’s current expectations, forecasts and assumptions and involves risks and uncertainties. These statements include, but are not limited to, management’s vision for the future of eBay and our ability to accomplish our vision, expected financial results for the fourth quarter and full year 2026 and expected drivers thereof, the future growth in our business, and our ability to drive sustainable long-term growth and create lasting value for our stockholders, the impact of current and contemplated strategic initiatives and offerings, partnerships with and acquisitions of other companies, and new and updated product features or programs, including the initiatives, offerings, partnerships, acquisitions, features and programs discussed in our business highlights, the effects of foreign currency volatility and our ability to respond to such effects, operating efficiency and margins, and dividends and share repurchases.
Actual results could differ materially from those expressed or implied and reported results should not be considered as an indication of future performance. Factors that could cause or contribute to such differences include, but are not limited to: significant variation in our operating and financial results, including GMV and net revenues; our ability to compete in the markets in which we participate; our ability to generate revenue from our advertising products, including our Promoted Listings; our ability to generate consumer engagement and spending; our ability to keep pace with technological changes, including emerging AI technologies, and with changes in consumer demands and expectations; our ability to operate internationally and generate revenue from our international operations and our exposure to costs and risks in connection therewith; the impact of changes in global trade policies on our revenue, profit and ability to support cross-border trade; our ability to manage our buyer and seller trust protection programs; the risk of systems failures and business interruptions to our business; operation of and ongoing investment into our payments and financial services offerings; the risk of fraud on our platforms; the impact of any cyberattacks or data security breaches; our ability to attract, retain and develop our senior managers and other key employees; our and our customers’ dependence on third-party providers, some of which are our competitors; the impact of our current, contemplated and future acquisitions, dispositions, joint ventures, strategic partnerships and strategic investments, including our ability to realize the projected benefits from the recently completed Depop acquisition; the impact of stockholder activism or unsolicited acquisition proposals; the impact of extensive and increasing regulation and oversight that affect our business; the risk of liability for the actions of our customers, including products sold by sellers on our platforms; the impact of increasing levels of regulation in the areas of privacy, protection of user data cybersecurity, and AI; the risks associated with third-party allegations relating to intellectual property rights; current and potential litigation and regulatory and government inquiries, investigations and litigation involving us; the impact of evolving sales and other tax regimes in various jurisdictions; our ability to protect or enforce our intellectual property rights; risks and costs relating to stakeholder expectations around environmental, social and governance matters; potential exposure to claims and liabilities as a result of the distribution of PayPal; the risk of exposure to greater than anticipated tax liabilities; fluctuations in interest rates, and changes in regulatory guidance relating thereto; fluctuations in foreign currency exchange rates; our ability to generate sufficient cash flow to service our indebtedness and to comply with financial covenants in our outstanding debt instruments; and the risk that our stock repurchases may not be effected or may not achieve the desired objectives.
The forward-looking statements in this release do not include the potential impact of any acquisitions or divestitures that may be announced and/or completed after the date hereof.
More information about factors that could affect the company’s operating results is included under the captions “Risk Factors” and “Management’s Discussion and Analysis of Financial Condition and Results of Operations” in the company’s most recent Annual Report on Form 10-K and subsequent Quarterly Reports on Form 10-Q, copies of which may be obtained by visiting the company’s Investor Relations website at https://investors.ebayinc.com or the SEC’s website at www.sec.gov. Undue reliance should not be placed on the forward-looking statements in this press release, which are based on information available to the company on the date hereof. The company assumes no obligation to update such statements.
eBay Inc.
Unaudited Condensed Consolidated Balance Sheet
September 30,
2026
December 31,
2025
(In millions)
ASSETS
Current assets:
Cash and cash equivalents
$ 1,166
$ 1,867
Short-term investments
809
1,052
Customer accounts and funds receivable
1,624
1,280
Other current assets
1,187
887
Total current assets
4,786
5,086
Long-term investments
2,171
2,767
Property and equipment, net
1,303
1,165
Goodwill
5,242
4,467
Operating lease right-of-use assets
456
428
Deferred tax assets
2,929
2,959
Other assets
1,119
565
Total assets
$ 18,006
$ 17,437
LIABILITIES AND STOCKHOLDERS’ EQUITY
Current liabilities:
Short-term debt
$ 1,599
$ 750
Accounts payable
339
242
Customer accounts and funds payable
1,624
1,280
Accrued expenses and other current liabilities
2,542
2,257
Income taxes payable
22
108
Total current liabilities
6,126
4,637
Operating lease liabilities
343
315
Deferred tax liabilities
1,457
1,431
Long-term debt
5,134
5,996
Other liabilities
534
575
Total liabilities
13,594
12,954
Total stockholders’ equity
4,412
4,483
Total liabilities and stockholders’ equity
$ 18,006
$ 17,437
eBay Inc.
Unaudited Condensed Consolidated Statement of Income
Three Months Ended
September 30,
Nine Months Ended
September 30,
2026
2025
2026
2025
(In millions, except per share amounts)
Net revenues
$ 3,206
$ 2,820
$ 9,429
$ 8,135
Cost of net revenues (1)
887
794
2,521
2,241
Gross profit
2,319
2,026
6,908
5,894
Operating expenses:
Sales and marketing (1)
747
606
2,117
1,728
Product development (1)
517
455
1,451
1,300
General and administrative (1)
303
282
1,019
914
Transaction losses
122
106
393
273
Amortization of acquired intangible assets
14
6
25
18
Total operating expenses
1,703
1,455
5,005
4,233
Income from operations
616
571
1,903
1,661
Interest and other:
Gain (loss) on equity investments and warrants, net
6
(10)
10
(16)
Interest expense
(64)
(62)
(190)
(185)
Interest income and other, net
47
69
165
209
Income from continuing operations before income taxes
605
568
1,888
1,669
Income tax benefit (provision)
(104)
25
(323)
(210)
Income from continuing operations
501
593
1,565
1,459
Income (loss) from discontinued operations, net of income taxes
(4)
35
(6)
32
Net income
$ 497
$ 628
$ 1,559
$ 1,491
Income (loss) per share – basic:
Continuing operations
$ 1.13
$ 1.30
$ 3.51
$ 3.16
Discontinued operations
(0.01)
0.08
(0.01)
0.07
Net income per share – basic
$ 1.12
$ 1.38
$ 3.50
$ 3.23
Income (loss) per share – diluted:
Continuing operations
$ 1.11
$ 1.27
$ 3.44
$ 3.10
Discontinued operations
(0.01)
0.07
(0.01)
0.07
Net income per share – diluted
$ 1.10
$ 1.34
$ 3.43
$ 3.17
Weighted average shares:
Basic
444
456
445
461
Diluted
453
467
455
471
(1) Includes stock-based compensation as follows:
Cost of net revenues
$ 12
$ 11
$ 36
$ 30
Sales and marketing
25
21
74
65
Product development
86
73
248
228
General and administrative
50
42
153
125
$ 173
$ 147
$ 511
$ 448
eBay Inc.
Unaudited Condensed Consolidated Statement of Cash Flows
Three Months Ended
September 30,
Nine Months Ended
September 30,
2026
2025
2026
2025
(In millions)
Cash flows from operating activities:
Net income
$ 497
$ 628
$ 1,559
$ 1,491
Loss (income) from discontinued operations, net of income
taxes
4
(35)
6
(32)
Adjustments:
Transaction losses
122
106
393
273
Depreciation and amortization
116
77
310
208
Stock-based compensation
173
147
511
448
Deferred income taxes
32
69
75
11
Loss (gain) on investments, warrants and other, net
(10)
9
(40)
6
Changes in assets and liabilities, net of acquisition effects
(59)
(101)
(420)
(1,090)
Net cash provided by continuing operating activities
875
900
2,394
1,315
Net cash used in discontinued operating activities
—
(38)
(27)
(38)
Net cash provided by operating activities
875
862
2,367
1,277
Cash flows from investing activities:
Purchases of property and equipment
(126)
(97)
(421)
(309)
Purchases of investments
(37)
(1,093)
(1,446)
(6,100)
Maturities of investments
312
1,449
1,376
7,979
Sales of investments
61
42
745
42
Shareholder distributions from equity investments
—
2
194
227
Acquisition of Depop, net of cash acquired
(1,321)
—
(1,321)
—
Other
(16)
(4)
(55)
(96)
Net cash provided by (used in) investing activities
(1,127)
299
(928)
1,743
Cash flows from financing activities:
Proceeds from issuance of common stock
—
8
64
101
Repurchases of common stock
(664)
(626)
(1,473)
(1,865)
Payments for taxes related to net share settlements of
restricted stock units and awards
(77)
(71)
(266)
(208)
Payments for dividends
(138)
(132)
(415)
(400)
Repayment of senior notes
—
—
(750)
(800)
Proceeds from issuance of commercial paper
493
632
1,232
1,575
Repayment of commercial paper
(493)
(628)
(493)
(1,446)
Net funds receivable and payable activity
35
(57)
248
231
Other
4
—
(12)
(26)
Net cash used in financing activities
(840)
(874)
(1,865)
(2,838)
Effect of exchange rate changes on cash, cash equivalents and
restricted cash
6
(5)
(17)
45
Net increase (decrease) in cash, cash equivalents and restricted
cash
(1,086)
282
(443)
227
Cash, cash equivalents and restricted cash at beginning of
period
3,698
3,231
3,055
3,286
Cash, cash equivalents and restricted cash at end of period
$ 2,612
$ 3,513
$ 2,612
$ 3,513
eBay Inc.
Unaudited Summary of Consolidated Net Revenues
Three Months Ended
September 30,
2026
June 30,
2026
March 31,
2026
December 31,
2025
September 30,
2025
(In millions, except percentages)
Total net revenues (1)(2)
$ 3,206
$ 3,134
$ 3,089
$ 2,965
$ 2,820
Current quarter vs prior year quarter
14 %
15 %
19 %
15 %
9 %
Percent from international
43 %
44 %
44 %
46 %
48 %
(1) Hedge gain/(loss)
$ (2)
$ (1)
$ (13)
$ (19)
$ (24)
(2) Foreign currency impact
$ (7)
$ 22
$ 78
$ 16
$ 20
eBay Inc.
Unaudited Supplemental Operating Data
Three Months Ended
September 30,
2026
June 30,
2026
March 31,
2026
December 31,
2025
September 30,
2025
(In millions, except percentages)
Active Buyers (1)
147
136
136
135
134
Current quarter vs prior year quarter
10 %
2 %
1 %
1 %
1 %
Active Buyers excluding Depop and
Tise (2)(3)
136
136
135
134
Current quarter vs prior year quarter
1 %
1 %
1 %
1 %
Gross Merchandise Volume (4)
U.S.
$ 12,545
$ 11,688
$ 11,503
$ 10,721
$ 9,872
Current quarter vs prior year quarter
27 %
24 %
27 %
19 %
13 %
International
10,621
10,710
10,694
10,516
10,233
Current quarter vs prior year quarter
4 %
6 %
10 %
2 %
7 %
Total Gross Merchandise Volume
$ 23,166
$ 22,398
$ 22,197
$ 21,237
$ 20,105
Current quarter vs prior year quarter
15 %
15 %
18 %
10 %
10 %
(1)
Active Buyers consist of all buyers who paid for a transaction on our Marketplace platforms within the previous 12-month period. Buyers may register more than once, and as a result, may have more than one account.
(2)
On October 1, 2025, we completed the acquisition of Tise AS (Tise).
(3)
On July 30, 2026, we completed the acquisition of Depop Limited (Depop).
(4)
Gross Merchandise Volume consists of the total value of all paid transactions between users on our Marketplace platforms during the applicable period inclusive of shipping fees and taxes, without adjustment for returns or cancellations.
eBay Inc.
Business Outlook
The guidance figures provided below and elsewhere in this press release are forward-looking statements, reflect a number of estimates, assumptions and other uncertainties, and are approximate in nature because the company’s future performance is difficult to predict. Such guidance is based on information available on the date of this press release, and the company assumes no obligation to update it.
The company’s future performance involves risks and uncertainties, and the company’s actual results could differ materially from the information below and elsewhere in this press release. Some of the factors that could affect the company’s operating results are set forth under the caption “Forward-Looking Statements” above in this press release. More information about factors that could affect the company’s operating results is included under the captions “Risk Factors” and “Management’s Discussion and Analysis of Financial Condition and Results of Operations” in the company’s most recent Annual Report on Form 10-K and subsequent Quarterly Reports on Form 10-Q, copies of which may be obtained by visiting eBay’s investor relations website at https://investors.ebayinc.com or the SEC’s website at www.sec.gov.
eBay Inc.
Three Months Ending
December 31, 2026
(In billions, except per share amounts)
GAAP
Non-GAAP (a)
Net revenues
$3.19 – $3.24
$3.19 – $3.24
Diluted EPS from continuing operations
$0.82 – $0.87
$1.48 – $1.53
Gross Merchandise Volume
$23.7 – $24.1
Twelve Months Ending
December 31, 2026
(In billions, except per share amounts)
GAAP
Non-GAAP (b)
Net revenues
$12.62 – $12.67
$12.62 – $12.67
Diluted EPS from continuing operations
$4.26 – $4.31
$6.25 – $6.30
Gross Merchandise Volume
$91.5 – $91.9
(a) Estimated non-GAAP amounts above for the three months ending December 31, 2026 reflect adjustments that exclude the estimated amortization of acquired intangible assets of approximately $30-$32 million, estimated stock-based compensation expense and associated employer payroll tax expense of approximately $163-$173 million, estimated restructuring expense of $130-$150 million, and estimated adjustment between our GAAP and non-GAAP tax expense of approximately $(41)-$(47) million. The estimated GAAP diluted EPS above does not assume any future gains or losses on our equity investments.
(b) Estimated non-GAAP amounts above for the twelve months ending December 31, 2026 reflect adjustments that exclude the estimated amortization of acquired intangible assets of approximately $79-$81 million, estimated stock-based compensation expense and associated employer payroll tax expense of approximately $695-$705 million, estimated restructuring expense of $212-$232 million, and estimated adjustment between our GAAP and non-GAAP tax rate of approximately $(179)-$(184) million. The estimated GAAP diluted EPS above does not assume any future gains or losses on our equity investments.
eBay Inc.
Non-GAAP Measures of Financial Performance
To supplement the company’s condensed consolidated financial statements presented in accordance with generally accepted accounting principles, or GAAP, the company uses non-GAAP measures of certain components of financial performance. These non-GAAP measures include non-GAAP net income, non-GAAP earnings per diluted share, non-GAAP operating income and margin, non-GAAP effective tax rate, free cash flow and figures in this press release presented on an “FX-Neutral basis.” These non-GAAP financial measures are presented on a continuing operations basis.
These non-GAAP measures are not in accordance with, or an alternative to, measures prepared in accordance with GAAP and may be different from non-GAAP measures used by other companies. In addition, these non-GAAP measures are not based on any comprehensive set of accounting rules or principles. Non-GAAP measures have limitations in that they do not reflect all of the amounts associated with the company’s results of operations as determined in accordance with GAAP. These measures should only be used to evaluate the company’s results of operations in conjunction with the corresponding GAAP measures.
Reconciliation to the nearest GAAP measure of all non-GAAP measures included in this press release, except for figures in this press release presented on an “FX-Neutral basis,” can be found in the tables included in this press release. For figures in this press release reported on an “FX-Neutral basis,” the company calculates the year-over-year impact of foreign currency movements using prior period foreign currency rates, excluding hedging activity, applied to current year transactional currency amounts.
These non-GAAP measures are provided to enhance investors’ overall understanding of the company’s current financial performance and its prospects for the future. Specifically, the company believes the non-GAAP measures provide useful information to both management and investors by excluding certain expenses, gains and losses, or net purchases of property and equipment, as the case may be, that may not be indicative of its core operating results and business outlook. In addition, because the company has historically reported certain non-GAAP results to investors, the company believes that the inclusion of non-GAAP measures provides consistency in the company’s financial reporting.
For its internal budgeting process, and as discussed further below, the company’s management uses financial measures that do not include stock-based compensation expense, employer payroll taxes on stock-based compensation, amortization or impairment of acquired intangible assets, impairment of goodwill, amortization of deferred tax assets associated with the realignment of its legal structure and related foreign exchange effects, significant gains or losses from the disposal/acquisition of a business, certain gains and losses on investments including changes in fair value, changes in foreign currency exchange rates and the impact of any related foreign exchange derivative instruments, gains or losses associated with a warrant agreement that the company entered into with Adyen, restructuring-related charges and the income taxes associated with the foregoing. In addition to the corresponding GAAP measures, the company’s management also uses the foregoing non-GAAP measures in reviewing the financial results of the company.
The company excludes the following items from non-GAAP net income, non-GAAP earnings per diluted share, non-GAAP operating income and margin and non-GAAP effective tax rate:
Stock-based compensation expense and related employer payroll taxes. This expense consists of expenses for stock options, restricted stock and employee stock purchases. The company excludes stock-based compensation expense from its non-GAAP measures primarily because they are non-cash expenses that management does not believe are reflective of ongoing operating results. The related employer payroll taxes are dependent on the company’s stock price and the vesting of restricted stock by employees and the timing and size of stock option exercises, over which management has limited to no control, and as such management does not believe it correlates to the company’s operation of the business.
Amortization or impairment of acquired intangible assets, impairment of goodwill, certain amortization of deferred tax assets and related foreign exchange effects, and certain gains or losses on investments. The company incurs amortization or impairment of acquired intangible assets and goodwill in connection with acquisitions and excludes these amounts from its non-GAAP measures. The company also excludes certain gains and losses on investments. The company excludes the non-cash amortization of deferred tax assets associated with the realignment of its legal structure, which is not reduced by the effects of the Tax Cuts and Jobs Act, and related foreign exchange effects. The company excludes these items because management does not believe they correlate to the ongoing operating results of the company’s business.
Restructuring. These charges consist of expenses for employee severance and other exit and disposal costs. The company excludes significant restructuring charges primarily because management does not believe they are reflective of ongoing operating results.
Transaction related costs. The company may incur significant gains or losses and incremental costs related to the acquisition or disposal of a business, unsolicited proposals and shareholder activism matters. These costs include third party fees such as banker fees, legal and advisory fees and other professional services. The company excludes these items from its non-GAAP measures as management does not believe they correlate to the company’s ongoing operating results of the business.
Other certain significant gains, losses, or charges that are not indicative of the company’s core operating results. These are significant gains, losses, or charges during a period that are the result of isolated events or transactions which have not occurred frequently in the past and are not expected to occur regularly or be repeated in the future. The company excludes these amounts from its results primarily because management does not believe they are indicative of its current or ongoing operating results. These amounts include changes in fair value and the related change in foreign currency exchange rates of equity securities with readily determinable fair values, globally.
Change in fair market value of warrants. These are gains or losses associated with warrant agreements entered into with vendors, which are attributable to changes in fair value during the period.
Income tax effects and adjustments. We are using a non-GAAP tax rate of 17.5% for evaluating our operating results, up from 16.5% in 2025. This rate could change for various reasons including significant changes in our geographic earnings mix or fundamental tax law changes in major jurisdictions in which we operate.
In addition to the non-GAAP measures discussed above, the company also uses free cash flow. Free cash flow represents operating cash flows less purchases of property and equipment. The company considers free cash flow to be a liquidity measure that provides useful information to management and investors about the amount of cash generated by the business after the purchases of property, buildings, and equipment, which can then be used to, among other things, invest in the company’s business, make strategic acquisitions, repurchase stock and pay dividends. A limitation of the utility of free cash flow as a measure of financial performance is that it does not represent the total increase or decrease in the company’s cash balance for the period and does not exclude certain non-discretionary expenditures, such as mandatory debt service requirements.
eBay Inc.
Reconciliation of GAAP Operating Income to Non-GAAP Operating Income
Three Months Ended
September 30,
Nine Months Ended
September 30,
2026
2025
2026
2025
(In millions, except percentages)
GAAP operating income
$ 616
$ 571
$ 1,903
$ 1,661
Stock-based compensation expense and related employer
payroll taxes
177
153
532
469
Amortization of acquired intangible assets within cost of net
revenues and operating expenses
25
12
50
37
Restructuring and executive bonuses
(3)
24
102
79
Legal matters
—
—
(10)
52
Transaction related costs
28
—
66
—
Total non-GAAP operating income adjustments
227
189
740
637
Non-GAAP operating income
$ 843
$ 760
$ 2,643
$ 2,298
GAAP operating margin
19.2 %
20.3 %
20.2 %
20.4 %
Non-GAAP operating margin
26.3 %
27.0 %
28.0 %
28.3 %
Presented on a continuing operations basis
Reconciliation of GAAP Net Income to Non-GAAP Net Income and
GAAP Effective Tax Rate to Non-GAAP Effective Tax Rate
Three Months Ended
September 30,
Nine Months Ended
September 30,
2026
2025
2026
2025
(In millions, except per share amounts and percentages)
GAAP income from continuing operations before income taxes
$ 605
$ 568
$ 1,888
$ 1,669
GAAP provision for income taxes
(104)
25
(323)
(210)
GAAP net income from continuing operations
501
593
1,565
1,459
Non-GAAP adjustments to net income from continuing
operations:
Non-GAAP operating income from continuing operations
adjustments (see table above)
227
189
740
637
Change in fair value of equity investments and warrants
(1)
—
5
—
Income tax effects and adjustments
(42)
(149)
(138)
(169)
Non-GAAP net income from continuing operations
$ 685
$ 633
$ 2,172
$ 1,927
Diluted net income from continuing operations per share:
GAAP
$ 1.11
$ 1.27
$ 3.44
$ 3.10
Non-GAAP
$ 1.51
$ 1.35
$ 4.77
$ 4.09
Shares used in GAAP diluted net income per share calculation
453
467
455
471
Shares used in non-GAAP diluted net income per share
calculation
453
467
455
471
GAAP effective tax rate – Continuing operations
17.1 %
(4.3) %
17.1 %
12.6 %
Income tax effects and adjustments to net income from
continuing operations
0.4 %
20.8 %
0.4 %
3.9 %
Non-GAAP effective tax rate – Continuing operations
17.5 %
16.5 %
17.5 %
16.5 %
Presented on a continuing operations basis
Reconciliation of Operating Cash Flow to Free Cash Flow
Three Months Ended
September 30,
Nine Months Ended
September 30,
2026
2025
2026
2025
(In millions)
Net cash provided by continuing operating activities
$ 875
$ 900
$ 2,394
$ 1,315
Less: Purchases of property and equipment
(126)
(97)
(421)
(309)
Free cash flow
$ 749
$ 803
$ 1,973
$ 1,006
Presented on a continuing operations basis
View original content to download multimedia:https://www.prnewswire.com/news-releases/ebay-inc-reports-third-quarter-2026-results-302922657.html
SOURCE eBay Inc.
Technology
KLA Corporation Reports Fiscal 2027 First Quarter Results
Published
8 minutes agoon
October 28, 2026By

Total revenues were $4.14 billion, above the midpoint of the guidance range of $4.0 billion +/- $200 million;GAAP diluted EPS was $1.18 and non-GAAP diluted EPS was $1.22, both above the midpoints of the respective guidance ranges;Cash flow from operating activities for the quarter and last twelve months were $1.53 billion and $4.51 billion, respectively, and free cash flow was $1.34 billion and $4.04 billion, respectively; andCapital returns for the quarter and last twelve months were $1.24 billion and $3.79 billion, respectively.
MILPITAS, Calif., Oct. 28, 2026 /PRNewswire/ — KLA Corporation (NASDAQ: KLAC) today announced financial and operating results for its first quarter of fiscal year 2027, which ended on September 30, 2026, and reported GAAP net income of $1.55 billion and GAAP net income per diluted share of $1.18 on revenues of $4.14 billion.
“KLA’s September quarter beat the midpoint of guidance across all key metrics, demonstrating the accelerated growth we expected for the second half of calendar 2026,” said Rick Wallace, president and CEO of KLA Corporation. “Process control, and KLA in particular, continues to be critical to the AI ecosystem buildout and benefits from numerous ongoing inflections, including increases in leading-edge designs across foundry and logic, device size and value, memory complexity and performance requirements, and the importance of advanced packaging. In addition, KLA’s process, PCB, and component inspection businesses are benefiting from the technology transitions and the rigorous performance requirements of high-performance computing, which further augments the company’s growth profile. KLA’s market-leading product portfolio and its associated services offerings remain well positioned to address these compelling opportunities as we approach the end of calendar 2026 and look forward to calendar 2027.”
GAAP Results
Q1 FY 2027
Q4 FY 2026
Q1 FY 2026
Total Revenues
$4,136 million
$3,658 million
$3,210 million
Net Income
$1,549 million
$1,363 million
$1,121 million
Net Income per Diluted Share(1)
$1.18
$1.04
$0.85
Non-GAAP Results
Q1 FY 2027
Q4 FY 2026
Q1 FY 2026
Net Income
$1,603 million
$1,386 million
$1,167 million
Net Income per Diluted Share(1)
$1.22
$1.05
$0.88
__________________
(1)
All per share amounts referenced herein have been retroactively adjusted to reflect the ten-for-one stock split effective June 11, 2026.
A reconciliation between GAAP operating results and non-GAAP operating results is provided following the financial statements included in this release. KLA will discuss the results for its fiscal year 2027 first quarter, along with its outlook, on a conference call today beginning at 2 p.m. PT. A webcast of the call will be available at: ir.kla.com.
Second Quarter Fiscal 2027 Guidance
The following details our guidance for the second quarter of fiscal 2027 ending in December:
Total revenues are expected to be in a range of $4.7 billion +/- $200 millionGAAP gross margin is expected to be in a range of 61.8% +/- 1.0%Non-GAAP gross margin is expected to be in a range of 62.5% +/- 1.0%GAAP diluted EPS is expected to be in a range of $1.41 +/- $0.11Non-GAAP diluted EPS is expected to be in a range of $1.44 +/- $0.11
For additional details and assumptions underlying our guidance metrics, please see the company’s published Letter to Shareholders, Earnings Slide Presentation and Earnings Infographic on the KLA investor relations website (ir.kla.com). Such Letter to Shareholders, Earnings Slide Presentation and Earnings Infographic are not incorporated by reference into this earnings release.
About KLA:
KLA Corporation (“KLA”) develops industry-leading equipment and services that enable innovation throughout the electronics industry. We provide advanced process control and process-enabling solutions for manufacturing wafers and reticles, integrated circuits, packaging and printed circuit boards. In close collaboration with leading customers across the globe, our expert teams of physicists, engineers, data scientists and problem-solvers design solutions that move the world forward. Investors and others should note that KLA announces material financial information including SEC filings, press releases, public earnings calls and conference webcasts using an investor relations website (ir.kla.com). Additional information may be found at: www.kla.com.
Note Regarding Forward-Looking Statements:
Statements in this press release other than historical facts, such as statements pertaining to the amount and timing of dividends, the amount and timing of share repurchases, total revenues, GAAP and non-GAAP gross margin and GAAP and non-GAAP diluted EPS for the quarter ending Dec. 31, 2026, are forward-looking statements and are subject to the Safe Harbor provisions created by the Private Securities Litigation Reform Act of 1995. These forward-looking statements are based on current information and expectations and involve a number of risks and uncertainties. Actual results may differ materially from those projected in such statements due to various factors, including, but not limited to: our vulnerability to a weakening in the condition of the financial markets and the global economy; risks related to our international operations; evolving Bureau of Industry and Security of the U.S. Department of Commerce rules and regulations and their impact on our ability to sell products to and provide services to certain customers in China; tariffs, retaliatory trade measures and other trade restrictions, as well as uncertainty regarding tariff authority, implementation and refund process; costly intellectual property disputes that could result in our inability to sell or use the challenged technology; risks related to the legal, regulatory and tax environments in which we conduct our business; differing stakeholder expectations, requirements and attention to environment, social and governance (“ESG”) matters and the resulting costs, risks and impact on our business; unexpected delays, difficulties and expenses in executing against our environmental, climate, or other ESG targets, goals and commitments, or meeting stakeholder expectations; our ability to attract, retain and motivate key personnel; our vulnerability to disruptions and delays at our third-party service providers; cybersecurity threats, cyber incidents affecting our and our business partners’ systems and networks; our reliance on critical information, including our enterprise resource planning system for daily operations; risks related to acquisitions, integrations, strategic alliances or collaborative arrangements; climate change, natural disasters, public health crises, terrorism, acts of war and other catastrophic events and the adverse impact on our business operations; the war between Ukraine and Russia, the armed conflict in Iran and elsewhere in the Middle East, and the significant military activity in those regions; lack of insurance for losses and interruptions caused by terrorists and acts of war, and our self-insurance of certain risks including earthquake risk; risks related to fluctuations in foreign currency exchange rates; risks related to fluctuations in interest rates and the market values of our portfolio investments; risks associated with our interest rate hedging activities; risks related to tax and regulatory compliance audits; any change in taxation rules or practices and our effective tax rate; compliance costs with federal securities laws, rules, regulations, NASDAQ requirements, and evolving accounting standards and practices; ongoing changes in the technology industry, including artificial intelligence (“AI”) related developments and changes in semiconductor manufacturing processes, customer investment patterns and end-market demand; our vulnerability to a highly concentrated customer base; the cyclicality of the industries in which we operate; our ability to timely develop new technologies and products that successfully address changes in the industry; risks related to the development, adoption, governance and use of AI by us, our competitors and third parties; our ability to maintain our technology advantage and protect proprietary rights; our ability to compete in the industry; the availability and cost of components, materials or subassemblies used in the production of our products, including due to limited-source suppliers, the availability of rare earth elements or DRAM chip shortages; our ability to operate our business in accordance with our business plan; risks related to our debt and leveraged capital structure; we may not be able to declare cash dividends at all or in any particular amount; liability to our customers under indemnification provisions if our products fail to operate properly or contain defects or our customers are sued by third parties due to our products; risks associated with our receipt of government funding; we may incur significant restructuring charges or other asset impairment charges or inventory write offs; we are subject to risks related to receivables factoring, banking arrangements and compliance risk of certain settlement agreements with the government; and risks related to the Court of Chancery of the State of Delaware being the sole and exclusive forum for certain actions and proceedings. For other factors that may cause actual results to differ materially from those projected and anticipated in forward-looking statements in this press release, please refer to KLA’s Annual Report on Form 10-K for the year ended June 30, 2026, and other subsequent filings with the Securities and Exchange Commission (including, but not limited to, the risk factors described therein). KLA assumes no obligation to, and does not currently intend to, update these forward-looking statements.
KLA Corporation
Condensed Consolidated Unaudited Balance Sheets
(In thousands)
September 30, 2026
June 30, 2026
ASSETS
Current assets:
Cash and cash equivalents
$ 1,531,950
$ 1,649,842
Marketable securities
3,209,241
3,252,566
Accounts receivable, net
3,072,087
2,889,208
Inventories
4,090,426
3,648,538
Other current assets
669,711
941,636
Total current assets
12,573,415
12,381,790
Land, property and equipment, net
1,541,331
1,380,550
Goodwill, net
1,789,683
1,788,758
Deferred income taxes
1,054,617
1,037,224
Purchased intangible assets, net
212,598
255,835
Other non-current assets
1,233,091
1,107,378
Total assets
$ 18,404,735
$ 17,951,535
LIABILITIES AND STOCKHOLDERS’ EQUITY
Current liabilities:
Accounts payable
$ 740,743
$ 623,668
Deferred system revenue
843,008
932,901
Deferred service revenue
634,232
604,127
Other current liabilities
2,337,103
2,144,231
Total current liabilities
4,555,086
4,304,927
Long-term debt
5,723,289
5,887,415
Deferred tax liabilities
452,541
473,648
Deferred service revenue
230,562
238,111
Other non-current liabilities
919,850
697,614
Total liabilities
11,881,328
11,601,715
Stockholders’ equity:
Common stock and capital in excess of par value
2,585,416
2,700,409
Retained earnings
3,997,397
3,683,864
Accumulated other comprehensive loss
(59,406)
(34,453)
Total stockholders’ equity
6,523,407
6,349,820
Total liabilities and stockholders’ equity
$ 18,404,735
$ 17,951,535
KLA Corporation
Condensed Consolidated Unaudited Statements of Operations
Three Months Ended
(In thousands, except per share amounts)
September 30, 2026
June 30, 2026
September 30, 2025
Revenues:
Product
$ 3,285,469
$ 2,837,151
$ 2,465,006
Service
850,546
820,405
744,690
Total revenues
4,136,015
3,657,556
3,209,696
Costs and expenses:
Costs of revenues
1,577,791
1,413,108
1,243,070
Research and development
395,096
399,023
360,461
Selling, general and administrative
301,458
291,477
268,988
Interest expense
67,927
73,274
71,075
Other expense (income), net
(30,339)
(68,711)
(43,374)
Income before income taxes
1,824,082
1,549,385
1,309,476
Provision for income taxes
275,494
186,326
188,436
Net income
$ 1,548,588
$ 1,363,059
$ 1,121,040
Net income per share(1)
Basic
$ 1.19
$ 1.04
$ 0.85
Diluted
$ 1.18
$ 1.04
$ 0.85
Weighted-average number of shares(1):
Basic
1,305,330
1,306,517
1,317,567
Diluted
1,311,064
1,314,986
1,323,808
__________________
(1)
All per share amounts referenced herein have been retroactively adjusted to reflect the ten-for-one stock split effective June 11, 2026.
KLA Corporation
Condensed Consolidated Unaudited Statements of Cash Flows
Three Months Ended
(In thousands)
September 30, 2026
June 30, 2026
September 30, 2025
Cash flows from operating activities:
Net income
$ 1,548,588
$ 1,363,059
$ 1,121,040
Adjustments to reconcile net income to net cash provided by
operating activities:
Depreciation and amortization
97,424
98,606
97,016
Unrealized foreign exchange (gain) loss and other
(6,872)
6,343
12,078
Stock-based compensation expense
84,073
82,104
70,182
Deferred income taxes
(27,093)
105,049
(10,615)
Changes in assets and liabilities:
Accounts receivable
(179,196)
(586,459)
(12,575)
Inventories
(433,839)
(212,304)
(95,738)
Other assets
176,890
(423,291)
50,921
Accounts payable
116,666
107,788
(23,680)
Deferred system revenue
(89,893)
312,062
1,974
Deferred service revenue
22,556
14,172
(4,970)
Other liabilities
221,635
39,301
(44,042)
Net cash provided by operating activities
1,530,939
906,430
1,161,591
Cash flows from investing activities:
Capital expenditures
(194,756)
(89,288)
(95,894)
Proceeds from capital-related government assistance
435
—
1,541
Purchases of available-for-sale and equity securities
(701,246)
(860,407)
(949,871)
Proceeds from maturity and sale of available-for-sale securities
716,202
780,717
632,795
Purchases of trading securities
(36,801)
(35,233)
(156,864)
Proceeds from sale of trading securities
38,228
31,094
158,305
Net cash used in investing activities
(177,938)
(173,117)
(409,988)
Cash flows from financing activities:
Payment of debt issuance costs
—
—
(1,602)
Common stock repurchases
(935,776)
(570,997)
(545,067)
Payment of dividends to stockholders
(305,145)
(305,334)
(254,008)
Issuance of common stock
—
113,030
—
Tax withholding payments related to vested and released
restricted stock units
(238,682)
(113,775)
(81,122)
Net cash used in financing activities
(1,479,603)
(877,076)
(881,799)
Effect of exchange rate changes on cash and cash equivalents
8,710
6,595
(2,501)
Net decrease in cash and cash equivalents
(117,892)
(137,168)
(132,697)
Cash and cash equivalents at beginning of period
1,649,842
1,787,010
2,078,908
Cash and cash equivalents at end of period
$ 1,531,950
$ 1,649,842
$ 1,946,211
Supplemental cash flow disclosures:
Income taxes paid, net
$ 61,284
$ 198,963
$ 119,049
Interest paid, net of capitalized interest
$ 131,275
$ 11,919
$ 131,494
KLA Corporation
Segment Information (Unaudited)
The following is a summary of results for each of our three reportable segments and reconciliations to total revenues for the indicated periods:
Three Months Ended
(In thousands)
September 30, 2026
June 30, 2026
September 30, 2025
Revenues:
Semiconductor Process Control
$ 3,754,254
$ 3,256,781
$ 2,899,392
Specialty Semiconductor Process
139,487
159,704
119,755
PCB and Component Inspection
242,151
241,110
189,488
Total revenues for reportable segments
4,135,892
3,657,595
3,208,635
Effects of changes in foreign currency exchange rates
123
(39)
1,061
Total revenues
$ 4,136,015
$ 3,657,556
$ 3,209,696
KLA Corporation
Condensed Consolidated Unaudited Supplemental Information
Reconciliation of GAAP Net Income to Non-GAAP Net Income
Three Months Ended
(In thousands, except per share amounts)
September 30,
2026
June 30,
2026
September 30,
2025
GAAP net income
$ 1,548,588
$ 1,363,059
$ 1,121,040
Adjustments to reconcile GAAP net income to non-GAAP net income:
Acquisition-related charges
a
43,040
33,069
49,026
Income tax effect of non-GAAP adjustments
b
(14,560)
(17,159)
(18,348)
Pillar Two undertaxed profits rule taxes
c
20,151
—
—
Discrete tax items
d
5,785
6,780
15,087
Non-GAAP net income
$ 1,603,004
$ 1,385,749
$ 1,166,805
GAAP net income per diluted share(1)
$ 1.18
$ 1.04
$ 0.85
Non-GAAP net income per diluted share(1)
$ 1.22
$ 1.05
$ 0.88
Shares used in diluted net income per share calculation(1)
1,311,064
1,314,986
1,323,808
__________________
(1)
All per share amounts referenced herein have been retroactively adjusted to reflect the ten-for-one stock split effective June 11, 2026.
Pre-tax Impact of GAAP to Non-GAAP Adjustments Included in Condensed Consolidated Unaudited Statements of Operations
(In thousands)
Acquisition-Related
Charges
Total Pre-tax GAAP to
Non-GAAP Adjustments
Three Months Ended September 30, 2026
Costs of revenues
$ 34,929
$ 34,929
Selling, general and administrative
8,111
8,111
Total in three months ended September 30, 2026
$ 43,040
$ 43,040
Three Months Ended June 30, 2026
Costs of revenues
$ 36,200
$ 36,200
Selling, general and administrative
8,470
8,470
Other expense (income), net
(11,601)
(11,601)
Total in three months ended June 30, 2026
$ 33,069
$ 33,069
Three Months Ended September 30, 2025
Costs of revenues
$ 38,053
$ 38,053
Selling, general and administrative
10,973
10,973
Total in three months ended September 30, 2025
$ 49,026
$ 49,026
Reconciliation of Net Cash Provided by Operating Activities (GAAP) to Free Cash Flow
Three Months Ended
Twelve Months Ended
(In thousands)
September 30,
2026
June 30,
2026
September 30,
2025
September 30,
2026
September 30,
2025
Net cash provided by operating activities
$ 1,530,939
$ 906,430
$ 1,161,591
$ 4,512,427
$ 4,248,256
Capital expenditures
(194,756)
(89,288)
(95,894)
(474,807)
(370,760)
Free cash flow
$ 1,336,183
$ 817,142
$ 1,065,697
$ 4,037,620
$ 3,877,496
Capital Returns Calculation
Three Months Ended
Twelve Months Ended
(In thousands)
September 30,
2026
June 30,
2026
September 30,
2025
September 30,
2026
September 30,
2025
Payments of dividends to stockholders
$ 305,145
$ 305,334
$ 254,008
$ 1,108,969
$ 960,523
Common stock repurchases
935,776
570,997
545,067
2,680,478
2,127,630
Capital returns
$ 1,240,921
$ 876,331
$ 799,075
$ 3,789,447
$ 3,088,153
Second Quarter Fiscal 2027 Guidance
Reconciliation of GAAP Diluted EPS to Non-GAAP Diluted EPS
Three Months Ending December 31, 2026
(In millions, except per share amounts)
Low
High
GAAP net income per diluted share
$1.30
$1.52
Acquisition-related charges
a
0.03
0.03
Income tax effect of non-GAAP adjustments
b
(0.01)
(0.01)
Pillar Two undertaxed profits rule taxes
c
0.01
0.01
Non-GAAP net income per diluted share
$1.33
$1.55
Shares used in net income per diluted share calculation
1,306
1,306
Reconciliation of GAAP Gross Margin to Non-GAAP Gross Margin
Three Months Ending December 31, 2026
Low
High
GAAP gross margin
60.8 %
62.8 %
Acquisition-related charges
a
0.7 %
0.7 %
Non-GAAP gross margin
61.5 %
63.5 %
The non-GAAP and supplemental information provided in this press release is a supplement to, and not a substitute for, KLA’s financial results presented in accordance with United States GAAP.
To supplement our Condensed Consolidated Financial Statements presented in accordance with GAAP, we provide certain non-GAAP financial information, which is adjusted from results based on GAAP to exclude certain gains, costs and expenses, as well as other supplemental information. The non-GAAP and supplemental information is provided to enhance the user’s overall understanding of our operating performance and our prospects in the future. Specifically, we believe that the non-GAAP information, including non-GAAP net income, non-GAAP net income per diluted share, non-GAAP gross margin and free cash flow, provides useful measures to both management and investors regarding financial and business trends relating to our financial performance by excluding certain costs and expenses that we believe are not indicative of our core operating results to help investors compare our operating performances with our results in prior periods as well as with the performance of other companies. The non-GAAP information is among the budgeting and planning tools that management uses for future forecasting. However, because there are no standardized or generally accepted definitions for most non-GAAP financial metrics, definitions of non-GAAP financial metrics are inherently subject to significant discretion (for example, determining which costs and expenses to exclude when calculating such a metric). As a result, non-GAAP financial metrics may be defined very differently from company to company, or even from period to period within the same company, which can potentially limit the usefulness of such information to an investor. The presentation of non-GAAP and supplemental information is not meant to be considered in isolation or as a substitute for results prepared and presented in accordance with United States GAAP. The following are descriptions of the adjustments made to reconcile GAAP net income to non-GAAP net income:
a.
Acquisition-related charges primarily include amortization of intangible assets. Acquisition-related charges during the three months ended June 30, 2026 also include a discrete release of $11.6 million of interest on unrecognized tax positions recorded as part of purchase price accounting arising from acquisitions. Although we exclude the effect of amortization of all acquired intangible assets from these non-GAAP financial measures, management believes that it is important for investors to understand that such intangible assets were recorded as part of purchase price accounting arising from acquisitions, and such amortization of intangible assets related to past acquisitions will recur in future periods until such intangible assets have been fully amortized. Investors should note that the use of these intangible assets contributed to our revenues earned during the periods presented and are expected to contribute to our future period revenues as well.
b.
Income tax effect of non-GAAP adjustments includes the income tax effects of the excluded items noted above.
c.
Pillar Two undertaxed profits rule taxes represents the impact of Undertaxed Profits Rule taxes arising from Pillar Two legislation. We expect these taxes to be temporary and reverse upon adoption of the Side-by-Side Safe Harbor provisions, which would exempt U.S.-parented groups from the Undertaxed Profits Rule.
d.
Discrete tax items in the three months ended Sept. 30, 2025 include the recognition of a deferred tax liability for withholding taxes on future remittance of previously taxed income as a result of new tax legislation. Discrete tax items in all periods presented include a tax impact relating to the amortization of tax benefits from internal restructuring or similar tax benefits recorded in other periods.
View original content to download multimedia:https://www.prnewswire.com/news-releases/kla-corporation-reports-fiscal-2027-first-quarter-results-302922511.html
SOURCE KLA Corporation
Technology
Gen Delivers Another Double-Digit Growth Quarter in Q2 FY27 and Raises FY27 Outlook
Published
8 minutes agoon
October 28, 2026By
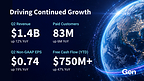
TEMPE, Ariz. and PRAGUE, Oct. 28, 2026 /PRNewswire/ — Gen Digital Inc. (NASDAQ: GEN), a global leader dedicated to powering Digital Freedom, released its results for its second quarter fiscal year 2027, which ended October 2, 2026.
“We delivered our sixth consecutive quarter of double-digit bookings growth,” said Vincent Pilette, CEO of Gen. “We reached a record high customer count, alongside strong product engagement and retention. Innovation across our brands and continued investment in our platform are resonating with consumers. We’re building on that momentum to expand how we help people protect and manage their digital and financial lives in an increasingly agentic AI world.”
Q2 Fiscal Year 2027 Financial Highlights
Q2 GAAP Results
Revenue of $1.369 billion, up 12% Operating income of $507 million, up 16%Diluted EPS of $0.48, up 122%Year-to-date operating cash flow of $760 million, up 45%
Q2 Non-GAAP Results
Bookings of $1.347 billion, up 10%Revenue of $1.369 billion, up 12%Operating income of $686 million, up 10%Diluted EPS of $0.74, up 19%Year-to-date free cash flow of $753 million, up 47%
“Our second quarter results reflect the durability of our business model and continued momentum across both segments,” said Natalie Derse, CFO of Gen. “Customer demand is strong, and we remain disciplined about investment, efficiency and profitable growth. That balance gives us the confidence to invest in our highest potential opportunities and raise full-year guidance again. We remain focused on consistent execution and lasting value for customers and shareholders.”
Non-GAAP Q3 Fiscal Year 2027 Guidance
Q3 FY27 Revenue expected to be in the range of $1.365 billion to $1.390 billionQ3 FY27 EPS expected to be in the range of $0.73 to $0.75
Raises Non-GAAP Fiscal Year 2027 Guidance
FY27 Revenue expected to be in the range of $5.465 billion to $5.515 billion, compared to prior guidance of $5.375 billion to $5.475 billionFY27 EPS expected to be in the range of $2.93 to $2.98, compared to prior guidance of $2.87 to $2.97
Quarterly Cash Dividend
Gen’s Board of Directors has approved a regular quarterly cash dividend of $0.125 per common share to be paid on December 9, 2026, to all shareholders of record as of the close of business on November 16, 2026.
Q2 Fiscal Year 2027 Earnings Call
October 28, 2026
2 p.m. PT / 5 p.m. ET
Webcast & Dial-in instructions at Investor.GenDigital.com. A replay will be posted following the call. For additional details regarding Gen’s results and outlook, please see the Financials section of the Investor Relations website at Investor.GenDigital.com.
About Gen
Gen (NASDAQ: GEN) is a global company dedicated to powering Digital Freedom. Through its trusted brands including Norton, Avast, LifeLock, MoneyLion and Engine, Gen helps people protect and take control of their digital and financial lives. As AI reshapes how people discover, decide and transact, Gen is building the security and trust layer to empower people and their agents to navigate digital life more safely. Gen empowers nearly 500 million users in more than 150 countries through its products and services that span cybersecurity, online privacy, identity protection and financial wellness. Learn more at GenDigital.com.
Forward-Looking Statements
This press release contains statements which may be considered forward-looking within the meaning of the U.S. federal securities laws. In some cases, you can identify these forward-looking statements by the use of terms such as “expect,” “will,” “continue,” or similar expressions, and variations or negatives of these words, but the absence of these words does not mean that a statement is not forward-looking. All statements other than statements of historical fact are statements that could be deemed forward-looking statements, including, but not limited to, the quotes under “Q2 Fiscal Year 2027 Financial Highlights” including expectations relating to achievement of long-term objectives, and the statements under “Non-GAAP Q3 Fiscal Year 2027 Guidance” and “Non-GAAP Fiscal Year 2027 Guidance” including expectations relating to Q3 Fiscal Year 2027 and Fiscal Year 2027 non-GAAP revenue and non-GAAP EPS, and any statements of assumptions underlying any of the foregoing. These statements are subject to known and unknown risks, uncertainties and other factors that may cause our actual results, levels of activity, performance or achievements to differ materially from results expressed or implied in this press release. Such risk factors include, but are not limited to, those related to: the consummation of or anticipated impacts of acquisitions (including our ability to achieve synergies and associated cost savings from any such acquisitions); divestitures, restructurings, stock repurchases, financings, debt repayments and investment activities; the outcome or impact of pending litigation, claims or disputes; difficulties in executing the operating model for the consumer Cyber Safety business; lower than anticipated returns from our investments in direct customer acquisition; difficulties in retaining our existing customers and converting existing non-paying customers to paying customers; difficulties and delays in reducing run rate expenses and monetizing underutilized assets; the successful development of new products and upgrades and the degree to which these new products and upgrades gain market acceptance; our ability to maintain our customer and partner relationships; the anticipated growth of certain market segments; fluctuations and volatility in our stock price; our ability to successfully execute strategic plans; the vulnerability of our solutions, systems, websites and data to intentional disruption by third parties; changes to existing accounting pronouncements or taxation rules or practices; and general business and macroeconomic changes in the U.S. and worldwide, including economic recessions, the impact of inflation, fluctuations in foreign currency exchange rates, changes in interest rates or tax rates, and ongoing and new geopolitical conflicts, and other global macroeconomic factors on our operations and financial performance. Additional information concerning these and other risk factors is contained in the Risk Factors sections of our most recent reports on Form 10-K and Form 10-Q. We encourage you to read those sections carefully. There may also be other factors that have not been anticipated or are not described in our periodic filings, generally because we did not believe them to be significant at the time, which could cause actual results to differ materially from our projections and expectations. All forward-looking statements should be evaluated with the understanding of their inherent uncertainty. We assume no obligation, and do not intend, to update these forward-looking statements as a result of future events or developments.
Use of Non-GAAP Financial Information
We use non-GAAP measures of operating margin, operating income, net income and earnings per share, which are adjusted from results based on GAAP and exclude certain expenses, gains and losses. We also provide the non-GAAP metrics of revenues, and constant currency revenues. These non-GAAP financial measures are provided to enhance the user’s understanding of our past financial performance and our prospects for the future, and to provide more meaningful comparisons of our current results to our historical performance by adjusting items that affect comparability between periods. Our management team uses these non-GAAP financial measures in assessing Gen’s performance, as well as in planning and forecasting future periods. These non-GAAP financial measures are not computed according to GAAP and the methods we use to compute them may differ from the methods used by other companies. Non-GAAP financial measures are supplemental, should not be considered a substitute for financial information presented in accordance with GAAP and should be read only in conjunction with our condensed consolidated financial statements prepared in accordance with GAAP. Readers are encouraged to review the reconciliation of our non-GAAP financial measures to the comparable GAAP results, which is attached to our quarterly earnings release, and which can be found, along with other financial information including the Earnings Presentation, on the investor relations page of our website at Investor.GenDigital.com. No reconciliation of the forecasted range for non-GAAP revenues and EPS guidance is included in this release because most non-GAAP adjustments pertain to events that have not yet occurred. It would be unreasonably burdensome to forecast, therefore we are unable to provide an accurate estimate.
GEN DIGITAL INC.
Condensed Consolidated Balance Sheets
(Unaudited, in millions)
October 2, 2026
April 3, 2026
ASSETS
Current assets:
Cash, cash equivalents and restricted cash
$ 589
$ 411
Accounts receivable, net
398
361
Other current assets
295
295
Assets held for sale
16
14
Total current assets
1,298
1,081
Property and equipment, net
69
71
Intangible assets, net
1,927
2,096
Goodwill
10,930
10,996
Deferred income tax assets
1,143
1,153
Other long-term assets
181
192
Total assets
$ 15,548
$ 15,589
LIABILITIES AND STOCKHOLDERS’ EQUITY (DEFICIT)
Current liabilities:
Accounts payable
$ 82
$ 96
Accrued compensation and benefits
79
115
Current portion of long-term debt
1,080
181
Contract liabilities
1,823
1,904
Other current liabilities
417
414
Total current liabilities
3,481
2,710
Long-term debt
7,036
8,015
Long-term contract liabilities
76
73
Deferred income tax liabilities
178
198
Long-term income taxes payable
1,625
1,588
Other long-term liabilities
411
394
Total liabilities
12,807
12,978
Total stockholders’ equity (deficit)
2,741
2,611
Total liabilities and stockholders’ equity (deficit)
$ 15,548
$ 15,589
GEN DIGITAL INC.
Condensed Consolidated Statements of Operations
(Unaudited, in millions, except per share amounts)
Three Months Ended
Six Months Ended
October 2, 2026
October 3, 2025
October 2, 2026
October 3, 2025
Net revenues
$ 1,369
$ 1,220
$ 2,705
$ 2,477
Cost of revenues
330
266
637
533
Gross profit
1,039
954
2,068
1,944
Operating expenses:
Sales and marketing
298
297
598
594
Research and development
112
100
230
209
General and administrative
66
60
146
134
Amortization of intangible assets
56
55
112
109
Restructuring and other costs
—
4
32
14
Total operating expenses
532
516
1,118
1,060
Operating income (loss)
507
438
950
884
Interest expense
(123)
(146)
(247)
(302)
Other income (expense), net
2
(59)
6
(49)
Income (loss) before income taxes
386
233
709
533
Income tax expense (benefit)
99
99
207
264
Net income (loss)
$ 287
$ 134
$ 502
$ 269
Net income (loss) per share – basic
$ 0.48
$ 0.22
$ 0.84
$ 0.44
Net income (loss) per share – diluted
$ 0.48
$ 0.21
$ 0.83
$ 0.43
Weighted-average shares outstanding:
Basic
596
616
598
617
Diluted
603
624
603
624
GEN DIGITAL INC.
Condensed Consolidated Statements of Cash Flows
(Unaudited, in millions)
Three Months Ended
Six Months Ended
October 2, 2026
October 3, 2025
October 2, 2026
October 3, 2025
OPERATING ACTIVITIES:
Net income (loss)
$ 287
$ 134
$ 502
$ 269
Adjustments:
Amortization and depreciation
122
125
245
248
Stock-based compensation expense
56
56
110
122
Loss on sale of Instacash Advances
69
55
129
91
Deferred income taxes
(16)
(17)
(25)
(6)
Loss on sale of property
—
—
—
1
Non-cash operating lease expense
4
5
8
9
Change in fair value and impairment of non-marketable equity
investments
—
69
—
69
Foreign currency remeasurement loss (gain)
(17)
3
(18)
89
Other
14
11
23
21
Changes in operating assets and liabilities, net of acquisitions:
Accounts receivable, net
(21)
(13)
(34)
(3)
Accounts payable
(15)
(9)
(14)
(57)
Accrued compensation and benefits
4
12
(35)
(9)
Contract liabilities
(24)
(3)
(80)
(72)
Income taxes payable
(35)
(225)
40
(164)
Instacash Advances held for sale, net
(45)
(44)
(131)
(91)
Other assets
8
7
5
65
Other liabilities
(65)
(50)
35
(57)
Net cash provided by (used in) operating activities
326
116
760
525
INVESTING ACTIVITIES:
Purchases of property and equipment
(3)
(9)
(7)
(13)
Payments for acquisitions, net of cash acquired
—
—
—
(876)
Payments for originations of notes receivable
(88)
—
(173)
—
Proceeds from principal repayments of notes receivable
81
—
158
—
Proceeds from sale of non-marketable equity investments
—
4
—
4
Proceeds from the sale of property
—
—
—
9
Other
—
(2)
(3)
(4)
Net cash provided by (used in) investing activities
(10)
(7)
(25)
(880)
FINANCING ACTIVITIES:
Repayments of debt
(45)
(169)
(90)
(360)
Proceeds from issuance of debt, net of issuance costs (1)
—
—
—
741
Net proceeds from sales of common stock under employee
stock incentive plans
7
7
7
7
Tax payments related to vesting of stock units
(3)
(3)
(44)
(47)
Dividends and dividend equivalents paid
(76)
(77)
(157)
(159)
Repurchases of common stock
(171)
—
(271)
(134)
Other
(1)
—
(1)
—
Net cash provided by (used in) financing activities
(289)
(242)
(556)
48
Effect of exchange rate fluctuations on cash, cash equivalents
and restricted cash
(2)
6
(1)
2
Change in cash, cash equivalents and restricted cash
25
(127)
178
(305)
Beginning cash, cash equivalents and restricted cash
564
828
411
1,006
Ending cash, cash equivalents and restricted cash
$ 589
$ 701
$ 589
$ 701
_____________________
(1)
Issuance costs paid for issuance of debt for the six months ended October 3, 2025 were $9 million.
GEN DIGITAL INC.
Reconciliation of Selected GAAP Measures to Non-GAAP Measures (1) (2)
(Unaudited, in millions, except per share amounts)
Three Months Ended
October 2, 2026
October 3, 2025
Operating income (loss)
$ 507
$ 438
Stock-based compensation
56
55
Amortization of intangible assets
118
121
Restructuring and other costs
—
4
Acquisition and integration costs
3
2
Litigation costs
2
2
Other
—
1
Operating income (loss) (Non-GAAP)
$ 686
$ 623
Operating margin
37.0 %
35.9 %
Operating margin (Non-GAAP)
50.1 %
51.1 %
Net income (loss)
$ 287
$ 134
Adjustments to net income (loss):
Stock-based compensation
56
55
Amortization of intangible assets
118
121
Restructuring and other costs
—
4
Acquisition and integration costs
3
2
Litigation costs
2
2
Other
—
3
Non-cash interest expense
5
7
Change in fair value and impairment of non-marketable equity investments
—
69
Total adjustments to GAAP income (loss) before income taxes
184
263
Adjustment to GAAP provision for income taxes
(27)
(10)
Total adjustment to income (loss), net of taxes
157
253
Net income (loss) (Non-GAAP)
$ 444
$ 387
Diluted net income (loss) per share
$ 0.48
$ 0.21
Adjustments to diluted net income (loss) per share:
Stock-based compensation
0.09
0.09
Amortization of intangible assets
0.20
0.19
Restructuring and other costs
—
0.01
Acquisition and integration costs
0.00
0.00
Litigation costs
0.00
0.00
Other
—
0.00
Non-cash interest expense
0.01
0.01
Change in fair value and impairment of non-marketable equity investments
—
0.11
Total adjustments to GAAP income (loss) before income taxes
0.31
0.42
Adjustment to GAAP provision for income taxes
(0.04)
(0.02)
Total adjustment to income (loss), net of taxes
0.26
0.41
Diluted net income (loss) per share (Non-GAAP)
$ 0.74
$ 0.62
Diluted weighted-average shares outstanding
603
624
Diluted weighted-average shares outstanding (Non-GAAP)
603
624
Six Months Ended
October 2, 2026
October 3, 2025
Net cash provided by (used in) operating activities
$ 760
$ 525
Adjustments to net cash provided by (used in) operating activities:
Purchases of property and equipment
(7)
(13)
Free cash flow (Non-GAAP)
$ 753
$ 512
__________________________
(1)
This presentation includes non-GAAP measures. Non-GAAP financial measures are supplemental and should not be considered a substitute for financial information presented in accordance with GAAP. For a detailed explanation of these non-GAAP measures, see Appendix A.
(2)
Amounts may not add due to rounding.
GEN DIGITAL INC.
Performance Metrics
(Unaudited, in millions)
Performance Metrics
Three Months Ended
October 2, 2026
October 3, 2025
Cyber Safety Platform
$ 858
$ 814
Trust-Based Solutions
511
406
Total net revenues
$ 1,369
$ 1,220
Direct revenues
$ 1,074
$ 1,010
Partner revenues
295
210
Total net revenues
$ 1,369
$ 1,220
Total bookings
$ 1,347
$ 1,222
As of
October 2, 2026
October 3, 2025
Total paid customers
83
77
GEN DIGITAL INC.
Appendix A
Explanation of Non-GAAP Measures and Other Items
Objective of non-GAAP measures: We believe our presentation of non-GAAP financial measures, when taken together with corresponding GAAP financial measures, provides meaningful supplemental information regarding the Company’s operating performance for the reasons discussed below. Our management team uses these non-GAAP financial measures in assessing our performance, as well as in planning and forecasting future periods. Due to the importance of these measures in managing the business, we use non-GAAP measures in the evaluation of management’s compensation. These non-GAAP financial measures are not computed according to GAAP and the methods we use to compute them may differ from the methods used by other companies. Non-GAAP financial measures are supplemental and should not be considered a substitute for financial information presented in accordance with GAAP and should be read only in conjunction with our consolidated financial statements prepared in accordance with GAAP.
Stock-based compensation: This consists of expenses for employee restricted stock units, performance-based awards, stock options and our employee stock purchase plan, determined in accordance with GAAP. We evaluate our performance both with and without these measures because stock-based compensation is a non-cash expense and can vary significantly over time based on the timing, size, nature and design of the awards granted, and is influenced in part by certain factors that are generally beyond our control, such as the volatility of the market value of our common stock. In addition, for comparability purposes, we believe it is useful to provide a non-GAAP financial measure that excludes stock-based compensation to facilitate the comparison of our results to those of other companies in our industry.
Amortization of intangible assets: Amortization of intangible assets consists of amortization of acquisition-related intangible assets such as developed technology, customer relationships and trade names acquired in connection with business combinations. We record charges relating to the amortization of these intangibles within both cost of revenues and operating expenses in our GAAP financial statements. Under purchase accounting, we are required to allocate a portion of the purchase price to intangible assets acquired and amortize this amount over the estimated useful lives of the acquired intangible assets. However, the purchase price allocated to these assets is not necessarily reflective of the cost we would incur to internally develop the intangible asset. Further, amortization charges for our acquired intangible assets are inconsistent in size and are significantly impacted by the timing and valuation of our acquisitions. We eliminate these charges from our non-GAAP operating results to facilitate an evaluation of our current operating performance and provide better comparability to our past operating performance.
Restructuring and other costs: Restructuring charges are costs associated with a formal restructuring plan and are primarily related to employee severance and benefit arrangements, contract termination costs, and assets write-offs, as well as other exit and disposal costs. Included in other exit and disposal costs are costs to exit and consolidate facilities in connection with restructuring events. We exclude restructuring and other costs from our non-GAAP results as we believe that these costs are incremental to core activities that arise in the ordinary course of our business and do not reflect our current operating performance, and that excluding these charges facilitates a more meaningful evaluation of our current operating performance and comparisons to our past operating performance.
Acquisition-related and integration costs: These represent the transaction and business integration costs related to significant acquisitions that are charged to operating expense in our GAAP financial statements. These costs include incremental expenses incurred to affect these business combinations such as advisory, legal, accounting, valuation, and other professional or consulting fees. We exclude these costs from our non-GAAP results as they have no direct correlation to the operation of our business, and because we believe that the non-GAAP financial measures excluding these costs provide meaningful supplemental information regarding the spending trends of our business. In addition, these costs vary, depending on the size and complexity of the acquisitions, and are not indicative of costs of future acquisitions.
Litigation costs: We may periodically incur charges or benefits related to litigation settlements, legal contingency accruals and third-party legal costs related to certain legal matters. We exclude these charges and benefits when associated with a significant matter because we do not believe they are reflective of ongoing business and operating results.
Non-cash interest expense and amortization of debt issuance costs: In accordance with GAAP, we separately account for the value of the conversion feature on our convertible notes as a debt discount that reflects our assumed non-convertible debt borrowing rates. We amortize the discount and debt issuance costs over the term of the related debt. We exclude the difference between the imputed interest expense, which includes the amortization of the conversion feature and of the issuance costs, and the coupon interest payments. We extinguished our remaining convertible debt on August 15, 2022. During fiscal 2023, we also started amortizing the debt issuance costs associated with our senior credit facilities, which were secured upon close of the acquisition of Avast. We believe that excluding these costs provides meaningful supplemental information regarding the cash cost of our debt instruments and enhances investors’ ability to view the Company’s results from management’s perspective.
Gain (loss) on extinguishment of debt: We record gains or losses on extinguishment of debt. Gains or losses represent the difference between the fair value of the exchange consideration and the carrying value of the liability component of the debt at the date of extinguishment. We exclude the gain or loss on debt extinguishment in our non-GAAP results because they are not reflective of our ongoing business.
Change in fair value and impairment of non-marketable equity investments: We record gains or losses, unrealized and realized, on equity investments in privately-held companies. We exclude the net gains or losses because we do not believe they are reflective of our ongoing business.
Gain (loss) on sale of properties and nonfinancial assets: We periodically recognize gains or losses from the disposition of land, buildings and nonfinancial assets. We exclude such gains or losses because they are not reflective of our ongoing business and operating results.
Income tax effects and adjustments: We use a non-GAAP tax rate that excludes (1) the discrete impacts of changes in tax legislation, (2) most other significant discrete items, (3) unrealized gains or losses from remeasurement of foreign currency denominated deferred tax items and uncertain tax benefits, and (4) the income tax effects of the non-GAAP adjustment to our operating results described above. We believe making these adjustments facilitates a better evaluation of our current operating performance and comparisons to past operating results. Our tax rate is subject to change for a variety of reasons, such as significant changes in the geographic earnings mix due to acquisition and divestiture activities or fundamental tax law changes in major jurisdictions where we operate.
Diluted GAAP and non-GAAP weighted-average shares outstanding: Diluted GAAP and non-GAAP weighted-average shares outstanding are generally the same, except in periods when there is a GAAP loss from continuing operations. In accordance with GAAP, we do not present dilution for GAAP in periods in which there is a loss from continuing operations. However, if there is non-GAAP net income, we present dilution for non-GAAP weighted-average shares outstanding in an amount equal to the dilution that would have been presented had there been GAAP income from continuing operations for the period.
Bookings: Bookings are defined as customer orders received that are expected to generate net revenues in the future. We present the operational metric of bookings because it reflects customers’ demand for our products and services and to assist readers in analyzing our performance in future periods.
Free cash flow: Free cash flow is defined as cash flows from operating activities less purchases of property and equipment. Free cash flow is not a measure of financial condition under GAAP and does not reflect our future contractual commitments and the total increase or decrease of our cash balance for a given period, and thus should not be considered as an alternative to cash flows from operating activities or as a measure of liquidity.
(Unlevered) Free cash flow: Free cash flow is defined as cash flows from operating activities less purchases of property and equipment. Unlevered free cash flow excludes cash interest expense payments, net of payments received through interest rate swap hedges. Free cash flow is not a measure of financial condition under GAAP and does not reflect our future contractual commitments and the total increase or decrease of our cash balance for a given period, and thus should not be considered as an alternative to cash flows from operating activities or as a measure of liquidity.
Cyber Safety Platform: Includes our security and privacy products, as well as our cyber safety comprehensive suites which deliver technology solutions and superior threat protection to help people navigate the digital world, securely, privately and confidently.
Trust-Based Solutions: Trust-Based Solutions includes our identity, reputation, and financial wellness products, which provide innovative solutions and insights that empower consumers to grow and manage their identity, reputation and finances confidently.
Direct revenue: Direct revenue reflects subscriptions sold directly through e-commerce or mobile channels, and revenue generated from financial transactions directly made through Gen properties or marketplaces.
Partner revenue: Partner revenue reflects partner-sourced and channel revenue via retailers, employee benefits, telcos, publishers, and strategic partnerships, including revenue generated from product usage or products sold through our financial marketplace.
Paid customers: We define paid customers as active users of our products and solutions, including subscribers with an active paid subscription to our products at the end of the reported period. Paid customers also includes product users with a unique account and at least one revenue-generating transaction in the relevant active period of each respective product category, whether through our first-party personal finance products, transacting through our financial marketplaces, or generating revenue through product usage. We exclude users on free trials and those who have not actively transacted in the relevant period of each respective product category. In order to properly reflect Gen’s customer cohorts that contribute to revenue given the dynamic nature of consumers and our product portfolio, our methodology is subject to change from time to time. The methodologies used to measure these metrics require judgment and we regularly review our metrics to improve their accuracy. However, our ability to recalculate our historical metrics may be impacted by data limitations or other factors that require us to apply different methodologies for such adjustments. We generally do not intend to update previously disclosed metrics for any such inaccuracies or adjustments that are deemed not material.
CONTACTS
Investor Contact
Ben Lu
Media Contact
Audra Proctor
Gen
Gen
View original content to download multimedia:https://www.prnewswire.com/news-releases/gen-delivers-another-double-digit-growth-quarter-in-q2-fy27-and-raises-fy27-outlook-302922610.html
SOURCE Gen Digital Inc.


eBay Inc. Reports Third Quarter 2026 Results

KLA Corporation Reports Fiscal 2027 First Quarter Results

Gen Delivers Another Double-Digit Growth Quarter in Q2 FY27 and Raises FY27 Outlook

Send Rakhi to UK swiftly with UK Gifts Portal

Whiteboard Series with NEAR | Ep: 45 Joel Thorstensson from ceramic.network

Nullmax and Renesas Forge Strategic Partnership to Deliver Competitive ADAS Solutions for the Global Market

Why You Should Build on #NEAR – Co-founder Illia Polosukhin at CV Labs
Whiteboard Series with NEAR | Ep: 45 Joel Thorstensson from ceramic.network

NEAR End of Year Town Hall 2021: The Open Web World, MetaBUILD 2 Hackathon and 2021 recap
Trending
-

 Coin Market5 days ago
IRS plans lower tax disclosure penalties, including for crypto: Forbes
-

 Coin Market5 days ago
Wells Fargo and five others object to OKX-ICE tokenized stock listings: Report
-
 Technology5 days ago
Modern Wealth Law Founder John Wong Recognized for Over 10 Years as a State Bar of California Certified Specialist
-

 Technology5 days ago
Chelsea FC announces multi-year sleeve partnership with Sokin, the business payments and FX platform
-
 Technology5 days ago
STEPHEN A. SMITH ADDRESSES WHITE HOUSE DINNER ATTENDANCE, REAFFIRMS COMMITMENT TO HBCUs AND PROTECTING CORPORATE INVESTMENT IN BLACK EDUCATION
-

 Technology4 days ago
ST Engineering iDirect and MBSat Partner to Build Next-Generation Sovereign Connectivity Services Across Oman and the Middle East
-

 Technology4 days ago
ST Engineering iDirect and MBSat Partner to Build Next-Generation Sovereign Connectivity Services Across Oman and the Middle East
-

 Near Videos3 days ago
NEAR is building a universal liquidity layer.