
Technology
Gen Reports Third Quarter Fiscal Year 2025 Results

Published
2 years agoon
By
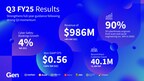
Company strengthens full-year guidance following strong Q3 momentum
TEMPE, Ariz. and PRAGUE, Jan. 30, 2025 /PRNewswire/ — Gen Digital Inc. (NASDAQ: GEN), a global leader dedicated to Powering Digital Freedom, released its results for the third quarter fiscal year 2025, which ended December 27, 2024.
“Sophisticated scams and financial fraud are everywhere. People need comprehensive solutions to address both the evolving threat landscape while also protecting their personal information,” said Vincent Pilette, CEO of Gen. “Millions of customers trust us to deliver practical solutions built with the best technology to address today’s challenges and anticipate tomorrow’s. We’re dedicated to building upon that trust to not only protect their data and assets, but to also help them manage and grow their digital and financial life.”
Q3 Fiscal Year 2025 Financial Highlights and Commentary Year-Over-Year
Q3 GAAP Results
Revenue of $986 million, up 4% in USDOperating income of $374 million, up 13%Operating margin of 38%, up 3 pointsQ3 diluted EPS of $0.26, up 18%Q3 operating cash flow of $326 million, up 3%
Q3 Non-GAAP Results
Revenue of $986 million, up 4% in USD and in constant currencyBookings of $1,036 million, up 3% in USD and in constant currencyOperating income of $577 million, up 4% in USD and in constant currencyOperating margin of 58.5%, in-line with the prior yearDiluted EPS of $0.56, up 15% in USD and in constant currency
“Our Q3 results highlight another quarter of solid execution, keeping us on track to achieve our 2025 plan and deliver long-term and profitable growth,” said Natalie Derse, CFO of Gen. “This quarter’s results are a testament to both the continued demand for comprehensive consumer Cyber Safety, and the dedication of the entire Gen team to deliver on those needs. By making strategic investments and maintaining disciplined execution, we are well-positioned to sustain this momentum and drive future success.”
Q4 FY25 Non-GAAP Guidance
Revenue expected to be in the range of $990 to $1,005 millionEPS expected to be in the range of $0.57 to $0.59
Strengthened Fiscal Year 2025 Non-GAAP Annual Guidance
Revenue now expected to be in the range of $3,915 to $3,930 million, compared to the prior range of $3,905 to $3,930 millionEPS now expected to be in the range of $2.20 to $2.22, compared to the prior range of $2.18 to $2.23
Quarterly Cash Dividend
Gen’s Board of Directors has approved a regular quarterly cash dividend of $0.125 per common share to be paid on March 12, 2025, to all shareholders of record as of the close of business on February 17, 2025.
Q3 FY25 Earnings Call
January 30, 2025
2 p.m. PT / 5 p.m. ET
Webcast & Dial-in instructions at Investor.GenDigital.com. A replay will be posted following the call. For additional details regarding Gen’s results and outlook, please see the Financials section of the Investor Relations website.
About Gen
Gen™ (NASDAQ: GEN) is a global company dedicated to powering Digital Freedom through its trusted Cyber Safety brands, Norton, Avast, LifeLock, Avira, AVG, ReputationDefender and CCleaner. The Gen family of consumer brands is rooted in providing safety for the first digital generations. Now, Gen empowers people to live their digital lives safely, privately, and confidently today and for generations to come. Gen brings award-winning products and services in cybersecurity, online privacy and identity protection to nearly 500 million users in more than 150 countries. Learn more at GenDigital.com.
Forward-Looking Statements
This press release contains statements which may be considered forward-looking within the meaning of the U.S. federal securities laws. In some cases, you can identify these forward-looking statements by the use of terms such as “expect,” “will,” “continue,” or similar expressions, and variations or negatives of these words, but the absence of these words does not mean that a statement is not forward-looking. All statements other than statements of historical fact are statements that could be deemed forward-looking statements, including, but not limited to, the quotes under “Q3 Non-GAAP Results” including expectations relating to achievement of long-term objectives, and the statements under “Q4 FY25 Non-GAAP Guidance” and “Fiscal Year 2025 Non-GAAP Annual Guidance” including expectations relating to Q4 FY25 and FY25 non-GAAP revenue and non-GAAP EPS, and any statements of assumptions underlying any of the foregoing. These statements are subject to known and unknown risks, uncertainties and other factors that may cause our actual results, levels of activity, performance or achievements to differ materially from results expressed or implied in this press release. Such risk factors include, but are not limited to, those related to: the consummation of or anticipated impacts of acquisitions (including our ability to achieve synergies and associated cost savings from the merger with Avast); divestitures, restructurings, stock repurchases, financings, debt repayments and investment activities; difficulties in executing the operating model for the consumer Cyber Safety business; lower than anticipated returns from our investments in direct customer acquisition; difficulties in retaining our existing customers and converting existing non-paying customers to paying customers; difficulties and delays in reducing run rate expenses and monetizing underutilized assets; the successful development of new products and upgrades and the degree to which these new products and upgrades gain market acceptance; our ability to maintain our customer and partner relationships; the anticipated growth of certain market segments; fluctuations and volatility in our stock price; our ability to successfully execute strategic plans; the vulnerability of our solutions, systems, websites and data to intentional disruption by third parties; changes to existing accounting pronouncements or taxation rules or practices; and general business and macroeconomic changes in the U.S. and worldwide, including economic recessions, the impact of inflation, fluctuations in foreign currency exchange rates, changes in interest rates or tax rates, and ongoing and new geopolitical conflicts. Additional information concerning these and other risk factors is contained in the Risk Factors sections of our most recent reports on Form 10-K and Form 10-Q. We encourage you to read those sections carefully. There may also be other factors that have not been anticipated or are not described in our periodic filings, generally because we did not believe them to be significant at the time, which could cause actual results to differ materially from our projections and expectations. All forward-looking statements should be evaluated with the understanding of their inherent uncertainty. We assume no obligation, and do not intend, to update these forward-looking statements as a result of future events or developments.
Use of Non-GAAP Financial Information
We use non-GAAP measures of operating margin, operating income, net income and earnings per share, which are adjusted from results based on GAAP and exclude certain expenses, gains and losses. We also provide the non-GAAP metrics of revenues, and constant currency revenues. These non-GAAP financial measures are provided to enhance the user’s understanding of our past financial performance and our prospects for the future. Our management team uses these non-GAAP financial measures in assessing Gen’s performance, as well as in planning and forecasting future periods. These non-GAAP financial measures are not computed according to GAAP and the methods we use to compute them may differ from the methods used by other companies. Non-GAAP financial measures are supplemental, should not be considered a substitute for financial information presented in accordance with GAAP and should be read only in conjunction with our condensed consolidated financial statements prepared in accordance with GAAP. Readers are encouraged to review the reconciliation of our non-GAAP financial measures to the comparable GAAP results, which is attached to our quarterly earnings release, and which can be found, along with other financial information including the Earnings Presentation, on the investor relations page of our website at Investor.GenDigital.com. No reconciliation of the forecasted range for non-GAAP revenues and EPS guidance is included in this release because most non-GAAP adjustments pertain to events that have not yet occurred. It would be unreasonably burdensome to forecast, therefore we are unable to provide an accurate estimate.
GEN DIGITAL INC.
Condensed Consolidated Balance Sheets (1)
(Unaudited, in millions)
December 27,
2024
March 29, 2024
ASSETS
Current assets:
Cash and cash equivalents
$ 883
$ 846
Accounts receivable, net
152
163
Other current assets
262
334
Assets held for sale
23
15
Total current assets
1,320
1,358
Property and equipment, net
61
72
Intangible assets, net
2,336
2,638
Goodwill
10,171
10,210
Other long-term assets
1,475
1,515
Total assets
$ 15,363
$ 15,793
LIABILITIES AND STOCKHOLDERS’ EQUITY (DEFICIT)
Current liabilities:
Accounts payable
$ 102
$ 66
Accrued compensation and benefits
93
78
Current portion of long-term debt
1,396
175
Contract liabilities
1,777
1,808
Other current liabilities
396
599
Total current liabilities
3,764
2,726
Long-term debt
7,080
8,429
Long-term contract liabilities
72
76
Deferred income tax liabilities
223
261
Long-term income taxes payable
1,385
1,490
Other long-term liabilities
688
671
Total liabilities
13,212
13,653
Total stockholders’ equity (deficit)
2,151
2,140
Total liabilities and stockholders’ equity
$ 15,363
$ 15,793
_______________
(1)
During the first quarter of fiscal year 2025, we identified and made a revision to our historical practice of when we recognize revenue from certain customers. We concluded that the impact of the revision was an immaterial correction to prior period financial statements. However, for comparative purposes we have corrected for this in prior periods reported above.
GEN DIGITAL INC.
Condensed Consolidated Statements of Operations (1)
(Unaudited, in millions, except per share amounts)
Three Months Ended
Nine Months Ended
December 27,
2024
December 29,
2023
December 27,
2024
December 29,
2023
Net revenues
$ 986
$ 948
$ 2,925
$ 2,836
Cost of revenues
193
182
577
541
Gross profit
793
766
2,348
2,295
Operating expenses:
Sales and marketing
182
184
549
552
Research and development
84
77
248
252
General and administrative
108
110
224
559
Amortization of intangible assets
43
61
130
183
Restructuring and other costs
2
2
4
36
Total operating expenses
419
434
1,155
1,582
Operating income (loss)
374
332
1,193
713
Interest expense
(141)
(165)
(443)
(508)
Other income (expense), net
(25)
11
(8)
30
Income (loss) before income taxes
208
178
742
235
Income tax expense (benefit)
49
36
241
(241)
Net income (loss)
$ 159
$ 142
$ 501
$ 476
Net income (loss) per share – basic
$ 0.26
$ 0.22
$ 0.81
$ 0.74
Net income (loss) per share – diluted
$ 0.26
$ 0.22
$ 0.80
$ 0.74
Weighted-average shares outstanding:
Basic
616
639
618
640
Diluted
623
645
624
644
_______________
(1)
During the first quarter of fiscal year 2025, we identified and made a revision to our historical practice of when we recognize revenue from certain customers. We concluded that the impact of the revision was an immaterial correction to prior period financial statements. However, for comparative purposes we have corrected for this in prior periods reported above.
GEN DIGITAL INC.
Condensed Consolidated Statements of Cash Flows (1)
(Unaudited, in millions)
Three Months Ended
Nine Months Ended
December 27,
2024
December 29,
2023
December 27,
2024
December 29,
2023
OPERATING ACTIVITIES:
Net income (loss)
$ 159
$ 142
$ 501
$ 476
Adjustments:
Amortization and depreciation
104
124
315
374
Impairments and write-offs of current and long-lived assets
(1)
(1)
2
(1)
Stock-based compensation expense
33
35
97
107
Deferred income taxes
(13)
6
(50)
(970)
Gain on sale of property
—
(5)
—
(9)
Non-cash operating lease expense
4
4
11
15
Impairment on non-marketable equity investments
30
—
30
—
Legal contract dispute cost
42
—
42
—
Other
(12)
8
(4)
25
Changes in operating assets and liabilities, net of acquisitions:
Accounts receivable, net
(36)
(9)
(34)
7
Accounts payable
6
(3)
35
(18)
Accrued compensation and benefits
21
3
16
(38)
Contract liabilities
44
62
(27)
(31)
Income taxes payable
33
(76)
(136)
341
Other assets
11
(22)
75
(45)
Other liabilities
(99)
47
(125)
433
Net cash provided by (used in) operating activities
326
315
748
666
INVESTING ACTIVITIES:
Purchases of property and equipment
(8)
(8)
(12)
(17)
Purchase of non-marketable equity investments
—
—
(4)
—
Proceeds from the sale of property
—
12
—
25
Other
1
(3)
(1)
(4)
Net cash provided by (used in) investing activities
(7)
1
(17)
4
FINANCING ACTIVITIES:
Repayments of debt
(59)
(259)
(147)
(525)
Net proceeds from sales of common stock under employee stock incentive plans
—
—
6
6
Tax payments related to vesting of stock units
—
(5)
(25)
(25)
Dividends and dividend equivalents paid
(77)
(81)
(236)
(245)
Repurchases of common stock
—
(100)
(272)
(141)
Net cash provided by (used in) financing activities
(136)
(445)
(674)
(930)
Effect of exchange rate fluctuations on cash and cash equivalents
(37)
(10)
(20)
—
Change in cash and cash equivalents
146
(139)
37
(260)
Beginning cash and cash equivalents
737
629
846
750
Ending cash and cash equivalents
$ 883
$ 490
$ 883
$ 490
_______________
(1)
During the first quarter of fiscal year 2025, we identified and made a revision to our historical practice of when we recognize revenue from certain customers. We concluded that the impact of the revision was an immaterial correction to prior period financial statements. However, for comparative purposes we have corrected for this in prior periods reported above.
GEN DIGITAL INC.
Reconciliation of Selected GAAP Measures to Non-GAAP Measures (1) (2) (3)
(Unaudited, in millions, except per share amounts)
Three Months Ended
December 27,
2024
December 29,
2023
Operating income (loss)
$ 374
$ 332
Stock-based compensation
33
35
Amortization of intangible assets
99
118
Restructuring and other costs
2
2
Acquisition and integration costs
6
8
Litigation costs
21
60
Legal contract dispute cost
42
—
Operating income (loss) (Non-GAAP)
$ 577
$ 555
Operating margin
37.9 %
35.0 %
Operating margin (Non-GAAP)
58.5 %
58.5 %
Net income (loss)
$ 159
$ 142
Adjustments to net income (loss):
Stock-based compensation
33
35
Amortization of intangible assets
99
118
Restructuring and other costs
2
2
Acquisition and integration costs
6
8
Litigation costs
21
60
Legal contract dispute cost
42
—
Other
1
1
Non-cash interest expense
7
7
Loss (gain) on equity investments
30
—
Loss (gain) on sale of properties
—
(5)
Total adjustments to GAAP income (loss) before income taxes
241
226
Adjustment to GAAP provision for income taxes
(50)
(53)
Total adjustment to income (loss), net of taxes
191
173
Net income (loss) (Non-GAAP)
$ 350
$ 315
Diluted net income (loss) per share
$ 0.26
$ 0.22
Adjustments to diluted net income (loss) per share:
Stock-based compensation
0.05
0.05
Amortization of intangible assets
0.16
0.18
Restructuring and other costs
0.00
0.00
Acquisition and integration costs
0.01
0.01
Litigation costs
0.03
0.09
Legal contract dispute cost
0.07
0.00
Other
0.00
0.00
Non-cash interest expense
0.01
0.01
Loss (gain) on equity investments
0.05
0.00
Loss (gain) on sale of properties
—
(0.01)
Total adjustments to GAAP income (loss) before income taxes
0.39
0.35
Adjustment to GAAP provision for income taxes
(0.08)
(0.08)
Total adjustment to income (loss), net of taxes
0.31
0.27
Diluted net income (loss) per share (Non-GAAP)
$ 0.56
$ 0.49
Diluted weighted-average shares outstanding
623
645
Diluted weighted-average shares outstanding (Non-GAAP)
623
645
_______________
(1)
This presentation includes non-GAAP measures. Non-GAAP financial measures are supplemental and should not be considered a substitute for financial information presented in accordance with GAAP. For a detailed explanation of these non-GAAP measures, see Appendix A.
(2)
Amounts may not add due to rounding.
(3)
During the first quarter of fiscal year 2025, we identified and made a revision to our historical practice of when we recognize revenue from certain customers. We concluded that the impact of the revision was an immaterial correction to prior period financial statements. However, for comparative purposes we have corrected for this in prior periods reported above.
GEN DIGITAL INC.
Constant Currency Adjusted Revenues and Cyber Safety Metrics (1)
(Unaudited, in millions, except per user data)
Constant Currency Adjusted Revenues (Non-GAAP)
Three Months Ended
December 27,
2024
December 29,
2023
Variance in %
Revenues
$ 986
$ 948
4 %
Exclude foreign exchange impact (2)
1
—
Constant currency adjusted revenues (Non-GAAP)
$ 987
$ 948
4 %
Cyber Safety Metrics
Three Months Ended
December 27,
2024
December 29,
2023
Direct customer revenues
$ 869
$ 834
Partner revenues
$ 105
$ 99
Total Cyber Safety revenues
$ 974
$ 933
Legacy revenues (3)
$ 12
$ 15
Direct customer count (at quarter end)
40.1
38.9
Direct average revenue per user (ARPU)
$ 7.27
$ 7.18
Retention rate
78 %
77 %
_______________
(1)
During the first quarter of fiscal year 2025, we identified and made a revision to our historical practice of when we recognize revenue from certain customers. We concluded that the impact of the revision was an immaterial correction to prior period financial statements. However, for comparative purposes we have corrected for this in prior periods reported above.
(2)
Calculated using year ago foreign exchange rates.
(3)
Legacy revenues includes revenues from products or solutions from markets that we have exited and in which we no longer operate, have been discontinued or identified to be discontinued, or remain in maintenance mode as a result of integration and product portfolio decisions.
GEN DIGITAL INC.
Appendix A
Explanation of Non-GAAP Measures and Other Items
Objective of non-GAAP measures: We believe our presentation of non-GAAP financial measures, when taken together with corresponding GAAP financial measures, provides meaningful supplemental information regarding the Company’s operating performance for the reasons discussed below. Our management team uses these non-GAAP financial measures in assessing our performance, as well as in planning and forecasting future periods. Due to the importance of these measures in managing the business, we use non-GAAP measures in the evaluation of management’s compensation. These non-GAAP financial measures are not computed according to GAAP and the methods we use to compute them may differ from the methods used by other companies. Non-GAAP financial measures are supplemental and should not be considered a substitute for financial information presented in accordance with GAAP and should be read only in conjunction with our consolidated financial statements prepared in accordance with GAAP.
Stock-based compensation: This consists of expenses for employee restricted stock units, performance-based awards, stock options and our employee stock purchase plan, determined in accordance with GAAP. We evaluate our performance both with and without these measures because stock-based compensation is a non-cash expense and can vary significantly over time based on the timing, size, nature and design of the awards granted, and is influenced in part by certain factors that are generally beyond our control, such as the volatility of the market value of our common stock. In addition, for comparability purposes, we believe it is useful to provide a non-GAAP financial measure that excludes stock-based compensation to facilitate the comparison of our results to those of other companies in our industry.
Amortization of intangible assets: Amortization of intangible assets consists of amortization of acquisition-related intangibles assets such as developed technology, customer relationships and trade names acquired in connection with business combinations. We record charges relating to the amortization of these intangibles within both cost of revenues and operating expenses in our GAAP financial statements. Under purchase accounting, we are required to allocate a portion of the purchase price to intangible assets acquired and amortize this amount over the estimated useful lives of the acquired intangible assets. However, the purchase price allocated to these assets is not necessarily reflective of the cost we would incur to internally develop the intangible asset. Further, amortization charges for our acquired intangible assets are inconsistent in size and are significantly impacted by the timing and valuation of our acquisitions. We eliminate these charges from our non-GAAP operating results to facilitate an evaluation of our current operating performance and provide better comparability to our past operating performance.
Restructuring and other costs: Restructuring charges are costs associated with a formal restructuring plan and are primarily related to employee severance and benefit arrangements, contract termination costs, and assets write-offs, as well as other exit and disposal costs. Included in other exit and disposal costs are costs to exit and consolidate facilities in connection with restructuring events. We exclude restructuring and other costs from our non-GAAP results as we believe that these costs are incremental to core activities that arise in the ordinary course of our business and do not reflect our current operating performance, and that excluding these charges facilitates a more meaningful evaluation of our current operating performance and comparisons to our past operating performance.
Acquisition-related and integration costs: These represent the transaction and business integration costs related to significant acquisitions that are charged to operating expense in our GAAP financial statements. These costs include incremental expenses incurred to affect these business combinations such as advisory, legal, accounting, valuation, and other professional or consulting fees. We exclude these costs from our non-GAAP results as they have no direct correlation to the operation of our business, and because we believe that the non-GAAP financial measures excluding these costs provide meaningful supplemental information regarding the spending trends of our business. In addition, these costs vary, depending on the size and complexity of the acquisitions, and are not indicative of costs of future acquisitions.
Litigation costs: We may periodically incur charges or benefits related to litigation settlements, legal contingency accruals and third-party legal costs related to certain legal matters. We exclude these charges and benefits when associated with a significant matter because we do not believe they are reflective of ongoing business and operating results.
Legal contract dispute cost: During fiscal 2025, we incurred charges in connection with an e-commerce partner settlement. In order to resolve all open disputes with the partner, we entered into a legal settlement agreement which included our release of claims to valid outstanding accounts receivable totaling $66 million. In the third quarter of fiscal 2025, $42 million of accounts receivable existing as of December 27, 2024, has been charged off as G&A expense with the remaining $24 million to be charged off in in fourth quarter of fiscal 2025. We exclude these charges and benefits when associated with a significant matter because we do not believe they are normal, recurring, or reflective of ongoing business and operating results.
Non-cash interest expense and amortization of debt issuance costs: In accordance with GAAP, we separately account for the value of the conversion feature on our convertible notes as a debt discount that reflects our assumed non-convertible debt borrowing rates. We amortize the discount and debt issuance costs over the term of the related debt. We exclude the difference between the imputed interest expense, which includes the amortization of the conversion feature and of the issuance costs, and the coupon interest payments. We extinguished our remaining convertible debt on August 15, 2022. During fiscal 2023, we also started amortizing the debt issuance costs associated with our senior credit facilities, which were secured upon close of the acquisition of Avast. We believe that excluding these costs provides meaningful supplemental information regarding the cash cost of our debt instruments and enhance investors’ ability to view the Company’s results from management’s perspective.
Gain (loss) on extinguishment of debt: We record gains or losses on extinguishment of debt. Gains or losses represent the difference between the fair value of the exchange consideration and the carrying value of the liability component of the debt at the date of extinguishment. We exclude the gain or loss on debt extinguishment in our non-GAAP results because they are not reflective of our ongoing business.
Gain (loss) on equity investments: We record gains or losses, unrealized and realized, on equity investments in privately-held companies. We exclude the net gains or losses because we do not believe they are reflective of our ongoing business.
Gain (loss) on sale of properties: We periodically recognize gains or losses from the disposition of land and buildings. We exclude such gains or losses because they are not reflective of our ongoing business and operating results.
Income tax effects and adjustments: We use a non-GAAP tax rate that excludes (1) the discrete impacts of changes in tax legislation, (2) most other significant discrete items, (3) unrealized gains or losses from remeasurement of foreign currency denominated deferred tax items and uncertain tax benefits, and (4) the income tax effects of the non-GAAP adjustment to our operating results described above. We believe making these adjustments facilitates a better evaluation of our current operating performance and comparisons to past operating results. Our tax rate is subject to change for a variety of reasons, such as significant changes in the geographic earnings mix due to acquisition and divestiture activities or fundamental tax law changes in major jurisdictions where we operate.
Diluted GAAP and non-GAAP weighted-average shares outstanding: Diluted GAAP and non-GAAP weighted-average shares outstanding are generally the same, except in periods when there is a GAAP loss from continuing operations. In accordance with GAAP, we do not present dilution for GAAP in periods in which there is a loss from continuing operations. However, if there is non-GAAP net income, we present dilution for non-GAAP weighted-average shares outstanding in an amount equal to the dilution that would have been presented had there been GAAP income from continuing operations for the period.
Bookings: Bookings are defined as customer orders received that are expected to generate net revenues in the future. We present the operational metric of bookings because it reflects customers’ demand for our products and services and to assist readers in analyzing our performance in future periods.
Free cash flow: Free cash flow is defined as cash flows from operating activities less purchases of property and equipment. Free cash flow is not a measure of financial condition under GAAP and does not reflect our future contractual commitments and the total increase or decrease of our cash balance for a given period, and thus should not be considered as an alternative to cash flows from operating activities or as a measure of liquidity.
(Unlevered) Free cash flow: Free cash flow is defined as cash flows from operating activities less purchases of property and equipment. Unlevered free cash flow excludes cash interest expense payments. Free cash flow is not a measure of financial condition under GAAP and does not reflect our future contractual commitments and the total increase or decrease of our cash balance for a given period, and thus should not be considered as an alternative to cash flows from operating activities or as a measure of liquidity.
Constant currency adjusted revenues (Non-GAAP): Non-GAAP constant currency adjusted revenues are defined as revenues adjusted for the fair value of acquired contract liabilities and foreign exchange impact, calculated by translating current period revenue using the year ago currency conversion rate.
Direct customer count: Direct customers is a metric designed to represent active paid users of our products and solutions who have a direct billing and/or registration relationship with us at the end of the reported period. Average direct customer count presents the average of the total number of direct customers at the beginning and end of the applicable period. We exclude users on free trials from our direct customer count. Users who have indirectly purchased and/or registered for our products or solutions through partners are excluded unless such users convert or renew their subscription directly with us or sign up for a paid membership through our web stores or third-party app stores. While these numbers are based on what we believe to be reasonable estimates of our user base for the applicable period of measurement, there are inherent challenges in measuring usage of our products and solutions across brands, platforms, regions, and internal systems, and therefore, calculation methodologies may differ. The methodologies used to measure these metrics require judgment and are also susceptible to algorithms or other technical errors. We continually seek to improve our estimates of our user base, and these estimates are subject to change due to improvements or revisions to our methodology. From time to time, we review our metrics and may discover inaccuracies or make adjustments to improve their accuracy, which can result in adjustments to our historical metrics. Our ability to recalculate our historical metrics may be impacted by data limitations or other factors that require us to apply different methodologies for such adjustments. We generally do not intend to update previously disclosed metrics for any such inaccuracies or adjustments that are deemed not material.
Direct average revenues per user (ARPU): ARPU is calculated as estimated direct customer revenues for the period divided by the average direct customer count for the same period, expressed as a monthly figure. We monitor ARPU because it helps us understand the rate at which we are monetizing our consumer customer base.
Retention rate: Retention rate is defined as the percentage of direct customers as of the end of the period from one year ago who are still active as of the most recently completed fiscal period. We monitor the retention rate to evaluate the effectiveness of our strategies to improve renewals of subscriptions.
Investor Contact
Jason Starr
Media Contact
Audra Proctor
Gen
Gen
View original content to download multimedia:https://www.prnewswire.com/news-releases/gen-reports-third-quarter-fiscal-year-2025-results-302364813.html
SOURCE Gen Digital Inc.

You may like
Technology
Teradata Introduces New Privacy, Security, and Resiliency Capabilities as AI Forces Change in Enterprise Data Protection
Published
22 minutes agoon
October 20, 2026By

New capabilities protect the sensitive data and intelligence behind enterprise AI while keeping mission-critical operations available and recoverable
SAN DIEGO, Oct. 20, 2026 /PRNewswire/ — Teradata (NYSE: TDC) today announced new privacy, security, and resiliency capabilities designed to address one of the defining challenges of enterprise AI: how sensitive data is protected, who and what can access it, and whether it remains available and recoverable when something goes wrong. Teradata addresses all three through an integrated approach that reduces raw identity exposure, enforces protection closer to the data, and keeps the intelligence powering AI available and recoverable. In practice, that means protecting the intelligence behind AI without diminishing what makes it valuable.
Key Capabilities
Poly-Anonymization®: reduces raw identity exposure while preserving the relationships and utility AI and analytics requireFormat-preserving encryption: protects sensitive values without changing their format or breaking downstream systemsPost-quantum security and readiness: strengthens protection against emerging quantum-era threats through Anonomatic PII Vault® and TLS 1.3 hybrid-key exchange for data in transitImmutable backup protection: prevents recovery points from being modified or deleted, strengthening cyber-recovery readinessDatabase-level high availability: an additional availability layer for mission-critical workloads, distinct from disaster recovery
Why It Matters Now
As AI becomes mission-critical, it expands both the value and the vulnerability of enterprise data. Sensitive information now moves among users, applications, models, and agents, making it harder to secure at the boundary alone. AI is designed to combine disparate information to find patterns and make decisions, which means data that isn’t individually identifiable can become so when AI brings it together.
Executive Quote
“Privacy, security, and resiliency have historically been treated as separate problems with separate solutions. That approach doesn’t hold up when AI is moving sensitive data across users, applications, models, and agents simultaneously. This announcement reflects how we think those capabilities need to work together, and it’s the foundation for how we intend to extend that protection as AI environments grow more complex and the actors operating within them multiply.”
-Sumeet Arora, Chief Product Officer, Teradata
Privacy Protection
Access control determines who can see sensitive data. Identity reduction changes how much identifying information needs to be present in the analytical environment in the first place. Teradata combines both, through an OEM partnership with Anonomatic, whose privacy capabilities are natively available to Teradata customers.
Poly-Anonymization replaces PII fields with a stable identifier while holding underlying identity separately within Anonomatic PII Vault, a post-quantum-secure environment built with multiple layers of overlapping security controls designed to protect sensitive identity information. Authorized users can restore identity when a legitimate use case requires it, but everyone else works with data that retains its analytical structure, its relationships, and its utility. The result is an analytical environment where sensitive data can be used for AI, analytics, testing, and approved collaboration without broadly exposing who the data is about.
Unlike approaches that rely solely on mathematically reversible encryption, PII Vault combines identity separation, Poly-Anonymization, access controls, and additional layered protections to reduce identity exposure while retaining the utility required for AI and analytics. Format-preserving encryption extends that protection to situations where a value’s structure matters to downstream systems, protecting sensitive data without breaking the applications and workflows built around it.
Testing at large scale demonstrated that Teradata’s Anonomatic-powered privacy-preserving controls can support enterprise analytical workloads without the performance tradeoffs organizations typically associate with data privacy. Multi-table join queries on protected data used fewer Teradata resources than equivalent queries on unprotected data, though results will vary by workload and configuration.
Partner Quote
“Enterprise AI creates a fundamentally different privacy challenge. Organizations need to use sensitive, individual-level data to build effective AI, but the traditional tools for protecting that data weren’t designed to preserve what AI needs to work. Our partnership with Teradata makes it possible to reduce identity exposure at enterprise scale without forcing organizations to choose between protection and utility.”
-Matt Fleck, Founder and CEO at Anonomatic, a data security software company focused on making PII data privacy secure, simple and cost effective
Native Data Security
Protection that follows the data requires controls enforced at the data layer, not just at the systems surrounding it. Teradata applies classification, policy enforcement, and access controls closer to the data itself. Together, these capabilities provide a governance-led foundation for protecting data and intelligence across users, applications, and workloads.
For data in transit, Teradata introduces post-quantum protection via TLS 1.3 hybrid-key exchange, which combines classical and post-quantum cryptographic algorithms in a single handshake. As quantum computing advances make current encryption standards increasingly vulnerable, organizations that establish cryptographic readiness now will be better positioned for what’s ahead.
New native capabilities including dynamic data masking, data classification and tagging, column-level encryption, and global identity extend that protection across the data layer. Through a partnership with Immuta, a data authorization platform between identity and enterprise data, dynamic ABAC brings identity-aware, attribute-driven access control that enforces policy consistently across users and AI workloads without duplicating data or rewriting governance rules.
Teradata’s security architecture is designed to extend as AI environments evolve, with ongoing investment in controls that govern how AI agents access and act on enterprise data within policy boundaries.
Enterprise Data Protection
For enterprises running AI at scale, a cyberattack is a threat to the data, context, and operational knowledge that AI depends on to function. Teradata Enterprise Data Protection addresses that reality through a workload-aligned approach that lets organizations match protection levels to business criticality rather than applying the same resiliency architecture to every workload. The objective is not simply to restore data, but to restore the trusted context AI needs to resume mission-critical operations.
Database-level high availability via real-time replication introduces an additional availability layer designed for continuous synchronization and low recovery objectives.
Immutable backup protection strengthens cyber-recovery readiness by ensuring recovery points cannot be modified, encrypted, or deleted, even by privileged administrators. As ransomware increasingly targets backup data specifically, protected recovery points have become as critical as the protection strategies built around them. Teradata’s resiliency architecture is designed to extend as cyber threats and recovery requirements evolve.
Additional capabilities including backup and recovery, scheduled data synchronization, and disaster recovery round out a more consistent Enterprise Data Protection experience.
Availability
Privacy capabilities, powered by Anonomatic and delivered by Teradata, are available now for Teradata Cloud on AWS, Azure, and Google Cloud.Native data security capabilities including dynamic data masking, data classification and tagging, and column-level encryption are available on Teradata Cloud across AWS, Azure, and Google Cloud. Dynamic data masking, data classification and tagging are available for Teradata Factory and on-premises deployment options.Teradata Enterprise Data Protection including immutable backup protection is available now on Teradata Cloud across AWS, Azure, and Google Cloud with availability on Teradata Customer Cloud planned in the coming months.
About Teradata
Teradata empowers enterprises to turn intelligence into autonomous action, grounding AI agents in deep business context and trusted data. As AI agents multiply, Teradata is the context foundation, governance layer, and performance backbone that companies need now. The Teradata Autonomous Knowledge Platform puts AI into production across cloud, on-premises, and hybrid environments.
Forward-Looking Statements
This press release contains “forward-looking statements” about the expectations, beliefs, plans, and intentions relating to Teradata’s privacy, security, and resiliency capabilities. Such statements include statements regarding future product availability, capabilities, and offerings, and expected benefits to Teradata customers. Forward-looking statements are subject to known and unknown risks and uncertainties and are based on potentially inaccurate assumptions that could cause actual results to differ materially from those expected or implied by the forward-looking statements. If any such risks or uncertainties materialize or if any of the assumptions prove incorrect, Teradata’s results could differ materially from the results expressed or implied by the forward-looking statements made. Teradata undertakes no obligation, and does not intend to update the forward-looking statements. Factors that may cause actual results to differ materially from those in any forward-looking statements include: (i) delays and unexpected difficulties and expenses in executing the planned product capabilities and offerings, (ii) changes in the regulatory landscape related to AI and (iii) uncertainty as to whether customer adoption will justify the investments in the product capabilities and offerings. Further information on factors that could affect Teradata’s financial and other results is included in the filings Teradata makes with the Securities and Exchange Commission from time to time.
The Teradata logo is a trademark, and Teradata is a registered trademark of Teradata Corporation and/or its affiliates in the U.S. and worldwide.
Poly-Anonymization and PII Vault are registered trademarks of Anonomatic, Inc.
MEDIA CONTACT
Jennifer Donahue
Jennifer.Donahue@Teradata.com
View original content:https://www.prnewswire.com/news-releases/teradata-introduces-new-privacy-security-and-resiliency-capabilities-as-ai-forces-change-in-enterprise-data-protection-302913579.html
SOURCE Teradata
Technology
Teradata Expands Sovereign AI Across On-Premises and Air-Gapped Cloud Environments
Published
23 minutes agoon
October 20, 2026By

New Teradata Factory and Teradata Sovereign Cloud on Google Distributed Cloud capabilities give enterprises greater control over where their most sensitive data and AI operate
SAN DIEGO, Oct. 20, 2026 /PRNewswire/ — Teradata (NYSE: TDC) today announced a portfolio of deployment and platform capabilities designed to give governments and enterprises greater control over the data, AI, and technology that power their most critical operations. This includes expanded capabilities for Teradata Factory with AI Studio and the availability of Teradata Sovereign Cloud on Google Distributed Cloud air-gapped environment.
What’s New
Teradata’s portfolio spans two complementary deployment models designed to address different sovereignty requirements.
The expanded capabilities for Teradata Factory with AI Studio bring a unified AI environment to operate on data, vectors, models, and agents directly into customer-controlled on-premises infrastructure. These capabilities include:
Tera, the agentic coworker for enterprise data work, including Tera Harness and Tera Context EngineAgentStack, the complete AI agent development capabilities to build, manage, observe and operate agents through natural language, pro-code, low-code, and Model Context Protocol (MCP) interfacesModel services, which provide machine learning operations and AI model management with pre-integrated model and bring-your-own-model supportData pipelines for ingesting multimodal unstructured data, vector embeddings, vector storage and hybrid search for RAGAnalytics, native notebooks backed by in-database analytics and Teradata’s Elastic Python Compute, built on Ray and Arrow, bring AI to where data lives
Teradata Sovereign Cloud on Google Distributed Cloud air-gapped brings Teradata’s high-performance enterprise-scale analytics into fully isolated environments. Key benefits of running Teradata Sovereign Cloud on Google Distributed Cloud air-gapped include:
Full isolation: Deploy Teradata in an air-gapped environment with no external connectivity— keeping classified and regulated data fully containedSecurity and compliance: Meet stringent regulatory requirements while maintaining complete audit trails and governanceHigh-performance analytics and AI at scale: Run complex queries across billions of rows and petabytes of data with predictable performance
Why it Matters
Research points to growing urgency. According to a 2026 BARC global study of 320 business and IT decision-makers, 62 percent of organizations cite data and AI in core business processes as a key driver of sovereignty requirements. A separate IBM study found that 91 percent of executives say they do not fully understand their organization’s dependencies across AI vendors, models and infrastructure. And Gartner predicts that by 2030, more than 75 percent of enterprises outside the United States will have a digital sovereignty strategy, supported by a sovereign cloud strategy.
As AI moves into mission-critical operations, sovereignty is no longer only about where data resides. Organizations must also consider where AI runs, which models are used, how enterprise information is accessed, who operates the environment, and which external technologies their AI depends on.
This is particularly relevant for governments, defense organizations, regulated industries and critical infrastructure, where data residency, privacy, jurisdiction, operational continuity or national-security requirements can limit the use of traditional public-cloud AI services.
Teradata frames sovereignty across three dimensions: data sovereignty (where data lives and who can access it), operational sovereignty (who controls the environment and whether it can operate independently), and digital sovereignty (which technologies and AI models the organization depends on). An organization can satisfy data residency requirements and still lack full sovereignty if AI processing occurs externally, external administrators can access the environment, or operations stop when public connectivity is unavailable.
Teradata’s sovereign portfolio is designed to address these requirements, bringing enterprise analytics and AI inside the boundaries that organizations control.
The Deployment Portfolio
Teradata Factory and Teradata Sovereign Cloud on Google Distributed Cloud air-gapped address different sovereignty requirements.
Teradata Factory is an integrated hardware and software rack that brings a private enterprise data and AI environment into customer-controlled on-premises infrastructure. It is designed for organizations that require direct physical control over their infrastructure and AI execution.
Teradata Sovereign Cloud on Google Distributed Cloud air-gapped provides a cloud operating model inside a sovereign boundary. The environment has no connection to the public internet and is operated by the customer. It is designed for organizations that need the operational model of cloud within a fully isolated, sovereign environment. Teradata provides the enterprise analytics layer within the air-gapped boundary, enabling organizations to support use cases such as operational reporting, mission analysis, intelligence fusion, training and simulation analytics, and defense logistics and sustainment inside the sovereign boundary.
Together, Teradata Factory and Teradata Sovereign Cloud on Google Distributed Cloud air-gapped support a hybrid approach to sovereign deployment, giving organizations the flexibility to run enterprise analytics and AI inside whichever boundary their requirements demand.
Executive Perspectives
“As AI becomes embedded in mission-critical decisions, organizations can no longer treat sovereignty as a data-location requirement. They need control over where AI runs, which models are used, who can operate the environment, and whether critical workloads can continue if external connectivity disappears. And increasingly, sovereignty is not a single location. It is an architecture that spans public cloud, sovereign cloud, and on-premises infrastructure. Teradata is uniquely built for that reality. We can run in all of those environments, connect them through Teradata Fabric without requiring data to move, and give organizations the freedom to choose the AI models and infrastructure that work for them.”
— Sumeet Arora, Chief Product Officer, Teradata
“Google Distributed Cloud is purpose-built, air-gapped infrastructure that delivers complete technical, operational and software sovereignty. By combining Google Distributed Cloud’s sovereign infrastructure with Teradata’s AI and knowledge capabilities, we are giving enterprise customers in regulated industries the ability to innovate without sacrificing control over their data.”
— Muninder Singh Sambi, VP of Product Management, Google Distributed Cloud
Availability
The expanded Teradata sovereign capabilities for Teradata Factory with AI Studio will be available in Q1 2027. Teradata Sovereign Cloud on Google Distributed Cloud air-gapped is available in Private Preview.
About Teradata
Teradata empowers enterprises to turn intelligence into autonomous action, grounding AI agents in deep business context and trusted data. As AI agents multiply, Teradata is the context foundation, governance layer, and performance backbone that companies need now. The Teradata Autonomous Knowledge Platform puts AI into production across cloud, on-premises, and hybrid environments.
Teradata Forward-Looking Statements
This press release contains “forward-looking statements” about the expectations, beliefs, plans, and intentions relating to Teradata’s sovereign portfolio. Such statements include statements regarding future product availability, capabilities, and offerings, and expected benefits to Teradata customers. Forward-looking statements are subject to known and unknown risks and uncertainties and are based on potentially inaccurate assumptions that could cause actual results to differ materially from those expected or implied by the forward-looking statements. If any such risks or uncertainties materialize or if any of the assumptions prove incorrect, Teradata’s results could differ materially from the results expressed or implied by the forward-looking statements made. Teradata undertakes no obligation, and does not intend to update the forward-looking statements. Factors that may cause actual results to differ materially from those in any forward-looking statements include: (i) delays and unexpected difficulties and expenses in executing the planned product capabilities and offerings, (ii) changes in the regulatory landscape related to AI and (iii) uncertainty as to whether customer adoption will justify the investments in the product capabilities and offerings. Further information on factors that could affect Teradata’s financial and other results is included in the filings Teradata makes with the Securities and Exchange Commission from time to time.
The Teradata logo is a trademark, and Teradata is a registered trademark of Teradata Corporation and/or its affiliates in the U.S. and worldwide.
MEDIA CONTACT
January Machold
January.Machold@Teradata.com
View original content:https://www.prnewswire.com/news-releases/teradata-expands-sovereign-ai-across-on-premises-and-air-gapped-cloud-environments-302913587.html
SOURCE Teradata Corporation
Technology
State Farm® and MIT AgeLab Collaborate to Study What’s Driving Distraction Behind the Wheel
Published
23 minutes agoon
October 20, 2026By

Drivefulness™ research explores the human side of a nearly $100 billion roadway risk
BLOOMINGTON, Ill., Oct. 20, 2026 /PRNewswire/ — As vehicles become more connected and technology-enabled, the challenge of distracted driving is becoming more complex across the country. The question is no longer simply what distracts drivers, but understanding why people make certain choices behind the wheel and how technology may influence those decisions.
State Farm® and the MIT AgeLab are exploring those questions through a research initiative examining driver attention, distraction, and the behaviors that influence decision-making behind the wheel. Researchers have coined the term “drivefulness” to describe a state in which a driver is safe, aware, appropriately engaged, and ready to respond to the road, while being supported in having the best possible driving experience for them.
The study brings together State Farm’s decades of experience understanding crash risk, driver behavior, and the real-world consequences of distraction with MIT AWARE initiative’s multidisciplinary research expertise in transportation safety, human factors, behavioral science, and how people interact with technology.
Distracted driving carries significant human and economic consequences. According to U.S. Department of Transportation research, distraction was involved in 29% of motor vehicle crashes studied, contributing to more than 10,000 deaths, 1.3 million injuries, and an estimated $98.2 billion in economic costs.
Understanding the relationship among driver attention, distraction, and behaviors could help inform how automakers, organizations, regulators, and insurers approach roadway safety, risk prevention, and the design of future driving experiences.
“Distracted driving is not simply about whether a driver knows what is safe or unsafe. It reflects a much more complex interaction between the driver’s state, the demands of the driving environment, and the technologies that compete for or support their attention,” said Dr. Pnina Gershon of the MIT AgeLab. “With this research, we are looking beyond individual moments of distraction to understand what drivers need to be prepared, attentive, and appropriately engaged during the driving task. That allows us to think differently about safety and about how technology, information, and interventions can support drivers before, during, and after the drive.”
Dr. Gershon is the director of the MIT AWARE initiative and a co-director of the MIT Advanced Vehicle Technology Consortium. With more than two decades of research experience, she leads work at the intersection of driving safety, human behavior, health, and human-centered AI. Her research uses sensing, real-world data, and behavioral analytics to understand human states and to develop technologies and interventions that support safer, more effective interactions between people and increasingly automated systems.
Understanding the behavior behind the risk
Drivers may know distraction is dangerous, but State Farm research shows that knowledge doesn’t always change what happens behind the wheel. Sixty-eight percent of drivers admit to engaging in distracting behaviors while driving, and 44% say they have crashed or experienced a near-crash while doing so.
Perception may be part of the challenge. Sixty-two percent of drivers believe taking their eyes off the road for two or more seconds is safe, even though a two-second glance away doubles crash risk.
“Technology is changing the driving experience, creating new opportunities to better understand and support drivers,” said Jeff Legner, technology executive at State Farm. “The more we learn about how people interact with technology behind the wheel, the better positioned we are to anticipate evolving risks, improve driver experiences and explore new approaches to accident prevention. This research can help turn those insights into meaningful ways to support drivers before, during and after every drive.”
Combining real-world risk with behavioral science
State Farm has worked to address distracted driving from multiple angles, including advocating for stronger hands-free laws, supporting cross-industry safety research and advancing technology that can help drivers better understand their behavior. That work includes telematics-based tools for customers and collaboration with companies such as Cambridge Mobile Telematics to explore how technology and data can help reduce roadway risk. The MIT AgeLab brings deep expertise in understanding the human side of a rapidly changing driving environment.
The collaboration builds on an established research relationship between State Farm and MIT, including State Farm’s participation in the MIT Advanced Vehicle Technology Consortium, which studies how drivers interact with increasingly automated and technology-enabled vehicles.
First findings expected in October
The first phase of the research is focused on establishing a deeper understanding of how people perceive and manage attention behind the wheel.
Findings from the first phase of the drivefulness study are expected later in October 2026, providing an early look at what the research is uncovering about driver attention, distraction and behavior through consumer survey findings.
The findings will help inform the next phase of drivefulness research, beginning in January 2027, on how people, technology and the driving environment can work together to support safer driving.
About State Farm®
For over 100 years, the mission of State Farm has been to help people manage the risks of everyday life, recover from the unexpected and realize their dreams. State Farm Mutual Automobile Insurance Company and its affiliates are the largest providers of auto and home insurance combined in the United States. Its more than 19,200 agent offices and over 62,000 employees serve over 96 million policies and accounts – including auto, fire, life, health, commercial policies and financial services accounts. Commercial auto insurance, along with coverage for renters, business owners, boats and motorcycles, is also available. State Farm Mutual Automobile Insurance Company is the parent of the State Farm family of companies. State Farm is ranked No. 32 on the 2025 Fortune 500 list of largest companies. For more information, please visit http://www.statefarm.com.
About the AWARE initiative at the MIT AgeLab
AWARE is an MIT research initiative focused on developing intelligent vehicle systems that can better understand drivers and support them in real-world conditions. Based at the MIT AgeLab and Center for Transportation & Logistics, AWARE brings together naturalistic driving research, advanced simulation, behavioral science, and artificial intelligence to study how driver state, behavior, and context interact across the driving journey. Its research examines areas such as distraction, fatigue, impairment, workload, automation use, driver monitoring, and human-machine interaction, with the goal of moving beyond simply detecting driver behavior toward systems that can sense, interpret, respond, and promote safer and more appropriate driver engagement. Through this work, AWARE is building the evidence and methods needed to support the next generation of adaptive, human-centered mobility technologies. For more information about AWARE, visit https://ctl.mit.edu/aware-initiative, and about the AgeLab, visit https://agelab.mit.edu/.
View original content to download multimedia:https://www.prnewswire.com/news-releases/state-farm-and-mit-agelab-collaborate-to-study-whats-driving-distraction-behind-the-wheel-302913331.html
SOURCE State Farm

Teradata Introduces New Privacy, Security, and Resiliency Capabilities as AI Forces Change in Enterprise Data Protection
Teradata Expands Sovereign AI Across On-Premises and Air-Gapped Cloud Environments

State Farm® and MIT AgeLab Collaborate to Study What’s Driving Distraction Behind the Wheel

Send Rakhi to UK swiftly with UK Gifts Portal

Whiteboard Series with NEAR | Ep: 45 Joel Thorstensson from ceramic.network

Nullmax and Renesas Forge Strategic Partnership to Deliver Competitive ADAS Solutions for the Global Market

Why You Should Build on #NEAR – Co-founder Illia Polosukhin at CV Labs
Whiteboard Series with NEAR | Ep: 45 Joel Thorstensson from ceramic.network

NEAR End of Year Town Hall 2021: The Open Web World, MetaBUILD 2 Hackathon and 2021 recap
Trending
-

 Coin Market4 days ago
OpenAI model helped itself to testnet crypto, then kept quiet about it
-

 Technology5 days ago
Born to Be Open: RoboParty Launches RP1, a Full-Stack Open-Source Humanoid
-

 Coin Market5 days ago
Bitcoin dips to $80.1K as KOSPI closes at its lowest since April
-

 Coin Market4 days ago
MSCI adopts index exclusion rules that could oust Strategy
-

 Technology5 days ago
Tucuvi joins the Microsoft Pegasus Program to scale clinically governed AI Care Management across health systems
-

 Technology4 days ago
FF EAI Robotics (FFR) and FF Jointly Launch FF Nova, First Embodied AI Humanoid Robot Priced Below $2,500 in U.S., FF Nova Mini, Physical AI Spark Program Curriculum, Nova Reinforcement Learning Developer Program and Developer Community Recruitment
-

 Technology5 days ago
Bloomberg Law Brings Dockets and Litigation Intelligence to Microsoft Copilot
-
Technology5 days ago
Media advisory – Minister Lightbound to announce support for Canada’s automobile industry