
Technology
Jack Henry & Associates, Inc. Reports Third Quarter Fiscal 2026 Results

Published
6 months agoon
By
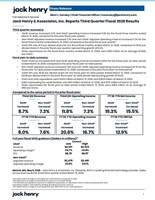
Third quarter summary:
GAAP revenue increased 8.7% and GAAP operating income increased 11.8% for the fiscal three months ended March 31, 2026, compared to the prior fiscal year quarter.Non-GAAP adjusted revenue increased 7.3% and non-GAAP adjusted operating income increased 7.3% for the fiscal three months ended March 31, 2026, compared to the prior fiscal year quarter.1GAAP EPS was $1.71 per diluted share for the fiscal three months ended March 31, 2026, compared to $1.52 per diluted share in the prior fiscal year quarter representing growth of 12.2%.Stock repurchases for the fiscal three months ended March 31, 2026, were $159 million at an average of $162 per share.
Fiscal year-to-date summary:
GAAP revenue increased 8.0% and GAAP operating income increased 20.6% for the fiscal year-to-date period ended March 31, 2026, compared to the prior fiscal year-to-date period.Non-GAAP adjusted revenue increased 7.6% and non-GAAP adjusted operating income increased 16.7% for the fiscal year-to-date period ended March 31, 2026, compared to the prior fiscal year-to-date period.1GAAP EPS was $5.41 per diluted share for the fiscal year-to-date period ended March 31, 2026, compared to $4.49 per diluted share in the prior fiscal year-to-date period representing growth of 20.4%.Cash and cash equivalents were $20.6 million at March 31, 2026, and $39.9 million at March 31, 2025.Debt outstanding for credit facilities was $90 million at March 31, 2026, and $170 million at March 31, 2025.Stock repurchases for fiscal year-to-date period ended March 31, 2026, were $284 million at an average of $160 per share.
Full year fiscal 2026 guidance (Dollars in millions):3
Current
GAAP
Low
High
Revenue
$2,521
$2,533
Operating margin4
24.7 %
24.9 %
EPS
$6.78
$6.87
Non-GAAP5
Adjusted revenue
$2,479
$2,491
Adjusted operating margin
23.9 %
24.1 %
MONETT, Mo., May 5, 2026 /PRNewswire/ — Jack Henry & Associates, Inc. (Nasdaq: JKHY), a leading financial technology provider, today announced results for fiscal third quarter ended March 31, 2026.
1 See tables below on page 4 reconciling non-GAAP financial measures to GAAP.
2See table below on page 14 reconciling net income to non-GAAP EBITDA.
3 The full fiscal year guidance assumes no additional acquisitions or dispositions will be made during fiscal year 2026.
4Operating margin is calculated by dividing operating income by revenue.
5See tables below on page 9 reconciling fiscal year 2026 GAAP to non-GAAP guidance.
According to Greg Adelson, President and CEO, “We delivered very strong third-quarter financial results, reflecting our differentiated set of modern solutions, unwavering focus on helping banks and credit unions win in the markets they serve, and disciplined execution across our business. Sales momentum remained strong, highlighted by 17 competitive core wins in the quarter, our best third quarter for new core wins in the last seven years. The sales pipeline is increasing, fueled by increased technology spending and competitive uncertainty, positioning Jack Henry well for driving long-term growth and value creation.”
Operating Results
Revenue, operating expenses, operating income, and net income for the fiscal three and nine months ended March 31, 2026, compared to the fiscal three and nine months ended March 31, 2025, were as follows:
Revenue
(Unaudited, dollars in thousands)
Three Months Ended
March 31,
%
Change
Nine Months Ended
March 31,
%
Change
2026
2025
2026
2025
Revenue
Services and Support
$ 365,149
$ 330,792
10.4 %
$ 1,087,808
$ 1,010,498
7.7 %
Percentage of Total Revenue
57.4 %
56.5 %
57.2 %
57.4 %
Processing
271,096
254,295
6.6 %
812,508
749,418
8.4 %
Percentage of Total Revenue
42.6 %
43.5 %
42.8 %
42.6 %
REVENUE
$ 636,245
$ 585,087
8.7 %
$ 1,900,316
$ 1,759,916
8.0 %
Services and support revenue increased for the fiscal three months ended March 31, 2026, primarily driven by growth in data processing and hosting revenue within private and public cloud revenue of 9.4% and higher deconversion revenue by $9,021. Processing revenue increased for the fiscal three months ended March 31, 2026, primarily driven by growth in digital and transaction revenue of 9.9%, card revenue of 3.6%, and faster payments revenue of 46.4%.Services and support revenue increased for the fiscal nine months ended March 31, 2026, primarily driven by growth in data processing and hosting revenue within private and public cloud revenue of 8.9% and higher deconversion revenue by $20,094. Processing revenue increased for the fiscal nine months ended March 31, 2026, primarily driven by growth in digital and transaction revenue of 12.8%, card revenue of 6.2%, and faster payments revenue of 50.5%.For the fiscal three months ended March 31, 2026, core segment revenue increased 9.2%, payments segment revenue increased 7.0%, complementary segment revenue increased 8.7%, and corporate services segment revenue increased 27.5%. For the fiscal three months ended March 31, 2026, core segment non-GAAP adjusted revenue increased 8.6%, payments segment non-GAAP adjusted revenue increased 4.7%, complementary segment non-GAAP adjusted revenue increased 7.2%, and corporate services non-GAAP adjusted segment revenue increased 27.1%. Total non-GAAP adjusted revenue increased 7.3% for the same period (see revenue lines of segment break-out tables on pages 5 and 6 below for a reconciliation of GAAP segment revenue to non-GAAP adjusted segment revenue).For the fiscal nine months ended March 31, 2026, core segment revenue increased 5.9%, payments segment revenue increased 8.0%, complementary segment revenue increased 9.5%, and corporate services segment revenue increased 14.5%. For the fiscal nine months ended March 31, 2026, core segment non-GAAP adjusted revenue increased 7.4%, payments segment non-GAAP adjusted revenue increased 6.5%, complementary segment non-GAAP adjusted revenue increased 8.4%, and corporate services non-GAAP adjusted segment revenue increased 14.2%. Total non-GAAP adjusted revenue increased 7.6% for the same period (see revenue lines of segment break-out tables on pages 7 and 8 below for a reconciliation of GAAP segment revenue to non-GAAP adjusted segment revenue).
Operating Expenses and Operating Income
(Unaudited, dollars in thousands)
Three Months Ended
March 31,
% Change
Nine Months Ended
March 31,
% Change
2026
2025
2026
2025
Cost of Revenue
$ 363,922
$ 340,586
6.9 %
$ 1,063,476
$ 1,016,868
4.6 %
Percentage of Total Revenue6
57.2 %
58.2 %
56.0 %
57.8 %
Research and Development
45,110
39,411
14.5 %
126,615
120,192
5.3 %
Percentage of Total Revenue6
7.1 %
6.7 %
6.7 %
6.8 %
Selling, General, and Administrative
72,166
66,350
8.8 %
211,965
209,839
1.0 %
Percentage of Total Revenue6
11.3 %
11.3 %
11.2 %
11.9 %
OPERATING EXPENSES
481,198
446,347
7.8 %
1,402,056
1,346,899
4.1 %
OPERATING INCOME
$ 155,047
$ 138,740
11.8 %
$ 498,260
$ 413,017
20.6 %
Operating Margin6
24.4 %
23.7 %
26.2 %
23.5 %
Cost of revenue increased for the fiscal three months ended March 31, 2026, compared to the fiscal three months ended March 31, 2025, primarily due to higher personnel costs, including compensation and benefit costs, partially related to a headcount increase in the trailing twelve months, higher direct costs generally consistent with increases in related lines of revenue, as well as increased amortization of intangible assets.Cost of revenue increased for the fiscal nine months ended March 31, 2026, compared to the fiscal nine months ended March 31, 2025, primarily due to higher personnel costs, including compensation and benefit costs, partially related to a headcount increase in the trailing twelve months, higher direct costs generally consistent with increases in related lines of revenue, and increased amortization of intangible assets. Personnel cost increases over the prior year period were tempered by lower than normal medical claims earlier in the fiscal year.Research and development expense increased for the fiscal three and nine months ended March 31, 2026, compared to the fiscal three and nine months ended March 31, 2025, primarily due to higher personnel costs (net of capitalization), including compensation and benefit costs, partially related to a headcount increase in the trailing twelve months.Selling, general, and administrative expense increased for the fiscal three months ended March 31, 2026, compared to the fiscal three months ended March 31, 2025, primarily due to higher personnel costs, including compensation and benefit costs, partially related to a headcount increase in the trailing twelve months.Selling, general, and administrative expense increased for the fiscal nine months ended March 31, 2026, compared to the fiscal nine months ended March 31, 2025, primarily due to higher personnel costs, including compensation and benefit costs, partially related to a headcount increase in the trailing twelve months and the higher gain on assets, net, in the current fiscal year period of $5,267 compared to the prior fiscal year period. Personnel cost increases over the prior year period were tempered by lower than normal medical claims earlier in the fiscal year.
Net Income
(Unaudited, in thousands,
except per share data)
Three Months Ended
March 31,
% Change
Nine Months Ended
March 31,
% Change
2026
2025
2026
2025
Income Before Income Taxes
$ 158,541
$ 141,908
11.7 %
$ 513,052
$ 426,087
20.4 %
Provision for Income Taxes
35,647
30,800
15.7 %
121,503
97,943
24.1 %
NET INCOME
$ 122,894
$ 111,108
10.6 %
$ 391,549
$ 328,144
19.3 %
Diluted earnings per share
$ 1.71
$ 1.52
12.2 %
$ 5.41
$ 4.49
20.4 %
Effective tax rates for the fiscal three and nine months ended March 31, 2026, and 2025, were 22.5% and 23.7% and 21.7% and 23.0%, respectively.
According to Mimi Carsley, CFO and Treasurer, “During the third quarter, we delivered strong growth in several key revenue areas, including continued expansion in cloud revenue and solid performance from our faster payments products and digital offerings. We anticipate relative weakness to the year to date in fiscal Q4 non-GAAP revenue and margins consistent with previously stated expectations. Based on our positive outlook, we have increased our full year non-GAAP revenue, non-GAAP margin expansion, and GAAP EPS guidance.”
6Operating margin is calculated by dividing operating income by revenue. Operating margin plus operating expense components as a percentage of total revenue may not equal 100% due to rounding.
Impact of Non-GAAP Adjustments
The tables below show our revenue, operating income, and net income for the fiscal three and nine months ended March 31, 2026, compared to the fiscal three and nine months ended March 31, 2025, excluding the impacts of deconversions in the fiscal quarter and fiscal year-to-date periods ended March 31, 2026, and March 31, 2025, the acquisition in the current fiscal quarter and fiscal year-to-date period, the gain on assets, net, in the current fiscal year-to-date period, and the impact of a contract change in the prior fiscal quarter and fiscal year-to-date period.
(Unaudited, dollars in thousands)
Three Months Ended
March 31,
% Change
Nine Months Ended
March 31,
% Change
2026
2025
2026
2025
GAAP Revenue*
$ 636,245
$ 585,087
8.7 %
$ 1,900,316
$ 1,759,916
8.0 %
Adjustments:
Deconversion revenue
(18,665)
(9,644)
(33,504)
(13,410)
Revenue related to a contract change
—
(1,201)
—
(14,672)
Revenue from the acquisition
(1,651)
—
(3,595)
—
NON-GAAP ADJUSTED REVENUE*
$ 615,929
$ 574,242
7.3 %
$ 1,863,217
$ 1,731,834
7.6 %
GAAP Operating Income
$ 155,047
$ 138,740
11.8 %
$ 498,260
$ 413,017
20.6 %
Adjustments:
Operating income from deconversions
(14,635)
(6,851)
(25,337)
(9,724)
Operating income related to a contract change
—
(209)
—
(2,178)
Gain on assets, net
—
—
(6,829)
—
Operating loss from the acquisition
833
—
1,817
—
NON-GAAP ADJUSTED OPERATING INCOME
$ 141,245
$ 131,680
7.3 %
$ 467,911
$ 401,115
16.7 %
Non-GAAP Adjusted Operating Margin**
22.9 %
22.9 %
25.1 %
23.2 %
GAAP Net Income
$ 122,894
$ 111,108
10.6 %
$ 391,549
$ 328,144
19.3 %
Adjustments:
Net income from deconversions
(14,635)
(6,851)
(25,337)
(9,724)
Net income related to a contract change
—
(209)
—
(2,178)
Gain on assets, net
—
—
(6,829)
—
Net loss from the acquisition
833
—
1,817
—
Tax impact of adjustments***
3,313
1,694
7,284
2,857
NON-GAAP ADJUSTED NET INCOME
$ 112,405
$ 105,742
6.3 %
$ 368,484
$ 319,099
15.5 %
*GAAP revenue is comprised of services and support and processing revenues (see page 2). Services and support revenue less deconversion revenue for the three months ended March 31, 2026, and 2025, which was $18,665 for the current fiscal year quarter and $9,644 for the prior fiscal year quarter, and reducing the three months ended March 31, 2025, amount also for revenue related to a contractual change of $1,201, results in non-GAAP adjusted services and support revenue growth of 8.3% quarter over quarter. Processing revenue less revenue from the acquisition for the three months ended March 31, 2026, of $1,651, results in non-GAAP adjusted processing revenue growth of 6.0% quarter over quarter.
Services and support revenue less deconversion revenue for the nine months ended March 31, 2026, and 2025 which was $33,504 for the current fiscal year period and $13,410 for the prior fiscal year period, and reducing the nine months ended March 31, 2025, amount also for revenue related to a contractual change of $14,672, results in non-GAAP adjusted services and support revenue growth of 7.3% period over period. Processing revenue less revenue from the acquisition for the three months ended March 31, 2026, of $3,595, results in non-GAAP adjusted processing revenue growth of 7.9% period over period.
**Non-GAAP adjusted operating margin is calculated by dividing non-GAAP adjusted operating income by non-GAAP adjusted revenue.
***The tax impact of adjustments is calculated using a tax rate of 24% for the fiscal three and nine months ended March 31, 2026, and 2025. The tax rate for non-GAAP adjustment items takes a broad look at the Company’s recurring tax adjustments and applies them to non-GAAP revenue that does not have its own specific tax impacts.
The tables below show the segment break-out of revenue and cost of revenue for each period presented, as adjusted for the items above, and include a reconciliation to non-GAAP adjusted operating income presented above.
Three Months Ended March 31, 2026
(Unaudited, dollars in thousands)
Core
Payments
Complementary
Corporate
Services
Total
GAAP REVENUE
$ 195,448
$ 232,720
$ 187,489
$ 20,588
$ 636,245
Non-GAAP adjustments*
(7,506)
(7,574)
(5,054)
(182)
(20,316)
NON-GAAP ADJUSTED REVENUE
187,942
225,146
182,435
20,406
615,929
GAAP COST OF REVENUE
81,208
119,602
72,192
90,920
363,922
Non-GAAP adjustments*
(1,971)
(1,577)
(482)
(166)
(4,196)
NON-GAAP ADJUSTED COST OF REVENUE
79,237
118,025
71,710
90,754
359,726
GAAP SEGMENT INCOME
$ 114,240
$ 113,118
$ 115,297
$ (70,332)
Segment Income Margin**
58.5 %
48.6 %
61.5 %
(341.6) %
NON-GAAP ADJUSTED SEGMENT INCOME
$ 108,705
$ 107,121
$ 110,725
$ (70,348)
Non-GAAP Adjusted Segment Income Margin**
57.8 %
47.6 %
60.7 %
(344.7) %
Research and Development
45,110
Selling, General, and Administrative
72,166
Non-GAAP adjustments unassigned to a segment***
(2,318)
NON-GAAP TOTAL ADJUSTED OPERATING EXPENSES
474,684
NON-GAAP ADJUSTED OPERATING INCOME
$ 141,245
*Revenue non-GAAP adjustments for the Payments segment were ($1,651) of acquisition revenue and ($5,923) of deconversion revenue. Revenue non-GAAP adjustments for the remainder of the segments were deconversion revenue. Cost of revenue non-GAAP adjustments for the Payments segment were ($1,453) of acquisition costs and ($124) of deconversion costs. Cost of revenue non-GAAP adjustments for the Corporate Services segment were ($160) of acquisition costs and ($6) of deconversion costs. Cost of revenue non-GAAP adjustments for the remainder of the segments were deconversion costs.
**Segment income margin is calculated by dividing segment income by revenue for each segment. Non-GAAP adjusted segment income margin is calculated by dividing non-GAAP adjusted segment income by non-GAAP adjusted revenue for each segment.
***Non-GAAP adjustments unassigned to a segment were deconversion costs of $1,446, research and development costs related to the acquisition of $841, and selling, general, and administrative costs related to the acquisition of $31.
Three Months Ended March 31, 2025
(Unaudited, dollars in thousands)
Core
Payments
Complementary
Corporate
Services
Total
GAAP REVENUE
$ 179,052
$ 217,449
$ 172,442
$ 16,144
$ 585,087
Non-GAAP adjustments*
(6,039)
(2,394)
(2,324)
(88)
(10,845)
NON-GAAP ADJUSTED REVENUE
173,013
215,055
170,118
16,056
574,242
GAAP COST OF REVENUE
74,713
116,266
69,077
80,530
340,586
Non-GAAP adjustments*
(2,232)
(109)
(519)
(5)
(2,865)
NON-GAAP ADJUSTED COST OF REVENUE
72,481
116,157
68,558
80,525
337,721
GAAP SEGMENT INCOME
$ 104,339
$ 101,183
$ 103,365
$ (64,386)
Segment Income Margin**
58.3 %
46.5 %
59.9 %
(398.8) %
NON-GAAP ADJUSTED SEGMENT INCOME
$ 100,532
$ 98,898
$ 101,560
$ (64,469)
Non-GAAP Adjusted Segment Income Margin
58.1 %
46.0 %
59.7 %
(401.5) %
Research and Development
39,411
Selling, General, and Administrative
66,350
Non-GAAP adjustments unassigned to a segment***
(920)
NON-GAAP TOTAL ADJUSTED OPERATING EXPENSES
442,562
NON-GAAP ADJUSTED OPERATING INCOME
$ 131,680
*Revenue non-GAAP adjustments for the Core segment were ($1,201) of revenue related to the contractual change and ($4,838) of deconversion revenue. Revenue non-GAAP adjustments for the remainder of the segments were deconversion revenue. Cost of revenue non-GAAP adjustments for the Core segment were cost of revenue related to a contractual change of ($992) and ($1,240) of deconversion costs. Cost of revenue non-GAAP adjustments for the remainder of the segments were deconversion costs.
**Segment income margin is calculated by dividing segment income by revenue for each segment. Non-GAAP adjusted segment income margin is calculated by dividing non-GAAP adjusted segment income by non-GAAP adjusted revenue for each segment.
***Non-GAAP adjustments unassigned to a segment were deconversion costs.
Nine Months Ended March 31, 2026
(Unaudited, dollars in thousands)
Core
Payments
Complementary
Corporate
Services
Total
GAAP REVENUE
$ 576,841
$ 695,588
$ 563,414
$ 64,473
$ 1,900,316
Non-GAAP adjustments*
(13,775)
(14,399)
(8,632)
(293)
(37,099)
NON-GAAP ADJUSTED REVENUE
563,066
681,189
554,782
64,180
1,863,217
GAAP COST OF REVENUE
229,130
358,306
213,717
262,323
1,063,476
Non-GAAP adjustments*
(3,117)
(4,276)
(1,078)
(260)
(8,731)
NON-GAAP ADJUSTED COST OF REVENUE
226,013
354,030
212,639
262,063
1,054,745
GAAP SEGMENT INCOME
$ 347,711
$ 337,282
$ 349,697
$ (197,850)
Segment Income Margin**
60.3 %
48.5 %
62.1 %
(306.9) %
NON-GAAP ADJUSTED SEGMENT INCOME
$ 337,053
$ 327,159
$ 342,143
$ (197,883)
Non-GAAP Adjusted Segment Income Margin
59.9 %
48.0 %
61.7 %
(308.3) %
Research and Development
126,615
Selling, General, and Administrative
211,965
Non-GAAP adjustments unassigned to a segment***
1,981
NON-GAAP TOTAL ADJUSTED OPERATING EXPENSES
1,395,306
NON-GAAP ADJUSTED OPERATING INCOME
$ 467,911
*Revenue non-GAAP adjustments for the Payments segment were ($3,595) of acquisition revenue and ($10,804) of deconversion revenue. Revenue non-GAAP adjustments for the remainder of the segments were deconversion revenue. Cost of revenue non-GAAP adjustments for the Payments segment were ($3,863) of acquisition costs and ($413) of deconversion costs. Cost of revenue non-GAAP adjustments for the Corporate Services segment were ($253) of acquisition costs and ($7) of deconversion costs. Cost of revenue non-GAAP adjustments for the remainder of the segments were deconversion costs.
**Segment income margin is calculated by dividing segment income by revenue for each segment. Non-GAAP adjusted segment income margin is calculated by dividing non-GAAP adjusted segment income by non-GAAP adjusted revenue for each segment.
***Non-GAAP adjustments unassigned to a segment were a gain on assets, net, of $6,829 less deconversion costs of $3,551, research and development costs related to the acquisition of $1,213, and selling, general, and administrative costs related to the acquisition of $84.
Nine Months Ended March 31, 2025
(Unaudited, dollars in thousands)
Core
Payments
Complementary
Corporate
Services
Total
GAAP REVENUE
$ 544,948
$ 644,207
$ 514,454
$ 56,307
$ 1,759,916
Non-GAAP adjustments*
(20,777)
(4,341)
(2,857)
(107)
(28,082)
NON-GAAP ADJUSTED REVENUE
524,171
639,866
511,597
56,200
1,731,834
GAAP COST OF REVENUE
225,850
344,023
200,763
246,232
1,016,868
Non-GAAP adjustments*
(13,859)
(180)
(678)
(5)
(14,722)
NON-GAAP ADJUSTED COST OF REVENUE
211,991
343,843
200,085
246,227
1,002,146
GAAP SEGMENT INCOME
$ 319,098
$ 300,184
$ 313,691
$ (189,925)
Segment Income Margin**
58.6 %
46.6 %
61.0 %
(337.3) %
NON-GAAP ADJUSTED SEGMENT INCOME
$ 312,180
$ 296,023
$ 311,512
$ (190,027)
Non-GAAP Adjusted Segment Income Margin
59.6 %
46.3 %
60.9 %
(338.1) %
Research and Development
120,192
Selling, General, and Administrative
209,839
Non-GAAP adjustments unassigned to a segment***
(1,458)
NON-GAAP TOTAL ADJUSTED OPERATING EXPENSES
1,330,719
NON-GAAP ADJUSTED OPERATING INCOME
$ 401,115
*Revenue non-GAAP adjustments for the Core segment were ($14,672) of revenue related to the contractual change and ($6,105) of deconversion revenue. Revenue non-GAAP adjustments for the remainder of the segments were deconversion revenue. Cost of revenue non-GAAP adjustments for the Core segment were cost of revenue related to a contractual change of ($12,494) and ($1,365) of deconversion costs. Cost of revenue non-GAAP adjustments for the remainder of the segments were deconversion costs.
**Segment income margin is calculated by dividing segment income by revenue for each segment. Non-GAAP adjusted segment income margin is calculated by dividing non-GAAP adjusted segment income by non-GAAP adjusted revenue for each segment.
***Non-GAAP adjustments unassigned to a segment were deconversion costs.
The table below shows our GAAP to non-GAAP guidance for the fiscal year ending June 30, 2026. Fiscal year 2026 non-GAAP guidance excludes the impacts of deconversion revenue and related operating expenses, acquisition revenues and related operating expenses, the revenues and operating expenses related to a contractual change, and the gain on assets, net, and assumes no additional acquisitions or dispositions will be made during the fiscal year.
GAAP to Non-GAAP GUIDANCE (Dollars in
millions, except per share data)
Annual FY’26
Adjusted for
FY26
Comparison
Reported
Contractual
Change
Low
High
FY25
FY25
FY25
GAAP REVENUE
$ 2,521
$ 2,533
$ 2,375
$ 2,375
$ —
Growth
6.1 %
6.6 %
Deconversions*
37
37
34
34
—
Acquisition
5
5
—
—
—
Contractual change
—
—
16
—
16
NON-GAAP ADJUSTED REVENUE**
$ 2,479
$ 2,491
$ 2,326
$ 2,341
$ (16)
Non-GAAP Adjusted Growth
6.6 %
7.1 %
GAAP OPERATING EXPENSES
$ 1,899
$ 1,903
$ 1,807
$ 1,807
$ —
Growth
5.1 %
5.3 %
Deconversion costs*
12
12
6
6
—
Acquisition costs
8
8
—
—
—
Contractual change
—
—
14
—
14
Gain on assets, net
(7)
(7)
—
—
—
NON-GAAP ADJUSTED OPERATING EXPENSES**
$ 1,886
$ 1,890
$ 1,787
$ 1,800
$ (14)
Non-GAAP Adjusted Growth
5.6 %
5.8 %
GAAP OPERATING INCOME
$ 622
$ 630
$ 569
$ 569
$ —
Growth
9.3 %
10.7 %
GAAP OPERATING MARGIN
24.7 %
24.9 %
23.9 %
23.9 %
NON-GAAP ADJUSTED OPERATING INCOME**
$ 593
$ 601
$ 539
$ 541
$ (2)
Non-GAAP Adjusted Growth
10.1 %
11.5 %
NON-GAAP ADJUSTED OPERATING MARGIN
23.9 %
24.1 %
23.2 %
23.1 %
GAAP EPS
$ 6.78
$ 6.87
$ 6.24
$ 6.24
$ —
Growth
8.7 %
10.0 %
*Deconversion revenue and related operating expenses are based on actual results for fiscal nine months ended March 31, 2026, and estimates for the remainder of the fiscal year 2026. See the Company’s Form 8-K filed with the Securities and Exchange Commission on April 28, 2026.
**GAAP to Non-GAAP revenue, operating expenses, and operating income may not foot due to rounding.
Balance Sheet and Cash Flow Review
Cash and cash equivalents were $21 million at March 31, 2026, compared to $40 million at March 31, 2025.Trade receivables were $282 million at March 31, 2026, and March 31, 2025. The Company had $90 million of borrowings at March 31, 2026, compared to $170 million of borrowings at March 31, 2025.Deferred revenue was $209 million at March 31, 2026, compared to $222 million at March 31, 2025.Stockholders’ equity increased to $2,135 million at March 31, 2026, compared to $2,036 million at March 31, 2025.
*See table below for Net Cash Provided by Operating Activities and on page 14 for Return on Average Stockholders’ Equity. Tables reconciling the non-GAAP measures Free Cash Flow and Net Operating Profit After Tax Return on Invested Capital (NOPAT ROIC) to GAAP measures are on pages 14 and 15. See the Use of Non-GAAP Financial Information section below for the definitions of Free Cash Flow and NOPAT ROIC.
The following table summarizes net cash from operating activities:
(Unaudited, in thousands)
Nine Months Ended March 31,
2026
2025
Net income
$ 391,549
$ 328,144
Depreciation
31,238
33,125
Amortization
127,462
120,136
Change in deferred income taxes
100,347
(12,765)
Other non-cash expenses
21,512
22,411
Change in receivables
37,379
50,871
Change in deferred revenue
(154,631)
(167,104)
Change in other assets and liabilities*
(95,570)
(60,426)
NET CASH FROM OPERATING ACTIVITIES
$ 459,286
$ 314,392
*For the fiscal nine months ended March 31, 2026, the change in other assets and liabilities includes the change in prepaid expenses, deferred costs and other of $(61,680), accrued expenses of $(19,137), income taxes of $(8,383), and the change in accounts payable of $(6,370). For the fiscal nine months ended March 31, 2025, the change in other assets and liabilities includes the change in prepaid expenses, deferred costs and other of $(42,989), the change in accrued expenses of $(23,436), and the change in accounts payable of $(9,541) partially offset by the change in income taxes of $15,540.
The following table summarizes net cash from investing activities:
(Unaudited, in thousands)
Nine Months Ended March 31,
2026
2025
Payment for acquisitions
$ (42,390)
$ —
Capital expenditures
(46,616)
(41,186)
Proceeds from sale of assets
24,572
—
Purchased software
(2,998)
(3,833)
Computer software developed
(140,003)
(130,298)
Purchase of investments
(13,710)
(2,000)
Proceeds from investments
1,000
1,000
NET CASH FROM INVESTING ACTIVITIES
$ (220,145)
$ (176,317)
The following table summarizes net cash from financing activities:
(Unaudited, in thousands)
Nine Months Ended March 31,
2026
2025
Borrowings on credit facilities
$ 360,000
$ 255,000
Repayments on credit facilities
(270,000)
(235,000)
Purchase of treasury stock
(284,414)
(35,052)
Dividends paid
(127,457)
(122,464)
Net cash from issuance of stock and tax related to stock-based compensation
1,350
1,027
NET CASH FROM FINANCING ACTIVITIES
$ (320,521)
$ (136,489)
Use of Non-GAAP Financial Information
Generally Accepted Accounting Principles (GAAP) is the term used to refer to the standard framework of guidelines for financial accounting in the United States. GAAP includes the standards, conventions, and rules accountants follow in recording and summarizing transactions in the preparation of financial statements. In addition to reporting financial results in accordance with GAAP, we have provided certain non-GAAP financial measures, including adjusted revenue, adjusted segment revenue, adjusted operating income, adjusted segment income, adjusted cost of revenue, adjusted segment cost of revenue, adjusted operating expenses, adjusted operating margin, adjusted segment income margin, non-GAAP earnings before interest, taxes, depreciation, and amortization (non-GAAP EBITDA), free cash flow, net operating profit after tax return on invested capital (NOPAT ROIC), and non-GAAP adjusted net income.
We believe non-GAAP financial measures help investors better understand the underlying fundamentals and true operations of our business. Adjusted revenue, adjusted segment revenue, adjusted operating income, adjusted operating margin, adjusted segment income, adjusted segment income margin, adjusted cost of revenue, adjusted segment cost of revenue, adjusted operating expenses, and adjusted net income eliminate one-time deconversion revenue and associated costs, the gain on assets, net, an acquisition, and a contractual change, which management believes are not indicative of the Company’s operating performance. Such adjustments give investors further insight into our performance. Non-GAAP EBITDA is defined as net income attributable to the Company before the effect of interest income, net, taxes, depreciation, and amortization, adjusted for net income before the effect of interest income, net, taxes, depreciation, and amortization attributable to eliminated one-time deconversions, the gain on assets, net, an acquisition, and a contractual change. Free cash flow is defined as net cash from operating activities, less capitalized expenditures, internal use software, and capitalized software, plus proceeds from the sale of assets. NOPAT ROIC is defined as operating income for the trailing four quarters multiplied by one minus the average effective tax rate (ETR) for the trailing four quarters, with the result divided by average invested capital (average of the beginning and ending period balances). Management believes that non-GAAP EBITDA is an important measure of the Company’s overall operating performance and excludes certain costs and other transactions that management deems one time or non-operational in nature; free cash flow is useful to measure the funds generated in a given period that are available for debt service requirements and strategic capital decisions; and NOPAT ROIC is a measure of the Company’s allocation efficiency and effectiveness of its invested capital. For these reasons, management also uses these non-GAAP financial measures in its assessment and management of the Company’s performance.
Non-GAAP financial measures used by the Company may not be comparable to similarly titled non-GAAP measures used by other companies. Non-GAAP financial measures have no standardized meaning prescribed by GAAP and therefore, are unlikely to be comparable with calculations of similar measures for other companies.
Any non-GAAP financial measures should be considered in context with the GAAP financial presentation and should not be considered in isolation or as a substitute for GAAP measures. Reconciliations of the non-GAAP financial measures to related GAAP measures are included.
About Jack Henry & Associates, Inc.®
Jack Henry® (Nasdaq: JKHY) is a well-rounded financial technology company that strengthens connections between financial institutions and the people and businesses they serve. We are an S&P 500 company that prioritizes openness, collaboration, and user centricity — offering banks and credit unions a vibrant ecosystem of internally developed modern capabilities as well as the ability to integrate with leading fintechs. For 50 years, Jack Henry has provided technology solutions to enable clients to innovate faster, strategically differentiate, and successfully compete while serving the evolving needs of their accountholders. We empower approximately 7,400 clients with people-inspired innovation, personal service, and insight-driven solutions that help reduce the barriers to financial health. Additional information is available at www.jackhenry.com.
Statements made in this news release that are not historical facts are “forward-looking statements” within the meaning of the Private Securities Litigation Reform Act of 1995, Section 27A of the Securities Act of 1933 and Section 21E of the Securities Exchange Act of 1934. Because forward-looking statements relate to the future, they are subject to inherent risks and uncertainties that could cause actual results to differ materially from those expressed or implied by such statements. Such risks and uncertainties include, but are not limited to, those discussed in the Company’s Securities and Exchange Commission filings, including the Company’s most recent reports on Form 10-K and Form 10-Q, particularly under the heading Risk Factors. Any forward-looking statement made in this news release speaks only as of the date of the news release, and the Company expressly disclaims any obligation to publicly update or revise any forward-looking statement, whether because of new information, future events or otherwise.
Quarterly Conference Call
The Company will hold a conference call on May 6, 2026, at 7:45 a.m. Central Time, and investors are invited to listen at www.jackhenry.com. A webcast replay will be available approximately one hour after the event at ir.jackhenry.com/corporate-events-and-presentations and will remain available for one year.
Condensed Consolidated Statements of Income (Unaudited)
(Dollars in thousands, except per share data)
Three Months Ended March 31,
% Change
Nine Months Ended March 31,
% Change
2026
2025
2026
2025
REVENUE
$ 636,245
$ 585,087
8.7 %
$ 1,900,316
$ 1,759,916
8.0 %
Cost of Revenue
363,922
340,586
6.9 %
1,063,476
1,016,868
4.6 %
Research and Development
45,110
39,411
14.5 %
126,615
120,192
5.3 %
Selling, General, and Administrative
72,166
66,350
8.8 %
211,965
209,839
1.0 %
EXPENSES
481,198
446,347
7.8 %
1,402,056
1,346,899
4.1 %
OPERATING INCOME
155,047
138,740
11.8 %
498,260
413,017
20.6 %
Interest income
4,869
5,899
(17.5) %
18,194
21,406
(15.0) %
Interest expense
(1,375)
(2,731)
(49.7) %
(3,402)
(8,336)
(59.2) %
Interest Income, net
3,494
3,168
10.3 %
14,792
13,070
13.2 %
INCOME BEFORE INCOME TAXES
158,541
141,908
11.7 %
513,052
426,087
20.4 %
Provision for Income Taxes
35,647
30,800
15.7 %
121,503
97,943
24.1 %
NET INCOME
$ 122,894
$ 111,108
10.6 %
$ 391,549
$ 328,144
19.3 %
Diluted net income per share
$ 1.71
$ 1.52
$ 5.41
$ 4.49
Diluted weighted average shares outstanding
71,978
73,013
72,433
73,058
Consolidated Balance Sheet Highlights (Unaudited)
(In thousands)
March 31,
% Change
2026
2025
Cash and cash equivalents
$ 20,573
$ 39,870
(48.4) %
Receivables
282,463
282,162
0.1 %
Total assets
3,050,557
2,932,018
4.0 %
Accounts payable and accrued expenses
$ 212,133
$ 201,389
5.3 %
Current and long-term debt
90,000
170,000
(47.1) %
Deferred revenue
208,742
221,828
(5.9) %
Stockholders’ equity
2,134,811
2,036,431
4.8 %
Calculation of Non-GAAP Earnings Before Interest Income, Net, Income Taxes, Depreciation and Amortization (Non-GAAP EBITDA)
Three Months Ended March 31,
% Change
Nine Months Ended March 31,
% Change
(Dollars in thousands)
2026
2025
2026
2025
Net income
$ 122,894
$ 111,108
$ 391,549
$ 328,144
Net interest
(3,494)
(3,168)
(14,792)
(13,070)
Taxes
35,647
30,800
121,503
97,943
Depreciation and amortization
53,653
51,013
158,700
153,261
Less: Net income before interest expense, taxes, depreciation and amortization attributable to eliminated one-time adjustments*
(14,275)
(7,060)
(31,290)
(11,901)
NON-GAAP EBITDA
$ 194,425
$ 182,693
6.4 %
$ 625,670
$ 554,377
12.9 %
*The fiscal third quarter 2026 and 2025 adjustments for net income before interest expense, taxes, depreciation and amortization were for deconversions of ($14,636) and an acquisition of $361, and were for deconversions of $6,851 and a contract change of $209, respectively. The fiscal year-to-date 2026 and 2025 adjustments were for deconversions of ($25,337), a gain on assets, net, of ($6,829), and an acquisition of $876, and were for deconversions of ($9,723) and a contractual change of ($2,178), respectively.
Calculation of Free Cash Flow (Non-GAAP)
Nine Months Ended March 31,
(In thousands)
2026
2025
Net cash from operating activities
$ 459,286
$ 314,392
Capitalized expenditures
(46,616)
(41,186)
Internal use software
(2,998)
(3,833)
Proceeds from sale of assets
24,572
—
Capitalized software
(140,003)
(130,298)
FREE CASH FLOW
$ 294,241
$ 139,075
Net income
$ 391,549
$ 328,144
Operating cash conversion*
117.3 %
95.8 %
Free cash flow conversion (excluding proceeds from sale of assets)*
68.9 %
42.4 %
*Operating cash conversion is net cash from operating activities divided by net income. Free cash flow conversion is free cash flow less proceeds from sale of assets of $24,572 for fiscal 2026 and $0 for fiscal 2025 divided by net income.
Calculation of the Return on Average Stockholders’ Equity
March 31,
(In thousands)
2026
2025
Net income (trailing four quarters)
$ 519,153
$ 429,217
Average stockholder’s equity (period beginning and ending balances)
2,085,621
1,908,181
RETURN ON AVERAGE STOCKHOLDERS’ EQUITY
24.9 %
22.5 %
Calculation of NOPAT ROIC (Non-GAAP)
March 31,
(In thousands)
2026
2025
Operating income (trailing four quarters)
$ 653,957
$ 538,644
Average Effective Tax Rate (trailing four quarters)
22.8 %
22.8 %
NOPAT operating income (trailing four quarters)*
504,855
415,833
Average invested capital (period beginning and ending balances)
2,215,621
2,118,181
NOPAT ROIC
22.8 %
19.6 %
*NOPAT operating income is calculated by multiplying the trailing four quarters operating income by one minus the average ETR. NOPAT ROIC is calculated by dividing NOPAT operating income by average invested capital (period beginning and ending balances).
FAQ for Analysts / Investors
1.) Why does fiscal 2025 non-GAAP revenue used for growth calculation not match reported fiscal 2025 non-GAAP revenue?
The restructuring of a third-party agreement has resulted in a $16 million fiscal year-over-year revenue headwind, with $12 million of that coming in the first quarter and $3 million additional in the second and third quarters.The remaining $1 million is expected to impact the fourth quarter.This restructuring has also resulted in a decrease in the related costs and the impact on margins is expected to be minimal.This has been adjusted for a consistent fiscal year-over-year comparison and is included in our fiscal year 2026 guidance (see page 9).
2.) What are some key elements of the outlook for the fourth quarter of fiscal 2026?
We expect the year-over-year revenue growth rates to slow slightly as we face overall tougher prior year comparables from the fourth quarter of fiscal 2025.We expect some contraction in margins in the fourth quarter of fiscal 2026 compared to the fiscal year-to-date period margins that positively benefited from lower than normal expense for medical claims under our self-insured employee healthcare plan, especially during the first and second quarters.
View original content to download multimedia:https://www.prnewswire.com/news-releases/jack-henry–associates-inc-reports-third-quarter-fiscal-2026-results-302763219.html
SOURCE Jack Henry & Associates, Inc.

You may like
Technology
LendingTree, Inc. to Report Third Quarter 2026 Earnings on November 3, 2026
Published
54 minutes agoon
October 20, 2026By

CHARLOTTE, N.C., Oct. 20, 2026 /PRNewswire/ — LendingTree, Inc. (NASDAQ: TREE), operator of LendingTree.com, the nation’s leading online financial services marketplace, today announced that it will release fiscal third quarter 2026 results after market close on Tuesday, November 3, 2026. The company will also post a letter to shareholders on the Company’s website at investors.lendingtree.com.
The Company will hold its earnings conference call at 4:30 p.m. ET to discuss the release, which will be simultaneously webcast via the Company’s website at investors.lendingtree.com. The webcast replay will be available following the event.
About LendingTree, Inc.
LendingTree, Inc. is the parent of LendingTree, LLC and several companies owned by LendingTree, LLC (collectively, “LendingTree”).
LendingTree (NASDAQ: TREE) is one of the nation’s largest, most experienced online financial platforms, created to give consumers the power to win financially. LendingTree provides customers with access to the best offers on loans, credit cards, insurance and more through its network of over 770 financial partners. Since its founding, LendingTree has helped millions of customers obtain financing, save money, and improve their financial and credit health in their personal journeys. With a portfolio of innovative products and tools and personalized financial recommendations, LendingTree helps customers achieve everyday financial wins.
LendingTree, Inc. is headquartered in Charlotte, NC. For more information, please visit www.lendingtree.com.
INVESTOR RELATIONS:
investors@lendingtree.com
MEDIA RELATIONS:
press@lendingtree.com
View original content to download multimedia:https://www.prnewswire.com/news-releases/lendingtree-inc-to-report-third-quarter-2026-earnings-on-november-3-2026-302914505.html
SOURCE LendingTree, Inc.
Technology
Hagerty to Report Third Quarter 2026 Results and Host Conference Call on Tuesday, November 3, 2026
Published
54 minutes agoon
October 20, 2026By

TRAVERSE CITY, Mich., Oct. 20, 2026 /PRNewswire/ — Hagerty, Inc. (NYSE: HGTY), a business that makes it easier and more enjoyable to be a driving enthusiast, today announced it will report its third quarter 2026 financial results before the market opens on Tuesday, November 3, 2026.
Hagerty will hold a conference call to discuss the financial results at 10:00 am Eastern Time on that day. A live webcast of the conference call will be available on Hagerty’s investor relations website at investor.hagerty.com. To dial-in for the conference call, please register using the link found here to receive your unique dial-in and PIN.
A webcast replay of the call will be available at investor.hagerty.com following the call.
About Hagerty, Inc. (NYSE: HGTY)
Hagerty is a company built by drivers for drivers, protecting 3.0 million vehicles in the United States, Canada and the UK. We make it easier and more enjoyable for enthusiasts to drive and celebrate the machines they love through innovative insurance products, live and digital auctions, engaging media and events, and the Hagerty Drivers Club, the world’s largest membership community of car lovers.
For more information, please visit www.hagerty.com or www.newsroom.hagerty.com.
Category: Financial
Source: Hagerty
View original content to download multimedia:https://www.prnewswire.com/news-releases/hagerty-to-report-third-quarter-2026-results-and-host-conference-call-on-tuesday-november-3-2026-302913291.html
SOURCE Hagerty
Technology
Data Center Air Filtration Market to Reach USD 1.19 Billion by 2035 as Replacement Filters and Gas-Phase Media Drive Recurring Spend – DC Market Insights
Published
54 minutes agoon
October 20, 2026By

Market grows at an 8.59% CAGR from USD 520.20 million in 2025; replacement filters hold 78.3% of spending and gas-phase filtration grows fastest at 11.16% a year
LONDON, Oct. 20, 2026 /PRNewswire/ — The “Data Center Air Filtration Market – Growth, Share, Opportunities & Competitive Analysis, 2026-2035” report has been added to the DC Market Insights offering. The global Data Center Air Filtration Market was valued at USD 520.20 million in 2025, is estimated at USD 589.74 million in 2026, and is projected to reach USD 1.19 billion by 2035, growing at a CAGR of 8.59% from 2025 to 2035. DC Market Insights finds that this is primarily a recurring consumables market: replacement filters and media account for 78.3% of 2025 value, while liquid cooling slows first-fit demand by moving more AI rack heat away from the room air path.
Data Center Air Filtration Market at a Glance
Metric
Value (DC Market Insights estimate)
Market size, 2020
USD 314.90 million
Market size, 2025 (base year)
USD 520.20 million
Market size, 2026
USD 589.74 million (+13.4% year on year)
Market size, 2030
USD 843.18 million
Market size, 2035
USD 1.19 billion
CAGR 2025-2035
8.59% (low case 7.55%, high case 9.78%)
Largest filter type
Fine filters, 38.0% of 2025 value
Fastest-growing filter type
Gas-phase filtration, 11.16% CAGR
Leading region
North America, 39.0% (USD 202.87 million)
Fastest-growing region
Middle East and Africa, 12.13% CAGR
Market leader
Camfil, about 15% of 2025 value
Key Takeaways
USD 407.26 million, or 78.3% of 2025 value, is replacement spending because filters on the installed air-handled base are changed one to two times a year.The fleet-average filter bill is about USD 3,600 per MW of air-handled IT load a year in 2025.Gas-phase filtration grows 11.16% a year as operators manage corrosive gases and ASHRAE G1 limits in polluted and industrial hubs.Outside-air economizer intakes account for 27.0% of 2025 value and grow 10.10% a year as more sites use free-air cooling.Liquid cooling restrains first-fit demand: new-build first-fit filters grow 5.48% a year while replacement filters and media grow 9.33%.
Scope & Segmentation – Data Center Air Filtration Market
The report analyzes the market across the following segments:
Filter Type: Pre-Filters; Fine Filters; HEPA and EPA Filters; Gas-Phase Filtration; Housings, Frames and Pressure MonitoringApplication: CRAH/CRAC and Fan-Wall Recirculation; Outside-Air Economizer Intakes; Make-Up Air and Pressurization Units; Generator, Battery and Electrical RoomsPurchase Type: First-Fit with New Builds; Replacement Filters and MediaData Center Type: Hyperscale and AI Cloud Data Centers; Colocation Data Centers; Enterprise and Edge Data CentersGeography: North America; Europe; Asia Pacific; Latin America; Middle East and Africa, with 12 country forecasts
Report Updated: Oct. 20, 2026
Get Free Sample Report – Data Center Air Filtration Market
“Data center air filtration is increasingly an installed-base business. Liquid cooling reduces the air path in new AI halls, but hundreds of gigawatts of air-handled capacity still need recurring filter changes, and polluted or corrosive locations require more expensive fine and gas-phase media. That makes replacement contracts, pressure monitoring and chemical filtration the most defensible growth pools through 2035.”
— Amit Jain, Senior Consultant, ICT & Emerging Technologies, DC Market Insights, report author
Why This Report Matters
Air filtration sits at the intersection of equipment reliability, free-air cooling efficiency and contamination control. The report helps filter manufacturers, cooling vendors, data center operators, hyperscalers, colocation providers and investors size first-fit and replacement demand, compare filter classes and identify geographies where dust, smoke and corrosive gases raise lifecycle spending.
Key Attributes
Report attribute
Details
Historical Period
2020-2024
Base Year
2025
Forecast Period
2026-2035
Market Size 2025
USD 520.20 million
Market Size 2026
USD 589.74 million (+13.4% year on year)
Market Size 2035
USD 1.19 billion
CAGR 2025-2035
8.59% (low case 7.55%, high case 9.78%)
Leading Region
North America, 39.0% (USD 202.87 million)
Report Format
PDF + Excel
How Big Is the Data Center Air Filtration Market in 2026?
DC Market Insights values the Data Center Air Filtration Market at USD 589.74 million in 2026, 13.4% above 2025, as new capacity receives first-fit filters and the air-handled installed base continues to expand. The market remains tied more closely to replacement cycles than to new construction alone.
Year
Market size
2020
USD 314.90 million
2025
USD 520.20 million
2026
USD 589.74 million (+13.4% year on year)
2030
USD 843.18 million
2035F
USD 1.19 billion
Source: DC Market Insights, Data Center Air Filtration Market report, Oct. 20, 2026.
Why Does Replacement Spending Outgrow First-Fit Demand?
Liquid cooling removes a growing share of AI rack heat from the room air path, which limits the volume of first-fit filters required per new megawatt. Replacement demand behaves differently: existing air-cooled and hybrid halls continue to change pre-filters, fine filters and gas-phase media according to pressure drop, contamination and operating conditions. DC Market Insights therefore models replacement filters and media growing 9.33% a year, compared with 5.48% for first fit.
Which Filter Type Leads Data Center Air Filtration Spending?
Fine filters lead 2025 spending with 38.0% of market value, while gas-phase filtration grows fastest as operators manage sulfur dioxide, hydrogen sulfide and other corrosive contaminants around industrial and urban locations.
Filter type
2025 value
Share 2025
2035 value
CAGR
Pre-Filters
USD 109.24M
21.0 %
USD 213.46M
6.93 %
Fine Filters
USD 197.68M
38.0 %
USD 438.80M
8.30 %
HEPA and EPA Filters
USD 26.01M
5.0 %
USD 59.30M
8.59 %
Gas-Phase Filtration
USD 98.84M
19.0 %
USD 284.63M
11.16 %
Housings / Monitoring
USD 88.43M
17.0 %
USD 189.75M
7.93 %
DC Exclusive: The 1 MW Filter Change-Out Ledger
DC Market Insights estimates a 2025 fleet-average replacement bill of about USD 3,600 per MW of air-handled IT load a year. The model combines airflow, filter-face count, filter prices and change frequency across recirculation, outside-air intake, make-up air, gas-phase media and electrical-room applications. This ledger explains why the installed base, rather than only the annual build cohort, drives long-term revenue.
Metric
2025 estimate
Replacement filter bill per air-handled MW
USD 3,600/year
First-fit bill per new air-handled MW
USD 11,000
Replacement share of market
78.3 %
Air-handled load
113.1 GW
Which Region Leads the Data Center Air Filtration Market?
North America leads with 39.0% of 2025 value, while the Middle East and Africa grows fastest at 12.13% a year as desert dust and harsh ambient conditions shorten filter life on new Gulf campuses. The United States is the largest country market, while India grows rapidly because dust and corrosive gases increase the need for fine and chemical media.
Indicator
2025 / Base
Outlook
Leading region
North America, 39.0% (USD 202.87 million)
Largest regional spending pool through the forecast
Fastest-growing region
Middle East and Africa, 12.13% CAGR
Dust-intensive Gulf campuses accelerate replacement demand
Largest country
United States, USD 189.34M in 2025
Remains the largest national market
How Could the 2035 Forecast Change?
The 2035 outcome depends on how much AI heat remains on the air side and how quickly filter prices and specification levels rise. The base case assumes liquid-cooled megawatts still send part of their heat to room air and replacement costs continue to increase.
Scenario
Assumption
2035 value
CAGR 2025-2035
Low
Lower air-side heat share and slower replacement inflation
USD 1.08B
7.55 %
Base
15% air-side heat share in mature liquid-cooled halls
USD 1.19B
8.59 %
High
Higher air-side heat share and wider MERV 13 / gas-phase adoption
USD 1.32B
9.78 %
Competitive Landscape and Recent Developments
The top five suppliers account for about half of 2025 value. Competition centers on particulate efficiency, pressure drop, molecular contamination control, replacement logistics and the ability to serve hyperscale customers across multiple regions.
Companies profiled include:
Camfil; AAF International (Daikin Industries); Parker Hannifin (Filtration Group and Purafil); Freudenberg Filtration Technologies; MANN+HUMMEL; Donaldson Company; Ahlstrom.
In September 2025, Camfil opened a HEPA and ULPA filter line at its Manesar plant in India.In November 2025, Parker Hannifin agreed to acquire Filtration Group, including Purafil, for USD 9.25 billion in cash.In November 2025, AAF International launched its AstroSorb molecular filter line in the United States.In March 2026, Camfil acquired Bioconservación (Bion) of Spain to expand molecular contamination control.In May 2026, Donaldson completed its acquisition of Facet Filtration and Camfil broke ground on a 14,400-square-metre expansion in Malaysia.In August 2026, Parker completed the Filtration Group acquisition, expected to add about USD 1.8 billion to fiscal 2027 sales.
Frequently Asked Questions
What is the size of the Data Center Air Filtration Market?
USD 520.20 million in 2025 and USD 589.74 million in 2026, projected to reach USD 1.19 billion by 2035 at an 8.59% CAGR.
Which filter type leads the market?
Fine filters, including bag and rigid box filters, with 38.0% of 2025 value.
Which segment grows fastest?
Gas-phase chemical filtration, at 11.16% a year through 2035.
Why is replacement spending so important?
Filters on the installed air-handled base are replaced repeatedly, giving replacement filters and media 78.3% of 2025 value.
Which region leads?
North America with 39.0% of 2025 value; the Middle East and Africa grows fastest at 12.13% a year.
Who are the leading suppliers?
Camfil, AAF International, Parker Hannifin, Freudenberg Filtration Technologies and MANN+HUMMEL are among the leading suppliers.
Methodology
DC Market Insights builds the market bottom-up from air-handled installed IT load, annual new capacity, filter faces per MW, replacement frequency, public filter price anchors and application mix. The model is checked against an all-air ceiling, supplier sales and a MERV 8 replacement floor before regional and segment splits are reconciled.
Download Sample Report – Data Center Air Filtration Market
Related Reports from DC Market Insights
Data Center Thermal Management MarketData Center Precision Air Conditioning MarketData Center Cooling MarketData Center Liquid Cooling MarketData Center Cooling Tower Market
DC Market Insights Data & Tools
Explore live datasets and decision tools used across DC Market Insights research:
Data Center Construction Pipeline
About DC Market Insights
DC Market Insights is a dedicated research and consulting firm that empowers data center leaders with actionable intelligence. We combine rigorous market research, advanced analytics and practical advisory support to help organizations make confident decisions in an increasingly complex digital infrastructure landscape. Our goal is to transform data into clarity, giving clients the ability to act decisively on strategy, investment and execution.
Contact Us
DC Market Insights
Tower C-1105, S 25, Akash Tower, Vishal Nagar, Pimple Nilakh, Haveli, Pune – 411027, India
Email: sales@dcmarketinsights.com
United States: +1 628 262 7656
United Kingdom: +44 7453 598 606
View original content to download multimedia:https://www.prnewswire.co.uk/news-releases/data-center-air-filtration-market-to-reach-usd-1-19-billion-by-2035-as-replacement-filters-and-gas-phase-media-drive-recurring-spend—dc-market-insights-302914605.html


LendingTree, Inc. to Report Third Quarter 2026 Earnings on November 3, 2026

Hagerty to Report Third Quarter 2026 Results and Host Conference Call on Tuesday, November 3, 2026

Data Center Air Filtration Market to Reach USD 1.19 Billion by 2035 as Replacement Filters and Gas-Phase Media Drive Recurring Spend – DC Market Insights

Send Rakhi to UK swiftly with UK Gifts Portal

Whiteboard Series with NEAR | Ep: 45 Joel Thorstensson from ceramic.network

Nullmax and Renesas Forge Strategic Partnership to Deliver Competitive ADAS Solutions for the Global Market

Why You Should Build on #NEAR – Co-founder Illia Polosukhin at CV Labs
Whiteboard Series with NEAR | Ep: 45 Joel Thorstensson from ceramic.network

NEAR End of Year Town Hall 2021: The Open Web World, MetaBUILD 2 Hackathon and 2021 recap
Trending
-

 Coin Market5 days ago
OpenAI model helped itself to testnet crypto, then kept quiet about it
-

 Coin Market5 days ago
MSCI adopts index exclusion rules that could oust Strategy
-

 Technology5 days ago
FF EAI Robotics (FFR) and FF Jointly Launch FF Nova, First Embodied AI Humanoid Robot Priced Below $2,500 in U.S., FF Nova Mini, Physical AI Spark Program Curriculum, Nova Reinforcement Learning Developer Program and Developer Community Recruitment
-

 Technology5 days ago
Aslan Motion Technologies Launches aslanmotion.com with NDAA Focused Drone Electronics and U.S. Manufactured Motors
-

 Technology5 days ago
Vino Village Launches in Singapore: A Wine App That Turns Grapes into Characters for Gen Z and Millennials
-

 Technology3 days ago
Highland and Bath Counties, Virginia Go Live on a Shared Caliber Hosted CAD Environment
-
 Technology3 days ago
JinkoSolar Unveils Tiger Neo 5.0 All-Black Residential Solar Module with 25.52% Efficiency
-

 Technology5 days ago
Lucid Poker Launches Cardle, Doug Polk’s Free Daily Poker Quiz, on the Web