
Technology
CENTEGIX Launches The Safety Signal Podcast, Where Crisis Meets Connection

Published
5 months agoon
By

New podcast hosted by CMO Robb Monkman and national school safety leader Ron Self debuts with Chief Development Officer Dr. Roderick Sams
ATLANTA, June 18, 2026 /PRNewswire/ — CENTEGIX, the leader in incident response and everyday safety solutions protecting more than 18 million people across 50 states, today announced the launch of The Safety Signal, a new podcast dedicated to the people, innovations, and conversations redefining what it means to feel safe at work.
Safety is earned in the moments most people never see. The Safety Signal brings you the people who live those moments, trading worst-case theory for what actually works.
Hosted by CENTEGIX Chief Marketing Officer, Robb Monkman, alongside co-host, Ron Self, a nationally recognized school safety leader, each episode bridges the gap between crisis and connection, bringing together educators, healthcare leaders, safety experts, and innovators to explore safety not just as a crisis response, but as a driver of culture, retention, trust, and organizational improvement.
“We are not just talking about technology,” said Monkman. “We are talking about the teacher who can focus on her students. The nurse who can focus on her patients. The leader who can focus on their people. That is what safety looks like when it actually works.”
Debut Episode: Safety as a School Improvement Issue
The first episode of The Safety Signal is available now, featuring CENTEGIX Chief Development Officer Dr. Roderick Sams, known to colleagues and partners as Rocky. A former award-winning principal, teacher, and coach, Dr. Sams brings a career built in classrooms and school buildings to a conversation about why safety sits at the center of every school improvement challenge facing leaders today.
Topics covered in the debut episode include the real cost of teacher turnover, the downstream impact of unsafe environments on enrollment and community trust, and what school leaders wish they had known sooner.
“Success is determined by where you end, not where you start,” said Dr. Sams. “Safe schools give every student and every educator a fighting chance at that.”
Where to Listen
The Safety Signal is available now at:
Website: https://www.centegix.com/resources/the-safety-signal-podcast
YouTube: https://www.youtube.com/watch?v=GJZvrdMqaTg
Spotify: Available now
Apple Podcasts: Available now
Amazon Music: Available now
Available wherever you get your podcasts.
About CENTEGIX
CENTEGIX is the leader in rapid incident response and everyday safety solutions, protecting more than 18 million people across 18,000+ locations in 50 states. The CENTEGIX Safety Platform, including CrisisAlert wearable panic buttons, Safety Blueprint critical incident mapping, Visitor Management, and Reunification, gives organizations the tools to plan for and respond to any emergency, from the everyday to the extreme. CENTEGIX serves K-12 and higher education, healthcare, government, commercial, and public safety organizations nationwide. CENTEGIX is backed by Charlesbank Capital Partners and Gauge Capital.
For more information visit www.centegix.com.
CONTACT: marketing@centegix.com
View original content to download multimedia:https://www.prnewswire.com/news-releases/centegix-launches-the-safety-signal-podcast-where-crisis-meets-connection-302803514.html
SOURCE CENTEGIX

You may like
Technology
Dover to Present at the Baird 2026 Global Industrial Conference
Published
1 second agoon
November 3, 2026By
DOWNERS GROVE, Ill., Nov. 3, 2026 /PRNewswire/ — Dover Corporation (NYSE: DOV) announced that its President and Chief Executive Officer, Richard J. Tobin, will speak at the Baird 2026 Global Industrial Conference in Chicago, Illinois, on Tuesday, November 10, 2026, at 9:40 am CT.
A link to the live audio webcast of the presentation will be available on dovercorporation.com, and the replay will be archived on the website for 90 days.
About Dover:
Dover is a diversified global manufacturer and solutions provider with annual revenue of over $8 billion. We deliver innovative equipment and components, consumable supplies, aftermarket parts, software and digital solutions, and support services through five operating segments: Engineered Products, Clean Energy & Fueling, Imaging & Identification, Pumps & Process Solutions and Climate & Sustainability Technologies. Dover combines global scale with operational agility to lead the markets we serve. Recognized for our entrepreneurial approach for over 70 years, our team of approximately 24,000 employees takes an ownership mindset, collaborating with customers to redefine what’s possible. Headquartered in Downers Grove, Illinois, Dover trades on the New York Stock Exchange under “DOV.” Additional information is available at dovercorporation.com.
Investor Contact:
Media Contact:
Jack Dickens
Adrian Sakowicz
Vice President – Investor Relations
Vice President – Communications
(630) 743-2566
(630) 743-5039
View original content to download multimedia:https://www.prnewswire.com/news-releases/dover-to-present-at-the-baird-2026-global-industrial-conference-302928119.html
SOURCE Dover
Technology
Thinkific Announces Third Quarter 2026 Financial Results
Published
3 seconds agoon
November 3, 2026By

Delivers positive Adjusted EBITDA of $1.8 million, 10% of Revenue
Thinkific reports in thousands of U.S. dollars and in accordance with IFRS.
VANCOUVER, BC, Nov. 3, 2026 /CNW/ — Thinkific Labs Inc. (“Thinkific” or the “Company”) (TSX: THNC), a premier learning commerce platform designed to scale external training programs, today announced its financial results for the quarter ended September 30, 2026.
“In the third quarter, we continued to build momentum in our move upmarket,” said Greg Smith, Founder and CEO of Thinkific. “Having reorganized the Company in September, we now possess the capacity to invest in and grow Thinkific Plus, while maintaining excellent support for our valued Self-Serve customers. With a leaner and more agile organization, I am confident in our ability to re-accelerate growth and create a financially strong Thinkific that is a durable partner for our customers and expanding go-to-market ecosystem. I am deeply grateful to our team for their remarkable passion, resilience, and execution during this transition. Together, we are building the future of AI-powered learning and delivering exceptional value to help our customers scale and succeed, as Thinkific will alongside them.”
Third Quarter Financial Highlights
(All comparisons are relative to the third quarter of 2025)
Total revenue for the third quarter of 2026 increased 2% to $19.0 million, above the guided range of $18.6 – $18.9 million, driven by strong Plus performance that helped ARPU(2) grow by 8% to $187 per month.
Thinkific Plus Subscription and Commerce revenue grew 18% to $5.7 million. Self-Serve Subscription and Commerce revenue decreased 3% to $13.3 million.Subscription revenue, in total, increased 3% to $15.5 million, with ARR(2) up 4% to $63.1 million.Commerce revenue, in total, increased 1% to $3.5 million, with GPV(2) processed through Thinkific Commerce growing 5% to $73.5 million. Thinkific Commerce penetration rate, measured as GPV(2) as a percent of GMV(2), increased to 69%, up from 61%.Gross margin remained flat at 73% in the third quarter of 2026.Net loss was $3.8 million, a decrease of $4.0 million from net income of $0.2 million. The decrease to a net loss position reflects the restructuring costs of $4.7 million ($4.1 million, net of stock-based compensation reversals) incurred in the quarter.Adjusted EBITDA(1) was $1.8 million, or 10% of revenue, an improvement of $0.8 million.Cash, cash equivalents and short-term investments were $50.3 million as of September 30, 2026.
Third Quarter Operational Highlights
On September 23, Thinkific announced a reorganization to accelerate growth in Thinkific Plus and sharpen operational focus. The move is expected to generate approximately $19 million in gross annualized cost savings and support a target free cash flow margin(1) of 25% in F2027.On September 10, Thinkific announced a product integration and commercial partnership with Articulate, which brings to market Articulate’s first native third-party LMS integration. Eligible customers licensed for both platforms can publish content created in Articulate 360 AI directly to Thinkific Plus with one click.On September 24, Thinkific achieved WCAG 2.1 certification, a widely recognized accessibility standard, supported by regular automated scanning and testing by people with disabilities. This positions Thinkific to expand sales to public-sector customers facing new federal accessibility deadlines.Product Innovation. Thinkific continued to accelerate improvements to Our Platform in the third quarter of 2026. Customers can now sell Thinker, our AI Teaching Assistant, as a premium add-on. Thinker can be bundled into any membership or bundle with per-learner access.Features that help Plus customers scale operations:Custom Roles lets customers create admins with exactly the access they need. Together with shared team licensing, multi-product bulk enrollment, and manage learner progress, it moves admin work that used to route through Thinkific Support into customers’ own hands. The release enabled us to expand six Plus customers with heavy role users.Group Experiences, a new paid Plus add-on, lets customers deliver white-labeled learning environments, each with its own branding and content, customized for each audience they serve.Learner Hub. The AI Widget Generator lets non-technical admins build custom experiences by describing them in plain language, now with live course and learner data. Native Learning Paths let customers sequence courses toward a specific learning objective or certification.Asset Library. Our Video Library is now an Asset Library, a top request from Plus customers. It gives them one place to upload, search, and reuse any media, not just video.Added Phased Subscription Pricing to Thinkific Plus Commerce, supporting “pay upfront, then membership” models for high-ticket and certification programs. All Thinkific Payments customers also gained improved checkout fraud detection and subscription management tools built for scale.
Outlook
For the fourth quarter of 2026, the Company expects revenue of $18.9 – $19.2 million, while improving Adjusted EBITDA(1) to a range of 20% to 25% of revenue.
Actual results may differ materially from Thinkific’s financial outlook as a result of, among other things, the factors described under “Forward-Looking Statements” below.
Quarterly Conference Call and Webcast Information
A conference call will be held at 5:00 PM ET (2:00 PM PT) on November 3, 2026 to discuss Thinkific’s third quarter of 2026 financial and operational results. To participate in the call, please dial 1.888.510.2154 (US/Canada toll-free) or 1.437.900.0527 (International/Toronto). For those unable to participate, a replay will be available an hour after the event by dialing 1.888.660.6345 (US/Canada toll-free) or 1.289.819.1450 (International/Toronto). The passcode is 86777#. The replay will expire at midnight ET on November 10, 2026. The conference call will also be available via webcast on the Investor Relations section of Thinkific’s website at investors.thinkific.com/events-and-presentations.
Thinkific’s unaudited condensed interim consolidated financial statements and accompanying notes, and Management’s Discussion and Analysis for the quarter ended September 30, 2026, are available on the Company’s website at www.thinkific.com and on SEDAR+ at www.sedarplus.ca.
About Thinkific
Thinkific (TSX:THNC) is an award-winning learning commerce platform where courses and community come together to power business growth. Thinkific gives academies, experts, and businesses everything they need to create and sell online learning experiences, build communities, and grow their revenue — all from one platform. Tens of thousands of customers — including companies like GoDaddy, Nasdaq, ActiveCampaign, and Datadog — have generated billions in revenue using Thinkific, impacting more than 200 million people worldwide.
For more information, please visit www.thinkific.com.
Non-IFRS Measures
The information presented within this press release includes “Adjusted EBITDA” and certain industry metrics. “Adjusted EBITDA” is not a recognized measure under International Financial Reporting Standards (“IFRS”) as issued by the International Accounting Standards Board, does not have a standardized meaning prescribed by IFRS, and is therefore unlikely to be comparable to similar measures presented by other companies. Rather, this measure is provided as additional information to complement those IFRS measures by providing further understanding of our results of operations from management’s perspective. Accordingly, it should not be considered in isolation nor as a substitute for analysis of our financial information reported under IFRS. We also use certain industry metrics: “Annual Recurring Revenue”, “Average Revenue per User”, “Gross Merchandise Volume” and “Gross Payments Volume”. These industry metrics are unaudited and are not directly derived from our financial statements. The non-IFRS measure and industry metrics are used to provide investors with supplemental measures of our operating performance and thus highlight trends in our core business that may not otherwise be apparent when relying solely on IFRS measures. We also believe that securities analysts, investors and other interested parties frequently use non-IFRS measures and industry metrics in the evaluation of issuers. Our management also uses the non-IFRS measure and industry metrics in order to facilitate operating performance comparisons from period to period, to prepare annual operating budgets and forecasts and to determine components of management compensation.
“Adjusted EBITDA” is defined as Net (loss) income excluding taxes, interest, depreciation and amortization (or EBITDA), as adjusted for stock-based compensation, foreign exchange loss (gain), finance income, restructuring costs, loss on disposal of property and equipment, and non-recurring equity transaction costs. Adjusted EBITDA does not have a standardized meaning under IFRS and is not a measure of operating income, operating performance or liquidity presented in accordance with IFRS, and is subject to important limitations.
“Free cash flow” is calculated as net cash provided by (used in) operating activities, less purchases of property and equipment and capitalized internal-use software development costs. “Free cash flow margin” is free cash flow expressed as a percentage of revenue. Management believes that free cash flow and free cash flow margin are useful measures of the Company’s ability to generate cash after accounting for capital expenditures required to maintain and grow the business. These measures provide investors with additional insight into the Company’s ability to fund future growth, pursue strategic transactions, and return capital to shareholders. Free cash flow and free cash flow margin do not have standardized meanings under IFRS, are not measures of financial performance or liquidity presented in accordance with IFRS, and are subject to important limitations. The Company’s definitions of free cash flow and free cash flow margin may differ from similarly titled measures used by other companies.
Please refer to “Reconciliation to IFRS from Non-IFRS measures” in this press release for more information.
Key Performance Indicators
We monitor the following industry metrics to help us evaluate our business, measure our performance, identify trends affecting our business, formulate business plans and make strategic decisions: “Annual Recurring Revenue” or “ARR”, “Average Revenue per User” or “ARPU”, “Gross Merchandise Volume” or “GMV”, and “Gross Payments Volume” or “GPV”. Our key performance indicators may be calculated in a manner different than similar key performance indicators used by other companies.
“ARPU” is the average monthly Revenue per Paying Customer in the quarter. ARPU is calculated by taking the average Revenue for each month in the quarter and dividing this by the average number of Paying Customers for the same quarter.
“ARR” is the annual value of all current Paying Customer subscriptions at the end of the period, with the number of Paying Customers multiplied by 12 times the average monthly subscription plan fee in effect on the last day of that period.
“GMV” is the total dollar value of all transactions of course sales, membership subscriptions, or other products or services by our customers, facilitated through Our Platform during the period, net of refunds. GMV does not include transactions processed by application programming interfaces or certain apps where the Company does not record the transaction value.
“GPV” is the total dollar value of transactions processed using Thinkific Payments in the period, net of refunds and inclusive of sales taxes where applicable. GPV does not represent revenue earned by us. Penetration rate is the percentage of GMV processed through Thinkific Payments, it is calculated by dividing GPV by GMV for the respective period. We believe that growth in GPV is an indicator of success of our customers in monetizing their learning products and of our Thinkific Payments offering. It is also a positive growth driver of revenue, which is derived from payment processing fees. Revenue earned from Thinkific Payments is included in our commerce revenue.
Forward-Looking Statements
This press release contains forward-looking information within the meaning of applicable securities laws in Canada. Forward-looking information may relate to the Company’s future financial outlook and anticipated events or results, including its financial position, business strategy, growth strategies, budgets, operations, financial results, plans and objectives. In some cases, forward-looking information can be identified by terminology such as “plans”, “targets”, “expects”, “continue”, “opportunity”, “estimates”, “outlook”, “strategy”, “intends”, “anticipates”, “believes”, or variations of such words and phrases, or statements that certain actions, events or results “may”, “could”, “would”, “might” or “will” “occur” or “be achieved”, and similar expressions, or the negative thereof. Statements containing forward-looking information are not historical facts but represent management’s expectations, estimates and projections regarding future events. Forward-looking statements in this press release include, but are not limited to, statements regarding our business strategy, financial results and expectations with respect to Adjusted EBITDA; our growth strategies, including the development and deployment of AI-powered features and tools; expectations regarding revenue and the revenue generation potential of Our Platform; objectives around growth and profitability; purchases of Common Shares under the NCIB; and our competitive position in our industry.
Forward-looking information is based on opinions, estimates and assumptions that, while considered by the Company to be appropriate and reasonable as of the date of this press release, are subject to known and unknown risks, uncertainties and other factors that may cause actual results to be materially different from those expressed or implied by such forward-looking information, including the Company’s ability to execute on its growth strategies; the impact of changing conditions and increasing competition in the global e-learning market; the Company’s ability to keep pace with technological and marketplace changes, including the ethical, legal and regulatory implications of artificial intelligence; the impact of macroeconomic conditions, geopolitical developments and trade policy uncertainty; fluctuations in currency exchange rates and volatility in financial markets; changes in financial condition and demand of our target market; developments and changes in applicable laws and regulations; and such other factors discussed in the “Risk Factors” section of our 2025 Annual Information Form (“AIF”).
Forward-looking information is necessarily based upon estimates and assumptions that are inherently subject to significant business, economic and competitive uncertainties, many of which are beyond the Company’s control. Assumptions underlying the Company’s expectations include, among others: our ability to continue investing in infrastructure to support our growth; our ability to maintain and enhance the functionality, performance, reliability, security and scalability of Our Platform; our ability to maintain existing customer relationships and acquire new customers; our ability to maintain relationships with service providers, suppliers, partners and other third parties; the continued development and success of new products, features and services; our ability to retain key personnel; our ability to execute on our growth plans; currency exchange and interest rates; the impact of competition; and changes and trends in our industry or the global economy. The foregoing list of assumptions cannot be considered exhaustive.
If any of these risks or uncertainties materialize, or if the opinions, estimates or assumptions underlying the forward-looking information prove incorrect, actual results or future events might vary materially from those anticipated in the forward-looking information. The opinions, estimates and assumptions referred to above are described in greater detail in “Summary of Factors Affecting our Performance” and in the “Risk Factors” section of the 2025 AIF, available on SEDAR+ at www.sedarplus.ca. Although we have attempted to identify important risk factors that could cause actual results to differ materially from those contained in forward-looking information, there may be other risk factors not presently known to us that could also cause actual results to differ materially. No forward-looking statement is a guarantee of future results. Accordingly, you should not place undue reliance on forward-looking information, which speaks only as of the date made. The forward-looking information contained in this press release represents our expectations as of the date specified herein and is subject to change after such date. However, we disclaim any intention or obligation to update or revise any forward-looking information, except as required under applicable securities laws.
All of the forward-looking information contained in this press release is expressly qualified by the foregoing cautionary statements. Readers are cautioned that any such forward-looking information should not be used for purposes other than for which it is disclosed.
THINKIFIC LABS INC.
Condensed Interim Consolidated Statements of Financial Position (unaudited)
Amounts expressed in thousands of U.S. dollars
As at September 30
As at December 31
2026
2025
Assets
Current assets
Cash and cash equivalents
$ 27,461
$ 7,837
Short-term investments
22,839
42,857
Trade and other receivables
4,105
5,209
Prepaid expenses and other assets
3,154
3,030
Contract acquisition assets
845
705
Total current assets
58,404
59,638
Property and equipment
389
530
Lease right-of-use assets
1,139
1,396
Contract acquisition assets
1,330
1,034
Intangible assets
158
181
Total assets
$ 61,420
$ 62,779
Liabilities and shareholders’ equity
Current liabilities
Accounts payable and accrued liabilities
$ 10,109
$ 7,357
Lease liabilities
338
342
Deferred revenue
11,946
10,697
Derivative liability
263
—
Total current liabilities
22,656
18,396
Lease liabilities
840
1,126
Total liabilities
23,496
19,522
Shareholders’ equity
Share capital
109,059
109,352
Contributed surplus
8,356
7,825
Accumulated other comprehensive loss
(301)
26
Accumulated deficit
(79,190)
(73,946)
Total shareholders’ equity
37,924
43,257
Total liabilities and shareholders’ equity
$ 61,420
$ 62,779
THINKIFIC LABS INC.
Condensed Interim Consolidated Statements of (Loss) Income and Comprehensive (Loss) Income (unaudited)
Amounts expressed in thousands of U.S. dollars, except share and per share amounts
Three months ended September 30
Nine months ended September 30
2026
2025
2026
2025
Revenue
$ 19,002
$ 18,574
$ 56,295
$ 54,516
Cost of revenue
5,121
5,027
15,497
14,519
Gross profit
13,881
13,547
40,798
39,997
Operating expenses
Sales and marketing
4,388
5,135
13,643
15,594
Research and development
6,270
5,542
19,529
15,786
General and administrative
3,015
3,099
10,122
9,881
Restructuring, net of stock-based compensation reversals
4,109
—
4,109
—
Total operating expenses
17,782
13,776
47,403
41,261
Operating loss
(3,901)
(229)
(6,605)
(1,264)
Other income
Finance income
117
541
1,461
1,854
Foreign exchange (loss) gain
(14)
(142)
(100)
353
Total other income
103
399
1,361
2,207
Net (loss) income
(3,798)
170
(5,244)
943
Other comprehensive (loss) income
Unrealized gain (loss) on derivatives
185
(308)
(327)
431
Total comprehensive (loss) income
$ (3,613)
$ (138)
$ (5,571)
$ 1,374
Weighted average number of common shares outstanding – basic
67,336,816
68,048,607
67,518,017
68,110,132
Weighted average number of common shares outstanding – diluted
67,336,816
68,698,731
67,518,017
68,941,424
(Loss) earnings per share
Basic and diluted
$ (0.06)
$ 0.00
$ (0.08)
$ 0.01
THINKIFIC LABS INC.
Condensed Interim Consolidated Statements of Cash Flows (unaudited)
Amounts expressed in thousands of U.S. dollars
Nine months ended September 30
2026
2025
Operating activities
Net (loss) income
$ (5,244)
$ 943
Items not affecting cash and cash equivalents:
Depreciation and amortization
1,051
1,010
Loss on disposal of property and equipment
44
—
Stock-based compensation
3,031
2,981
Unrealized foreign exchange gain
(369)
(394)
Finance income
(1,461)
(1,854)
Interest received
1,434
2,246
Changes in non-cash working capital:
Trade and other receivables
1,106
268
Prepaid expenses and other assets
(187)
83
Contract acquisition assets
(1,050)
(685)
Accounts payable and accrued liabilities
2,187
292
Deferred revenue
1,249
1,192
Cash from operating activities
$ 1,791
$ 6,082
Investing activities
Proceeds on maturity of short-term investments
20,000
—
Investment in property and equipment and intangible assets
(60)
(159)
Cash from (used in) investing activities
$ 19,940
$ (159)
Financing activities
Operating lease payments
(276)
(325)
Exercise of stock options
7
46
Tax remittances on stock-based compensation
(416)
(986)
Shares repurchased for cancellation and other equity-related costs
(1,393)
(2,609)
Directors compensation and DSU settlements
(346)
—
Cash used in financing activities
$ (2,424)
$ (3,874)
Effect of exchange rate fluctuations on cash and cash equivalents held
317
201
Increase in cash and cash equivalents
19,624
2,250
Cash and cash equivalents, beginning of period
7,837
49,492
Cash and cash equivalents, end of period
$ 27,461
$ 51,742
THINKIFIC LABS INC.
Reconciliation from IFRS to Non-IFRS Measures (unaudited)
Amounts expressed in thousands of U.S. dollars
Three months ended September 30
Nine months ended September 30
(in thousands of U.S. dollars)
2026
2025
2026
2025
Net (loss) income
$ (3,798)
$ 170
$ (5,244)
$ 943
Stock-based compensation
1,250
962
3,031
2,981
Depreciation and amortization
364
323
1,051
1,010
Foreign exchange loss (gain)
14
142
100
(353)
Finance income
(117)
(541)
(1,461)
(1,854)
Restructuring costs
4,109
—
4,109
—
Non-recurring equity transaction costs
—
—
—
302
Adjusted EBITDA
$ 1,822
$ 1,056
$ 1,586
$ 3,029
SOURCE Thinkific Labs Inc.
Technology
Jack Henry & Associates, Inc. Reports First Quarter Fiscal 2027 Results
Published
4 seconds agoon
November 3, 2026By
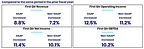
First quarter summary:
GAAP revenue increased 8.8% and GAAP operating income increased 12.5% for the fiscal three months ended September 30, 2026, compared to the prior fiscal year quarter.Non-GAAP adjusted revenue increased 7.2% and non-GAAP adjusted operating income increased 11.2% for the fiscal three months ended September 30, 2026, compared to the prior fiscal year quarter.1GAAP EPS was $2.28 per diluted share for the fiscal three months ended September 30, 2026, compared to $1.97 per diluted share in the prior fiscal year quarter, representing growth of 15.6%.Cash and cash equivalents were $25.4 million at September 30, 2026, and $36.2 million at September 30, 2025.Debt outstanding for credit facilities was $85 million at September 30, 2026, and $20 million at September 30, 2025.Stock repurchases for the fiscal three months ended September 30, 2026, were $71 million at an average price of $153.47 per share.
Full year fiscal 2027 guidance (Dollars in millions, other than per share amounts):3
Current
GAAP
Low
High
Revenue
$2,698
$2,718
Operating margin4
24.7 %
24.9 %
EPS
$7.47
$7.51
Non-GAAP5
Adjusted revenue
$2,667
$2,687
Adjusted operating margin
24.1 %
24.3 %
MONETT, Mo., Nov. 3, 2026 /PRNewswire/ — Jack Henry & Associates, Inc. (Nasdaq: JKHY), a leading financial technology provider, today announced results for fiscal first quarter ended September 30, 2026.
According to Greg Adelson, President and CEO, “We continued our positive momentum in the first quarter of fiscal 2027, delivering record financial results that exceeded the outlook we provided in August. The demand environment remains very strong, as reflected in our outstanding sales performance and robust pipeline. We are extremely pleased with the start of our fiscal year and based on improved revenue drivers, we again exceeded consensus expectations. We are confident in our ability to continue delivering consistent, long-term results through an unwavering commitment to culture, service, innovation, strategy, and execution.”
1 See tables below on page 4 reconciling non-GAAP financial measures to GAAP.
2See table below on page 13 reconciling net income to non-GAAP EBITDA.
3 The full fiscal year guidance assumes no acquisitions or dispositions will be made during fiscal year 2027.
4Operating margin is calculated by dividing operating income by revenue.
5See tables below on page 7 reconciling fiscal year 2027 GAAP to non-GAAP guidance.
Operating Results
Revenue, operating expenses, operating income, and net income for the fiscal three months ended September 30, 2026, compared to the fiscal three months ended September 30, 2025, were as follows:
Revenue
(Unaudited, dollars in thousands)
Three Months Ended
September 30,
% Change
2026
2025
Revenue
Services and Support
$ 404,961
$ 376,851
7.5 %
Percentage of Total Revenue
57.7 %
58.5 %
Processing
296,586
267,887
10.7 %
Percentage of Total Revenue
42.3 %
41.5 %
REVENUE
$ 701,547
$ 644,738
8.8 %
Services and support revenue increased for the fiscal three months ended September 30, 2026, compared to the fiscal three months ended September 30, 2025, primarily driven by growth in hosting revenue of 11.7% as new and existing clients continue to migrate to our private cloud and processing volumes expand, an increase in deconversion revenue of $9,292, as well as an increase in software usage revenue of 9.9%, partially offset by the decrease in revenue related to the timing of our Connect conference, which was held in the first quarter of fiscal 2026 and the second quarter of 2027. Processing revenue increased for the fiscal three months ended September 30, 2026, compared to the fiscal three months ended September 30, 2025, mainly driven by growth in card revenue of 9.4% from monthly service and risk management fees, improvement in digital and transaction revenue of 13.3% from a higher number of active users on our digital platform and from the ramping up of additional products, as well as a rise in faster payments revenue of 43.8% from expanding transactional volumes.For the fiscal three months ended September 30, 2026, compared to the fiscal three months ended September 30, 2025, core segment revenue increased 7.1%, payments segment revenue increased 9.2%, complementary segment revenue increased 10.4%, and corporate services segment revenue increased 6.2%. For the fiscal three months ended September 30, 2026, compared to the fiscal three months ended September 30, 2025, core segment non-GAAP adjusted revenue increased 4.9%, payments segment non-GAAP adjusted revenue increased 8.3%, complementary segment non-GAAP adjusted revenue increased 8.4%, and corporate services non-GAAP adjusted segment revenue increased 5.2%. Total non-GAAP adjusted revenue increased 7.2% for the same comparative periods (see revenue lines of segment break-out tables on pages 5 and 6 below for a reconciliation of GAAP segment revenue to non-GAAP adjusted segment revenue).
Operating Expenses and Operating Income
(Unaudited, dollars in thousands)
Three Months Ended
September 30,
% Change
2026
2025
Cost of Revenue
$ 376,046
$ 348,566
7.9 %
Percentage of Total Revenue6
53.6 %
54.1 %
Research and Development
45,781
39,278
16.6 %
Percentage of Total Revenue6
6.5 %
6.1 %
Selling, General, and Administrative
72,649
72,829
(0.2) %
Percentage of Total Revenue6
10.4 %
11.3 %
OPERATING EXPENSES
494,476
460,673
7.3 %
OPERATING INCOME
$ 207,071
$ 184,065
12.5 %
Operating Margin6
29.5 %
28.5 %
Cost of revenue increased for the fiscal three months ended September 30, 2026, compared to the fiscal three months ended September 30, 2025, primarily due to higher personnel costs, including compensation and benefit costs, partly related to trailing twelve month headcount growth, higher direct costs generally consistent with increases in related lines of revenue, higher cloud consumption costs, including artificial intelligence and security costs, increased licenses and fees, including infrastructure costs, as well as higher amortization of intangibles, partially offset by the increase in labor cost deferral.Research and development expense increased for the fiscal three months ended September 30, 2026, compared to the fiscal three months ended September 30, 2025, primarily due to higher personnel costs (net of capitalization), including compensation and benefit costs, partly related to trailing twelve month headcount growth.Selling, general, and administrative expense decreased for the fiscal three months ended September 30, 2026, compared to the fiscal three months ended September 30, 2025, mainly due to lower expenses related to the timing of our Connect conference.
Net Income
(Unaudited, dollars in thousands,
except per share data)
Three Months Ended
September 30,
% Change
2026
2025
Income Before Income Taxes
$ 210,635
$ 190,318
10.7 %
Provision for Income Taxes
50,223
46,332
8.4 %
NET INCOME
$ 160,412
$ 143,986
11.4 %
Diluted earnings per share
$ 2.28
$ 1.97
15.6 %
Effective tax rates for the fiscal three months ended September 30, 2026, and September 30, 2025, were 23.8% and 24.3%, respectively.
According to Mimi Carsley, CFO and Treasurer, “During the first quarter of the fiscal year, we delivered solid 7.2% non-GAAP revenue growth aided by key areas such as Cloud, Card, and Digital, with continued Faster Payments momentum. Revenue growth and leverage in our business model contributed to non-GAAP operating income margin of 28.2% and an outstanding ROIC of 23.2%”
6Operating margin is calculated by dividing operating income by revenue. Operating margin plus operating expense components as a percentage of total revenue may not equal 100% due to rounding.
Impact of Non-GAAP Adjustments
The tables below show our revenue, operating income, and net income for the fiscal three months ended September 30, 2026, compared to the fiscal three months ended September 30, 2025, excluding the impacts of deconversions and the effects of the prior fiscal year acquisition of Victor Technologies in the current fiscal quarter ended September 30, 2026, and the impacts of deconversions and the gain on assets, net, in the prior fiscal quarter ended September 30, 2025.
(Unaudited, dollars in thousands)
Three Months Ended September 30,
%
Change
2026
2025
GAAP Revenue*
$ 701,547
$ 644,738
8.8 %
Adjustments:
Deconversion revenue
(17,918)
(8,626)
Revenue from the acquisition
(1,451)
—
NON-GAAP ADJUSTED REVENUE*
$ 682,178
$ 636,112
7.2 %
GAAP Operating Income
$ 207,071
$ 184,065
12.5 %
Adjustments:
Operating income from deconversions
(15,199)
(7,101)
Gain on assets, net
—
(3,796)
Operating loss from the acquisition
759
—
NON-GAAP ADJUSTED OPERATING INCOME
$ 192,631
$ 173,168
11.2 %
Non-GAAP Adjusted Operating Margin**
28.2 %
27.2 %
GAAP Net Income
$ 160,412
$ 143,986
11.4 %
Adjustments:***
Net income from deconversions
(15,199)
(7,101)
Gain on assets, net
—
(3,796)
Net loss from the acquisition
759
—
Tax impact of adjustments
3,466
2,615
NON-GAAP ADJUSTED NET INCOME
$ 149,438
$ 135,704
10.1 %
*GAAP revenue is comprised of services and support and processing revenues (see page 2). Services and support revenue less deconversion revenue for the fiscal three months ended September 30, 2026, and 2025, which was $17,918 for the current fiscal year quarter and $8,626 for the prior fiscal year quarter, results in non-GAAP adjusted services and support revenue growth of 5.1% compared to the prior fiscal year quarter. Processing revenue less revenue excluding the effects of a prior year acquisition for the fiscal three months ended September 30, 2026, of $1,451, results in non-GAAP adjusted processing revenue growth of 10.2% compared to the prior fiscal year quarter.
**Non-GAAP adjusted operating margin is calculated by dividing non-GAAP adjusted operating income by non-GAAP adjusted revenue.
***The non-GAAP net income adjustments below are first listed before tax and then the tax impact is presented as a combined tax impact of all adjustments. The tax impact of adjustments is calculated using a tax rate of 24% for the fiscal three months ended September 30, 2026, and 2025. The tax rate for non-GAAP adjustment items takes a broad look at the Company’s recurring tax adjustments and applies them to non-GAAP revenue that does not have its own specific tax impacts.
The tables below show the segment break-out of revenue and cost of revenue for each period presented, as adjusted for the items above, and include a reconciliation to non-GAAP adjusted operating income presented above.
Three Months Ended September 30, 2026
(Unaudited, dollars in thousands)
Core
Payments
Complementary
Corporate
Services
Total
GAAP REVENUE
$ 203,411
$ 252,111
$ 220,176
$ 25,849
$ 701,547
Non-GAAP adjustments*
(7,411)
(5,764)
(5,905)
(289)
(19,369)
NON-GAAP ADJUSTED REVENUE
196,000
246,347
214,271
25,560
682,178
GAAP COST OF REVENUE
76,204
125,318
74,776
99,748
376,046
Non-GAAP adjustments*
(888)
(1,591)
(446)
(114)
(3,039)
NON-GAAP ADJUSTED COST OF REVENUE
75,316
123,727
74,330
99,634
373,007
GAAP SEGMENT INCOME
$ 127,207
$ 126,793
$ 145,400
$ (73,899)
Segment Income Margin**
62.5 %
50.3 %
66.0 %
(285.9) %
NON-GAAP ADJUSTED SEGMENT INCOME
$ 120,684
$ 122,620
$ 139,941
$ (74,074)
Non-GAAP Adjusted Segment Income Margin**
61.6 %
49.8 %
65.3 %
(289.8) %
Research and Development
45,781
Selling, General, and Administrative
72,649
Non-GAAP adjustments unassigned to a segment***
(1,890)
NON-GAAP TOTAL ADJUSTED OPERATING EXPENSES
489,547
NON-GAAP ADJUSTED OPERATING INCOME
$ 192,631
*Revenue non-GAAP adjustments for the Payments segment were ($1,451) of revenue related to the acquired company and ($4,313) of deconversion revenue. Revenue non-GAAP adjustments for the remainder of the segments were deconversion revenue. Cost of revenue non-GAAP adjustments for the Payments segment were ($1,427) of costs related to the acquired company and ($164) of deconversion costs. Cost of revenue non-GAAP adjustments for the Corporate Services segment were ($105) of costs related to the acquired company and ($9) of deconversion costs. Cost of revenue non-GAAP adjustments for the remainder of the segments were deconversion costs.
**Segment income margin is calculated by dividing segment income by revenue for each segment. Non-GAAP adjusted segment income margin is calculated by dividing non-GAAP adjusted segment income by non-GAAP adjusted revenue for each segment.
***Non-GAAP adjustments unassigned to a segment were deconversion costs of $1,212, research and development costs related to the acquired company of $658, and selling, general, and administrative costs related to the acquired company of $20.
Three Months Ended September 30, 2025
(Unaudited, dollars in thousands)
Core
Payments
Complementary
Corporate
Services
Total
GAAP REVENUE
$ 190,001
$ 230,894
$ 199,509
$ 24,334
$ 644,738
Non-GAAP adjustments*
(3,219)
(3,483)
(1,876)
(48)
(8,626)
NON-GAAP ADJUSTED REVENUE
186,782
227,411
197,633
24,286
636,112
GAAP COST OF REVENUE
71,634
118,660
73,006
85,266
348,566
Non-GAAP adjustments*
(443)
(151)
(308)
(2)
(904)
NON-GAAP ADJUSTED COST OF REVENUE
71,191
118,509
72,698
85,264
347,662
GAAP SEGMENT INCOME
$ 118,367
$ 112,234
$ 126,503
$ (60,932)
Segment Income Margin**
62.3 %
48.6 %
63.4 %
(250.4) %
NON-GAAP ADJUSTED SEGMENT INCOME
$ 115,591
$ 108,902
$ 124,935
$ (60,978)
Non-GAAP Adjusted Segment Income Margin
61.9 %
47.9 %
63.2 %
(251.1) %
Research and Development
39,278
Selling, General, and Administrative
72,829
Non-GAAP adjustments unassigned to a segment***
3,175
NON-GAAP TOTAL ADJUSTED OPERATING EXPENSES
462,944
NON-GAAP ADJUSTED OPERATING INCOME
$ 173,168
*Revenue non-GAAP adjustments for the segments were deconversion revenue. Cost of revenue non-GAAP adjustments for the segments were deconversion costs.
**Segment income margin is calculated by dividing segment income by revenue for each segment. Non-GAAP adjusted segment income margin is calculated by dividing non-GAAP adjusted segment income by non-GAAP adjusted revenue for each segment.
***Non-GAAP adjustments unassigned to a segment were a gain on assets, net, of $3,796 less deconversion costs of $621.
The table below shows our GAAP to non-GAAP guidance for the fiscal year ending June 30, 2027. Fiscal year 2027 non-GAAP guidance excludes the impacts of deconversion revenue and related operating expenses, acquisition revenues and related operating expenses, and the gain on assets, net, and assumes no additional acquisitions or dispositions will be made during the fiscal year.
GAAP to Non-GAAP GUIDANCE
(Dollars in millions, except per share data)
Annual FY’27
Adjusted for
FY’27
Comparison
Reported
Change
(Acquisition)
Low
High
FY26
FY26
FY26
GAAP REVENUE
$ 2,698
$ 2,718
$ 2,544
$ 2,544
$ —
Growth
6.0 %
6.8 %
Deconversions*
30
30
43
43
—
Acquisition
1
1
—
5
(5)
NON-GAAP ADJUSTED REVENUE**
$ 2,667
$ 2,687
$ 2,502
$ 2,496
$ 5
Non-GAAP Adjusted Growth
6.6 %
7.4 %
GAAP OPERATING EXPENSES
$ 2,033
$ 2,043
$ 1,909
$ 1,909
$ —
Growth
6.5 %
7.0 %
Deconversion costs*
7
7
13
13
—
Acquisition costs
2
2
—
8
(8)
Gain on assets, net
—
—
(7)
(7)
—
NON-GAAP ADJUSTED OPERATING
EXPENSES**
$ 2,024
$ 2,033
$ 1,903
$ 1,895
$ 8
Non-GAAP Adjusted Growth
6.3 %
6.8 %
GAAP OPERATING INCOME
$ 665
$ 676
$ 635
$ 635
$ —
Growth
4.8 %
6.4 %
GAAP OPERATING MARGIN
24.7 %
24.9 %
25.0 %
25.0 %
NON-GAAP ADJUSTED OPERATING INCOME**
$ 643
$ 653
$ 598
$ 601
$ (3)
Non-GAAP Adjusted Growth
7.5 %
9.2 %
NON-GAAP ADJUSTED OPERATING MARGIN
24.1 %
24.3 %
23.9 %
24.1 %
GAAP EPS
$ 7.47
$ 7.51
$ 6.98
$ 6.98
$ —
Growth
7.1 %
7.6 %
*Deconversion revenue and related operating expenses are based on actual results for the fiscal three months ended September 30, 2026, and estimates for the remainder of the fiscal year 2027. See the Company’s Form 8-K filed with the Securities and Exchange Commission on October 29, 2026.
**GAAP to Non-GAAP revenue, operating expenses, and operating income may not foot due to rounding.
Balance Sheet and Cash Flow Review
Cash and cash equivalents were $25 million at September 30, 2026, compared to $36 million at September 30, 2025.Trade receivables were $346 million at September 30, 2026, and $308 million at September 30, 2025. The Company had $85 million of borrowings at September 30, 2026, compared to $20 million of borrowings at September 30, 2025.Deferred revenue was $333 million at September 30, 2026, compared to $321 million at September 30, 2025.Stockholders’ equity decreased to $2,100 million at September 30, 2026, compared to $2,173 million at September 30, 2025.
*See table below for Net Cash From Operating Activities and on page 13 for Return on Average Stockholders’ Equity. Tables reconciling the non-GAAP measures Free Cash Flow and Net Operating Profit After Tax Return on Invested Capital (NOPAT ROIC) to GAAP measures are on pages 13 and 14. See the Use of Non-GAAP Financial Information section below for the definitions of Free Cash Flow and NOPAT ROIC.
The following table summarizes net cash from operating activities:
(Unaudited, dollars in thousands)
Three Months Ended September 30,
2026
2025
Net income
$ 160,412
$ 143,986
Depreciation
11,245
10,434
Amortization
44,593
41,458
Change in deferred income taxes
11,354
38,987
Other non-cash expenses
4,578
2,510
Change in receivables
3,288
12,196
Change in deferred revenue
(39,724)
(42,291)
Change in other assets and liabilities*
(34,493)
(86,690)
NET CASH FROM OPERATING ACTIVITIES
$ 161,253
$ 120,590
*For the fiscal three months ended September 30, 2026, the change in other assets and liabilities includes the change in accrued expenses of $(34,551), the change in prepaid expenses, deferred costs and other of $(31,640), and the change in accounts payable of $(4,123), partially offset by the change in income taxes of $35,821. For the fiscal three months ended September 30, 2025, the change in other assets and liabilities includes the change in accrued expenses of $(36,567), the change in prepaid expenses, deferred costs and other of $(34,336), the change in income taxes of $(9,150), and the change in accounts payable of $(6,637).
The following table summarizes net cash from investing activities:
(Unaudited, dollars in thousands)
Three Months Ended September 30,
2026
2025
Payment for acquisitions
$ —
$ (42,390)
Capital expenditures
(26,960)
(8,880)
Proceeds from sale of assets
—
7,479
Purchased software
(1,577)
(1,509)
Computer software developed
(49,784)
(48,203)
Purchase of investments
(1,000)
(6,000)
Proceeds from investments
4,000
1,000
NET CASH FROM INVESTING ACTIVITIES
$ (75,321)
$ (98,503)
The following table summarizes net cash from financing activities:
(Unaudited, dollars in thousands)
Three Months Ended September 30,
2026
2025
Borrowings on credit facilities
$ 188,000
$ 20,000
Repayments on credit facilities
(143,000)
—
Purchase of treasury stock
(70,903)
(62,045)
Dividends paid
(42,768)
(42,145)
Net cash from issuance of stock and tax related to stock-based
compensation
(3,961)
(3,611)
NET CASH FROM FINANCING ACTIVITIES
$ (72,632)
$ (87,801)
Use of Non-GAAP Financial Information
Generally Accepted Accounting Principles (GAAP) is the term used to refer to the standard framework of guidelines for financial accounting in the United States. GAAP includes the standards, conventions, and rules accountants follow in recording and summarizing transactions in the preparation of financial statements. In addition to reporting financial results in accordance with GAAP, we have provided certain non-GAAP financial measures, including adjusted revenue, adjusted segment revenue, adjusted operating income, adjusted segment income, adjusted cost of revenue, adjusted segment cost of revenue, adjusted operating expenses, adjusted operating margin, adjusted segment income margin, non-GAAP earnings before interest, taxes, depreciation, and amortization (non-GAAP EBITDA), free cash flow, free cash flow conversion, net operating profit after tax return on invested capital (NOPAT ROIC), and non-GAAP adjusted net income. We also present key revenue, which is the sum of cloud services revenue and processing revenue, and non-key revenue, which is all other GAAP revenue. Key revenue and non-key revenue are components of GAAP revenue and are presented because management views key revenue as the strategic recurring revenue of the business most important for long-term growth.
We believe non-GAAP financial measures help investors better understand the underlying fundamentals and operating performance of our business. Adjusted revenue, adjusted segment revenue, adjusted operating income, adjusted operating margin, adjusted segment income, adjusted segment income margin, adjusted cost of revenue, adjusted segment cost of revenue, adjusted operating expenses, and adjusted net income eliminate deconversion revenue and associated costs, the gain on assets, net, and an acquisition, which management believes are not indicative of the Company’s operating performance. Such adjustments give investors further insight into our performance. Non-GAAP EBITDA is defined as net income attributable to the Company before the effect of interest income, net, taxes, depreciation, and amortization, adjusted for net income before the effect of interest income, net, taxes, depreciation, and amortization attributable to eliminated deconversions, the gain on assets, net, and an acquisition. Free cash flow is defined as net cash from operating activities, less capitalized expenditures, internal use software, and capitalized software, plus proceeds from the sale of assets. NOPAT ROIC is defined as operating income for the trailing four quarters multiplied by one minus the average effective tax rate (ETR) for the trailing four quarters, with the result divided by average invested capital (average of the beginning and ending period balances). Free cash flow conversion is defined as free cash flow, less proceeds from sale of assets, divided by net income. Management believes that non-GAAP EBITDA is an important measure of the Company’s overall operating performance and excludes certain costs and other transactions that management does not consider indicative of the Company’s ongoing operating performance; free cash flow is useful to measure the funds generated in a given period that are available for debt service requirements and strategic capital decisions; free cash flow conversion is useful to measure the efficiency with which operating results are converted into free cash flow; and NOPAT ROIC is a measure of the Company’s allocation efficiency and effectiveness of its invested capital. For these reasons, management also uses these non-GAAP financial measures in its assessment and management of the Company’s performance.
Non-GAAP financial measures used by the Company may not be comparable to similarly titled non-GAAP measures used by other companies. Non-GAAP financial measures have no standardized meaning prescribed by GAAP and therefore, are unlikely to be comparable with calculations of similar measures for other companies.
Any non-GAAP financial measures should be considered in context with the GAAP financial presentation and should not be considered in isolation or as a substitute for GAAP measures. Reconciliations of the non-GAAP financial measures to related GAAP measures are included.
About Jack Henry & Associates, Inc.®
Jack Henry® (Nasdaq: JKHY) is a well-rounded financial technology company that strengthens connections between financial institutions and the people and businesses they serve. We are an S&P 500 company that prioritizes openness, collaboration, and user centricity — offering banks and credit unions a vibrant ecosystem of internally developed modern capabilities as well as the ability to integrate with leading fintechs. For 50 years, Jack Henry has provided technology solutions to enable clients to innovate faster, strategically differentiate, and successfully compete while serving the evolving needs of their accountholders. We empower approximately 7,200 clients with people-inspired innovation, personal service, and insight-driven solutions that help reduce the barriers to financial health. Additional information is available at www.jackhenry.com.
Quarterly Conference Call
The Company will hold a conference call on November 4, 2026, at 7:45 a.m. Central Time, and investors are invited to listen at www.jackhenry.com. A webcast replay will be available approximately one hour after the event at ir.jackhenry.com/corporate-events-and-presentations and will remain available for one year.
Statements made in this news release that are not historical facts, including the Company’s fiscal 2027 guidance and statements regarding future performance, are “forward-looking statements” within the meaning of the Private Securities Litigation Reform Act of 1995, Section 27A of the Securities Act of 1933 and Section 21E of the Securities Exchange Act of 1934. Because forward-looking statements relate to the future, they are subject to inherent risks and uncertainties that could cause actual results to differ materially from those expressed or implied by such statements. Such risks and uncertainties include, but are not limited to, those discussed in the Company’s Securities and Exchange Commission filings, including the Company’s most recent reports on Form 10-K and Form 10-Q, particularly under the heading Risk Factors. Any forward-looking statement made in this news release speaks only as of the date of the news release, and the Company expressly disclaims any obligation to publicly update or revise any forward-looking statement, whether because of new information, future events or otherwise.
Consolidated Statements of Income (Unaudited)
(Dollars in thousands, except per share data)
Three Months Ended September 30,
%
Change
2026
2025
REVENUE
$ 701,547
$ 644,738
8.8 %
Cost of Revenue
376,046
348,566
7.9 %
Research and Development
45,781
39,278
16.6 %
Selling, General, and Administrative
72,649
72,829
(0.2) %
EXPENSES
494,476
460,673
7.3 %
OPERATING INCOME
207,071
184,065
12.5 %
Interest income
5,092
7,139
(28.7) %
Interest expense
(1,528)
(886)
72.5 %
Interest Income, net
3,564
6,253
(43.0) %
INCOME BEFORE INCOME TAXES
210,635
190,318
10.7 %
Provision for Income Taxes
50,223
46,332
8.4 %
NET INCOME
$ 160,412
$ 143,986
11.4 %
Diluted net income per share
$ 2.28
$ 1.97
Diluted weighted average shares outstanding
70,262
72,909
Consolidated Balance Sheet Highlights (Unaudited)
(Dollars in thousands)
September 30,
%
Change
2026
2025
Cash and cash equivalents
$ 25,356
$ 36,239
(30.0) %
Receivables
345,823
307,647
12.4 %
Total assets
3,194,748
3,047,572
4.8 %
Accounts payable and accrued expenses
$ 247,007
$ 190,667
29.5 %
Debt
85,000
20,000
325.0 %
Deferred revenue
332,747
321,082
3.6 %
Stockholders’ equity
2,099,643
2,173,334
(3.4) %
Calculation of Non-GAAP Earnings Before Interest Income, Net, Income Taxes, Depreciation and Amortization
(Non-GAAP EBITDA)
Three Months Ended September 30,
%
Change
(Dollars in thousands)
2026
2025
Net income
$ 160,412
$ 143,986
Net interest
(3,564)
(6,253)
Taxes
50,223
46,331
Depreciation and amortization
55,839
51,892
Less: Net income before interest expense, taxes, depreciation and
amortization attributable to eliminated non-GAAP adjustments*
(14,925)
(10,897)
NON-GAAP EBITDA
$ 247,985
$ 225,059
10.2 %
*The fiscal first quarter 2027 and 2026 adjustments for net income before interest expense, taxes, depreciation and amortization were for deconversions of ($15,199) and an acquisition of $274, and were for deconversions of ($7,101) and a gain on assets, net, of ($3,796), respectively.
Calculation of Free Cash Flow (Non-GAAP)
Three Months Ended
September 30,
(Dollars in thousands)
2026
2025
Net cash from operating activities
$ 161,253
$ 120,590
Capitalized expenditures
(26,960)
(8,880)
Internal use software
(1,577)
(1,509)
Proceeds from sale of assets
—
7,479
Capitalized software
(49,784)
(48,203)
FREE CASH FLOW
$ 82,932
$ 69,477
Net income
$ 160,412
$ 143,986
Operating cash conversion*
100.5 %
83.8 %
Free cash flow conversion (excluding proceeds from sale of assets)*
51.7 %
43.1 %
*Operating cash conversion is net cash from operating activities divided by net income. Free cash flow conversion is free cash flow less proceeds from sale of assets of $0 for the fiscal three months ended September 30, 2026, and $7,479 for the three months ended September 30, 2025, divided by net income.
Calculation of the Return on Average Stockholders’ Equity
September 30,
(Dollars in thousands)
2026
2025
Net income (trailing four quarters)
$ 519,202
$ 480,543
Average stockholders’ equity (period beginning and ending balances)
2,136,489
2,049,181
RETURN ON AVERAGE STOCKHOLDERS’ EQUITY
24.3 %
23.5 %
Calculation of NOPAT ROIC (Non-GAAP)
September 30,
(Dollars in thousands)
2026
2025
Operating income (trailing four quarters)
$ 658,039
$ 601,504
Average Effective Tax Rate (trailing four quarters)
22.7 %
22.4 %
NOPAT operating income (trailing four quarters)*
508,664
466,767
Average stockholders’ equity (period beginning and ending balances)
2,136,489
2,049,181
Average current maturities of long-term debt (period beginning and
ending balances)
—
45,000
Average long-term debt (period beginning and ending balances)
52,500
35,000
Average invested capital (period beginning and ending balances)
2,188,989
2,129,181
NOPAT ROIC
23.2 %
21.9 %
*NOPAT operating income is calculated by multiplying the trailing four quarters operating income by one minus the average ETR. NOPAT ROIC is calculated by dividing NOPAT operating income by average invested capital (period beginning and ending balances).
Reconciliation of Key and Non-Key Revenue
Three Months Ended
September 30,
%
Change
(Dollars in thousands)
2026
2025
GAAP REVENUE
$ 701,547
$ 644,738
8.8 %
Cloud Services
217,701
195,609
11.3 %
Percentage of Total Revenue*
31.0 %
30.3 %
Processing
296,586
267,887
10.7 %
Percentage of Total Revenue*
42.3 %
41.5 %
KEY REVENUE
$ 514,287
$ 463,496
11.0 %
Percentage of Total Revenue*
73.3 %
71.9 %
NON-KEY REVENUE
$ 187,260
$ 181,242
3.3 %
Percentage of Total Revenue*
26.7 %
28.1 %
*Key and non-key revenue components as a percentage of total revenue may not equal 100% due to rounding.
FAQ for Analysts / Investors
(Dollars in thousands)
1. Why does Core segment revenue growth appear to have moderated this quarter?
The current quarter is being compared against a prior year period that included elevated one-time revenues from on-premise implementations and consulting engagements. Excluding those one-time items, growth in key recurring areas of the Core segment grew 8.6%, which is a positive indicator of the ongoing strength of the segment.
2. Why did the Company rename “Public and Private Cloud” revenue to “Cloud Services”?
The Company made this change beginning in the first quarter of fiscal 2027 to simplify presentation and improve clarity. This does not represent any change to the products or services we offer or to previously reported financial results, and prior period amounts are presented on a consistent basis.
3. What were the first quarter of fiscal 2026 segment reclassifications?
During the first quarter of fiscal 2027, the Company transferred a product from the Core segment to the Complementary segment for better alignment. Therefore, first quarter of fiscal 2026 results were recast. Revenue of $5,292 and cost of revenue of $746 were reclassified. Other reclassifications unrelated to the product transfer noted above were $757 of cost of revenue reclassified from Core to Corporate Services to align with current allocation of cost of revenue by segment. These changes are segment-level only and do not affect consolidated results.
4. What is the timing of the Connect Conference?
The Connect Conference is Jack Henry’s annual client conference. The revenue and expenses associated with the conference are included in the Corporate Services segment. The event was held in the first quarter of fiscal 2026 and is in the the second quarter of fiscal 2027. The event will be held in the second quarter for the next four years.
View original content to download multimedia:https://www.prnewswire.com/news-releases/jack-henry–associates-inc-reports-first-quarter-fiscal-2027-results-302928417.html
SOURCE Jack Henry & Associates, Inc.

Dover to Present at the Baird 2026 Global Industrial Conference

Thinkific Announces Third Quarter 2026 Financial Results

Jack Henry & Associates, Inc. Reports First Quarter Fiscal 2027 Results

Send Rakhi to UK swiftly with UK Gifts Portal

Whiteboard Series with NEAR | Ep: 45 Joel Thorstensson from ceramic.network

Nullmax and Renesas Forge Strategic Partnership to Deliver Competitive ADAS Solutions for the Global Market

Why You Should Build on #NEAR – Co-founder Illia Polosukhin at CV Labs
Whiteboard Series with NEAR | Ep: 45 Joel Thorstensson from ceramic.network

NEAR End of Year Town Hall 2021: The Open Web World, MetaBUILD 2 Hackathon and 2021 recap
Trending
-

 Coin Market5 days ago
Binance hack may involve private key ‘misuse,’ not theft: Blockaid CEO
-

 Technology5 days ago
From Catapult to capital: NextFin Asia reaches first investment milestone with Indonesia’s Finfra
-
 Technology5 days ago
Thirty Weihai Companies Added to Shandong’s Green Factory List
-
Technology5 days ago
Thirty Weihai Companies Added to Shandong’s Green Factory List
-
Technology5 days ago
Bridge expert Darryl Matson, P.Eng., P.E., of COWI is one of the two winners of ACEC’s prestigious 2026 Beaubien Award
-

 Technology5 days ago
eCloudvalley Renews Strategic Collaboration Agreement with Amazon Web Services and Repositions as a Leader in Product-Led Enterprise AI Transformation Across Asia-Pacific
-
 Technology3 days ago
ModelBest and OpenBMB Open-Source MiniCPM-OCR Series, Delivering High-Performance Document Parsing and AI-Powered Quality Control
-
 Technology5 days ago
Loomis Interim Report January – September 2026