
Technology
NB Bancorp, Inc. Reports Second Quarter 2026 Financial Results, Declares Quarterly Cash Dividend

Published
3 months agoon
By

NEEDHAM, Mass., July 22, 2026 /PRNewswire/ — NB Bancorp, Inc. (the “Company”) (Nasdaq Capital Market: NBBK), the holding company of Needham Bank (the “Bank”), today announced its second quarter 2026 financial results.
Net income for the second quarter of 2026 amounted to $21.1 million, or $0.53 per diluted common share, compared to net income of $15.0 million, or $0.36 per diluted common share, for the prior quarter. Return on average assets and return on average equity for the second quarter of 2026 were 1.17% and 10.03%, respectively, increases from 0.87% and 7.05%, respectively, for the prior quarter.Operating net income(1) for the second quarter of 2026 increased 38.5% and amounted to $21.9 million, or $0.55 per diluted common share, compared to operating net income(1) of $15.8 million, or $0.38 per diluted common share, for the prior quarter. Operating return on average assets(1) and operating return on average equity(1) for the second quarter of 2026 were 1.21% and 10.39%, respectively, increases from 0.92% and 7.43%, respectively, for the prior quarter.Net interest margin expanded by 7 basis points to 4.00% from 3.93% in the prior quarter as total loans increased 3.4% while total deposits increased 3.7% during the quarter. Net interest margin, excluding purchase accounting adjustments(1), expanded by 5 basis points to 3.87% during the current quarter from 3.82% in the prior quarter.Efficiency ratio improved to 58.92% from 61.55% in the prior quarter, while operating efficiency ratio(1) improved to 57.66% from 60.06% in the prior quarter.Net charge-offs (annualized) as a percent of average loans declined to 0.07% from 0.91% in the prior quarter. Non-performing loans as a percent of total loans decreased to 0.43% at the end of the second quarter from 0.73% at the end of the prior quarter.
“The second quarter of 2026 displayed Needham Bank’s continued execution of our strategy for disciplined growth in market share as total loans increased 3.4% during the quarter, while total deposits increased 3.7% over the same period. Through the first half of 2026, total loans and total deposits have increased by 15.0% and 15.9% on an annualized basis, while operating EPS increased 24%, respectively. Our teams remained focused on executing our strategic priorities and investing in the infrastructure, technology, and operating capabilities needed to support continued profitable growth. This included targeted investments in artificial intelligence, improved internal systems and automation tools designed to enhance internal efficiency, scalability, and employee effectiveness. We are well positioned to continue to enhance the customer experience and grow market share, while improving long-term operating leverage. The dedication and collaboration of our employees continue to be defining strengths for Needham Bank. As we invest thoughtfully in technology, artificial intelligence, and operational capabilities, while maintaining strong credit performance and disciplined growth, we are building a more scalable and efficient organization that is well-positioned to deliver long-term value for our customers, communities, and shareholders,” Campanelli concluded.
Declaration of Dividend
The Board of Directors declared a quarterly cash dividend of $0.07 per share, payable on August 19, 2026, to shareholders of record as of August 5, 2026.
SELECTED FINANCIAL HIGHLIGHTS FOR THE SECOND QUARTER OF 2026
Net income of $21.1 million, or $0.53 per diluted common share, compared to net income of $15.0 million, or $0.36 per diluted common share, for the prior quarter. Operating net income(1), excluding one-time charges, amounted to $21.9 million, or $0.55 per diluted common share, compared to operating net income(1) of $15.8 million, or $0.38 per diluted common share, for the prior quarter.Operating return on average assets increased to 1.21% from 0.92%, operating return on average equity increased to 10.39% from 7.43% and net interest margin expanded to 4.00% from 3.93%.Credit trends from the BankProv acquisition improved during the quarter, where net charge-offs to average loans decreased to 0.07% from 0.91% and non-performing assets to total assets decreased to 0.37% from 0.63%
One-time pre-tax charges during the current quarter include:
Non-recurring fees for business line expansion of $649 thousand ($499 thousand net of tax);Final merger and acquisition costs of $296 thousand ($227 thousand net of tax) related to the Company’s acquisition of Provident; andTax expense and a modified endowment contract penalty of $27 thousand related to the surrender of Bank-owned life insurance (“BOLI”) policies acquired from BankProv.
One-time pre-tax charges during the prior quarter include:
Pre-tax trailing merger and acquisition costs of $534 thousand ($390 thousand net of tax) related to the Company’s completed acquisition of Provident;Non-recurring fees for business line expansion of $500 thousand ($366 thousand net of tax); andTax expense and a modified endowment contract penalty of $50 thousand related to the surrender of BOLI policies acquired from BankProv.Net interest margin expanded by 7 basis points to 4.00% during the current quarter from 3.93% in the prior quarter. Net interest margin, excluding purchase accounting adjustments(1), expanded by 5 basis points to 3.87% during the current quarter from 3.82% in the prior quarter.Gross loans increased $213.0 million, or 3.4%, to $6.42 billion, from $6.21 billion in the prior quarter.Total deposits increased $222.9 million, or 3.7%, to $6.32 billion, from $6.10 billion in the prior quarter.Core deposits, which the Company considers to be all non-brokered deposits, increased $73.1 million, or 1.3%, to $5.60 billion, from $5.53 billion in the prior quarter.Brokered deposits increased $149.8 million, or 26.3%, to $719.9 million, from $570.1 million in the prior quarter.Book value per share and tangible book value per share(1) were $19.22 and $18.51, respectively, in the current quarter, compared to $18.83 and $18.11, respectively, in the prior quarter. The increase in tangible book value per share(1) was a result of $21.1 million in net income for the quarter, partially offset by the repurchase of 918,727 shares during the current quarter at an all-in weighted average cost of $20.13 per share and $3.1 million in dividends paid during the quarter.
BALANCE SHEET
Total assets amounted to $7.45 billion as of June 30, 2026, representing an increase of $220.2 million, or 3.0%, from $7.23 billion as of March 31, 2026.
Cash and cash equivalents increased $24.6 million, or 6.5%, to $400.2 million from $375.6 million in the prior quarter, as a result of net income earned during the quarter of $21.1 million, along with deposit growth of $222.9 million, partially offset by loan growth of $211.1 million and the repurchase of 918,727 shares during the current quarter at an all-in weighted average cost of $20.13 per share.Net loans increased $211.1 million, or 3.4%, to $6.34 billion, from $6.13 billion in the prior quarter as demand for new loan originations and advances continued. The current quarter change was primarily seen in commercial real estate loans, which increased $196.7 million, or 10.2%, residential real estate loans, which increased $45.0 million, or 3.4%, and multi-family residential loans, which increased $29.6 million, or 5.5%, partially offset by mortgage warehouse loans, which decreased $59.5 million, or 21.5% along with continued run-off of the acquired Enterprise Value portfolio, which decreased $29.5 million, or 18.5%, from the prior quarter.Deposits increased $222.9 million, or 3.7%, to $6.32 billion from $6.10 billion in the prior quarter. The change in deposits was the result of noninterest bearing demand deposits, which increased $80.8 million, or 9.3%, NOW accounts, which increased $61.8 million, or 8.9% and brokered deposits, which increased $149.8 million, or 26.3%, partially offset by money market accounts, which decreased $77.4 million, or 4.4%.Shareholders’ equity decreased $776 thousand, or 0.1%, to $842.0 million, from $842.8 million in the prior quarter, primarily as a result of the repurchase of 918,727 shares of common stock at an all-in weighted average cost of $20.13 per share totaling $18.5 million and $3.1 million in dividends paid during the current quarter, partially offset by net income of $21.1 million. Shareholders’ equity to total assets and tangible shareholders’ equity(1) to tangible assets were 11.3% and 10.9%, respectively, at the end of the current quarter, compared to 11.7% and 11.3%, respectively, at the end of the prior quarter.
NET INTEREST INCOME
Net interest income increased $4.3 million, or 6.6%, to $69.1 million for the current quarter, compared to $64.9 million for the prior quarter. Net interest margin expanded 7 basis points to 4.00% for the current quarter, from 3.93% in the prior quarter.
Interest income increased during the current quarter, primarily attributable to an increase in the average balance of and weighted average rate on loans as a result of the continued execution of our growth strategy, partially offset by a reduction in the average balance of and weighted average rate on short-term investments.Interest expense increased for the current quarter, primarily driven by increases in the average balances of certificates of deposit and individual retirement accounts and FHLB borrowings, partially offset by a decrease in the weighted average rate on certificates of deposit and individual retirement accounts.
PROVISION FOR CREDIT LOSSES
Provision for credit losses decreased $3.1 million, or 49.5%, to a provision for credit losses of $3.2 million for the current quarter, compared to a provision for credit losses of $6.3 million for the prior quarter.
The provision for credit losses on loans decreased $3.4 million, or 53.1%, to $3.0 million for the current quarter, compared to $6.4 million for the prior quarter, primarily driven by an $822 thousand recovery from a commercial and industrial loan, improved qualitative factors on commercial real estate and multi-family loans and no downgrades in qualitative factors, which existed in the prior quarter.The provision for credit losses on unfunded commitments increased $253 thousand, or 468.5%, to $199 thousand for the current quarter, compared to a release of $54 thousand for the prior quarter, primarily driven by an increase in net unfunded commitments in the current quarter.
NONINTEREST INCOME
Noninterest income increased $1.0 million, or 23.2%, to $5.6 million for the current quarter, compared to $4.5 million for the prior quarter.
Customer service fees increased $550 thousand, or 17.6%, to $3.7 million for the current quarter, compared to $3.1 million in the prior quarter due to increased loan fee income, cash management fees and customer transactional volume.Other income increased $315 thousand, or 150.0%, to $525 thousand for the current quarter, compared to $210 thousand in the prior quarter, primarily driven by $229 thousand of credit card branding and marketing income recognized during the quarter, along with higher preferred dividends from solar tax credit investments.Gain (loss) on sale of loans, net, increased $228 thousand to a $227 thousand gain in the current quarter, compared to a $1 thousand loss in the prior quarter, resulting from the improvement in the fair market value of consumer loans held for sale during the current quarter.
NONINTEREST EXPENSE
Noninterest expense increased $1.3 million, or 3.1%, to $44.0 million for the current quarter, compared to $42.7 million for the prior quarter.
Marketing and charitable contribution expenses increased $497 thousand, or 48.1%, to $1.5 million for the current quarter, compared to $1.0 million for the prior quarter, primarily resulting from advertising expenses related to customer events and branch openings, as well as a higher volume of Bank contributions to charities during the current quarter.Data processing expenses increased $460 thousand, or 10.4%, to $4.9 million for the current quarter, compared to $4.4 million for the prior quarter, primarily driven by our continued investment in technology and systems in support of upcoming revenue initiatives, requiring the operation of systems in parallel for a period of time while new systems are implemented.FDIC and state insurance assessment expenses increased $432 thousand, or 37.5%, to $1.6 million for the current quarter, compared to $1.2 million for the prior quarter, primarily driven by increased insurance assessments related to the BankProv acquisition.
INCOME TAXES
Income tax expense increased $1.0 million, or 18.7%, to $6.4 million for the current quarter, compared to $5.4 million for the prior quarter. The increase was primarily driven by the increase in net income during the current quarter. The effective tax rate and the operating effective tax rate(1) were 23.2% and 23.1%, respectively, for the current quarter, compared to 26.4% and 26.2%, respectively, for the prior quarter. The primary drivers of the decrease in the effective tax rate were a higher volume of earned income tax credits and tax-exempt interest income on loans due to the origination of a tax-exempt loan at the end of the prior quarter.
COMMERCIAL REAL ESTATE PORTFOLIO
Commercial real estate loans increased $226.2 million, or 9.2%, to $2.69 billion, during the current quarter.
Cannabis facility commercial real estate loans decreased $3.7 million, or 1.7%, to $210.1 million during the current quarter. The Company’s cannabis facility commercial real estate portfolio is secured entirely by the underlying commercial real estate of the borrower operation, in addition to, in most cases, a lien on all business assets. The vast majority of the cannabis facility loan portfolio balances have a loan-to-value ratio of 65% or lower, with appraisal reports taking a blended approach (using both cannabis and non-cannabis use comparable real estate sales, which we believe are generally more conservative).The cannabis facility portfolio has geographic dispersion, with lower dollar exposure loans remaining local and larger dollar exposure loans generally tied to multi-state operators with a more national footprint. All cannabis facility loan relationships were current at the end of the current quarter.The Company’s multi-family real estate loan portfolio increased $29.6 million, or 5.5%, during the current quarter to $567.7 million. The Company’s multi-family real estate loan portfolio consists of properties primarily located in the Greater Boston area, all of which are adjustable-rate loans and performing at the end of the current quarter.The Company’s $335.7 million office portfolio consists principally of suburban Class A and B office space used as medical and traditional offices. The portfolio does not consist of high-rise towers located in Boston and are performing at the end of the current quarter.
ASSET QUALITY
The allowance for credit losses (“ACL”) amounted to $82.1 million as of June 30, 2026, or 1.28% of total loans, compared to $80.2 million, or 1.29% of total loans as of March 31, 2026.The Company recorded a provision for credit losses of $3.2 million during the current quarter, which included a provision for credit losses on loans of $3.0 million and a provision of $199 thousand for unfunded commitments, compared to a provision for credit losses of $6.3 million during the prior quarter, which included a provision for credit losses on loans of $6.4 million and a release of provision of $54 thousand for unfunded commitments.The increase in the ACL for the current quarter was primarily driven by loan growth.Non-performing loans (“NPLs”) decreased $17.9 million, or 39.3%, to $27.7 million as of June 30, 2026, from $45.6 million at the end of the prior quarter. The decrease was primarily due to the decrease in commercial and industrial loans on non-accrual of $18.4 million, resulting from improved performance or workouts. The ACL as a percent of NPLs is 297% as of June 30, 2026, an increase from 176% at the end of the prior quarter.During the current quarter, the Company recorded total net charge-offs of $1.1 million, or 0.07% of average total loans on an annualized basis, which related to non-purchase-credit-deteriorated (“PCD”) loans, compared to net charge-offs of $13.6 million, or 0.91% of average total loans on an annualized basis, in the prior quarter. The $12.4 million decrease in net charge-offs during the current quarter was primarily a result of prior quarter charge-offs on previously fully reserved for PCD commercial and industrial loans. As part of its ongoing credit risk management framework and prudent oversight, the Company periodically reviews lending relationships across all portfolios to ensure alignment with its risk appetite, regulatory expectations, and evolving market conditions.The Company’s loan portfolio consists primarily of commercial real estate and multi-family loans, one-to-four-family residential real estate loans, construction and land development loans, commercial and industrial loans, mortgage warehouse loans and consumer loans. These loans are primarily made to individuals and businesses located in our primary lending market area, which is the Greater Boston metropolitan area and surrounding communities in greater New England.
(1)
Represents a non-GAAP measure. See Non-GAAP reconciliation of the corresponding GAAP measures on pages 13 and 14.
ABOUT NB BANCORP, INC.
NB Bancorp, Inc. (Nasdaq Capital Market: NBBK) is the registered bank holding company of Needham Bank. Needham Bank is headquartered in Needham, Massachusetts, which is approximately 17 miles southwest of Boston’s financial district. Known as the “Builder’s Bank,” Needham Bank has been helping individuals, businesses and non-profits build for their futures since 1892. Needham Bank offers an array of tech-forward products and services that businesses and consumers use to manage their financial needs. Needham Bank also provides services to companies in the cannabis industry by providing loans and deposits, along with supporting payment platforms in this industry, such as Mosaic.
We have the financial expertise typically found at much larger institutions and the local knowledge and commitment you can only find at a community bank. For more information, please visit https://NeedhamBank.com. Needham Bank is a member of FDIC.
Non-GAAP Financial Measures
In addition to results presented in accordance with accounting principles generally accepted in the United States of America (“GAAP”), this press release contains certain non-GAAP financial measures, including pre-provision net revenue, operating net income, operating pre-tax income, net interest margin, excluding purchase accounting adjustments, operating noninterest expense, operating noninterest income, operating effective tax rate, operating earnings per share, basic, operating earnings per share, diluted, operating return on average assets, operating return on average shareholders’ equity, operating efficiency ratio, tangible shareholders’ equity, tangible assets and tangible book value per share. The Company’s management believes that the supplemental non-GAAP information is utilized by regulators and market analysts to evaluate a Company’s financial condition and therefore, such information is useful to investors. These disclosures should not be viewed as a substitute for financial results determined in accordance with GAAP, nor are they necessarily comparable to non-GAAP performance measures that may be presented by other companies. Because non-GAAP financial measures are not standardized, it may not be possible to compare these financial measures with other companies’ non-GAAP financial measures having the same or similar names.
Forward-Looking Statements
Statements in this press release that are not historical facts are forward-looking statements within the meaning of Section 27A of the Securities Act of 1933, as amended, and Section 21E of the Securities Exchange Act of 1934, as amended, and are intended to be covered by the safe harbor provisions of the Private Securities Litigation Reform Act of 1995.
We may also make forward-looking statements in other documents we file with the Securities and Exchange Commission (the “SEC”), in our annual reports to our stockholders, in press releases and other written materials, and in oral statements made by our officers, directors or employees. You can identify forward-looking statements by the use of the words “believe,” “expect,” “anticipate,” “intend,” “estimate,” “assume,” “outlook,” “will,” “should,” and other expressions that predict or indicate future events and trends and which do not relate to historical matters. Although the Company believes that these forward-looking statements are based on reasonable estimates and assumptions, they are not guarantees of future performance and are subject to known and unknown risks, uncertainties, and other factors. You should not place undue reliance on our forward-looking statements. You should exercise caution in interpreting and relying on forward-looking statements because they are subject to significant risks, uncertainties and other factors which are, in some cases, beyond the Company’s control. The Company’s actual results could differ materially from those projected in the forward-looking statements as a result of, among other factors, changes in general business and economic conditions on a national basis and in the local markets in which the Company operates, including changes which adversely affect borrowers’ ability to service and repay loans; changes in customer behavior due to political, business and economic conditions, including inflation and concerns about liquidity; turbulence in the capital and debt markets; reductions in net interest income resulting from interest rate volatility as well as changes in the balances and mix of loans and deposits; changes in interest rates and real estate values; changes in loan collectability and increases in defaults and charge-off rates; decreases in the value of securities and other assets, adequacy of credit loss reserves, or deposit levels necessitating increased borrowing to fund loans and investments; risks related to the Company’s acquisitions generally, including disruption to current plans and operations; difficulties in customer and employee retention; fees, expenses and charges related to these transactions being significantly higher than anticipated; unforeseen integration issues or impairment of other intangibles; and the Company’s inability to achieve expected revenues, cost savings, synergies, and other benefits at levels or within the timeframes originally anticipated; changing government regulation; competitive pressures from other financial institutions; changes in legislation or regulation and accounting principles, policies and guidelines; cybersecurity incidents, fraud, natural disasters, and future pandemics; the risk that the Company may not be successful in the implementation of its business strategy; the risk that intangibles recorded in the Company’s financial statements will become impaired; changes in assumptions used in making such forward-looking statements; and the other risks and uncertainties detailed in the Company’s Form 10-K and updated by our Quarterly Report on Form 10-Q and other filings submitted to the SEC. These statements speak only as of the date of this release and the Company does not undertake any obligation to update or revise any of these forward-looking statements to reflect events or circumstances occurring after the date of this communication or to reflect the occurrence of unanticipated events.
NB BANCORP, INC.
SELECTED FINANCIAL HIGHLIGHTS
(Unaudited)
(Dollars in thousands, except per share data)
As of and for the three months ended
June 30, 2026
March 31, 2026
June 30, 2025
Earnings data
Net interest income
$
69,145
$
64,868
$
47,007
Noninterest income
5,559
4,513
4,278
Total revenue
74,704
69,381
51,285
Provision for credit losses
3,193
6,328
3,161
Noninterest expense
44,017
42,701
29,405
Pre-tax income
27,494
20,352
18,719
Net income
21,123
14,984
14,579
Operating net income (non-GAAP)
21,877
15,791
15,043
Operating noninterest expense (non-GAAP)
43,072
41,667
28,875
Per share data
Earnings per share, basic
$
0.53
$
0.37
$
0.39
Earnings per share, diluted
0.53
0.36
0.39
Operating earnings per share, basic (non-GAAP)
0.55
0.39
0.40
Operating earnings per share, diluted (non-GAAP)
0.55
0.38
0.40
Book value per share
19.22
18.83
18.09
Tangible book value per share (non-GAAP)
18.51
18.11
18.07
Profitability
Return on average assets
1.17 %
0.87 %
1.13 %
Operating return on average assets (non-GAAP)
1.21 %
0.92 %
1.16 %
Return on average shareholders’ equity
10.03 %
7.05 %
7.84 %
Operating return on average shareholders’ equity (non-GAAP)
10.39 %
7.43 %
8.09 %
Net interest margin
4.00 %
3.93 %
3.82 %
Net interest margin, excluding purchase accounting adjustments
3.87 %
3.82 %
3.82 %
Cost of deposits
2.68 %
2.73 %
3.00 %
Efficiency ratio
58.92 %
61.55 %
57.34 %
Operating efficiency ratio (non-GAAP)
57.66 %
60.06 %
56.30 %
Balance sheet, end of period
Total assets
$
7,446,880
$
7,226,649
$
5,226,618
Total loans
6,482,821
6,273,881
4,540,969
Total deposits
6,320,090
6,097,200
4,268,115
Total shareholders’ equity
842,002
842,778
737,122
Asset quality
ACL
$
82,088
$
80,195
$
42,601
ACL / Total NPLs
296.8 %
176.0 %
341.4 %
Total NPLs / Total loans
0.43 %
0.73 %
0.27 %
Annualized net charge-offs / Average total loans
(0.07) %
(0.91) %
0.00 %
Capital ratios
Shareholders’ equity / Total assets
11.31 %
11.66 %
14.10 %
Tangible shareholders’ equity / tangible assets (non-GAAP)
10.94 %
11.27 %
14.09 %
NB BANCORP, INC.
CONSOLIDATED BALANCE SHEETS
(Unaudited)
(Dollars in thousands, except share and per share data)
As of
June 30, 2026 change from
June 30, 2026
March 31, 2026
June 30, 2025
March 31, 2026
June 30, 2025
Assets
Cash and due from banks
$
372,522
$
327,951
$
157,175
$
44,571
13.6 %
$
215,347
137.0 %
Federal funds sold
27,632
47,618
101,587
(19,986)
(42.0) %
(73,955)
(72.8) %
Total cash and cash equivalents
400,154
375,569
258,762
24,585
6.5 %
141,392
54.6 %
Available-for-sale securities, at fair value
272,640
277,241
235,408
(4,601)
(1.7) %
37,232
15.8 %
Loans held for sale, at fair value
59,927
63,971
–
(4,044)
(6.3) %
59,927
0.0 %
Loans receivable, net of deferred fees
6,422,894
6,209,910
4,540,969
212,984
3.4 %
1,881,925
41.4 %
Allowance for credit losses
(82,088)
(80,195)
(42,601)
(1,893)
2.4 %
(39,487)
92.7 %
Net loans
6,340,806
6,129,715
4,498,368
211,091
3.4 %
1,842,438
41.0 %
Accrued interest receivable
28,898
27,150
20,386
1,748
6.4 %
8,512
41.8 %
Banking premises and equipment, net
49,298
47,335
34,289
1,963
4.1 %
15,009
43.8 %
Non-public investments
42,029
40,738
35,767
1,291
3.2 %
6,262
17.5 %
Bank-owned life insurance (“BOLI”)
97,370
110,586
55,711
(13,216)
(12.0) %
41,659
74.8 %
Prepaid expenses and other assets
69,228
67,749
57,277
1,479
2.2 %
11,951
20.9 %
Goodwill
18,512
18,512
–
–
0.0 %
18,512
0.0 %
Core deposit intangible, net
17,519
18,411
1,005
(892)
(4.8) %
16,514
1643.2 %
Deferred income tax asset, net
50,499
49,672
29,645
827
1.7 %
20,854
70.3 %
Total assets
$
7,446,880
$
7,226,649
$
5,226,618
$
220,231
3.0 %
$
2,220,262
42.5 %
Liabilities and shareholders’ equity
Deposits
Core deposits
$
5,600,238
$
5,527,148
$
4,013,955
$
73,090
1.3 %
$
1,586,283
39.5 %
Brokered deposits
719,852
570,052
254,160
149,800
26.3 %
465,692
183.2 %
Total deposits
6,320,090
6,097,200
4,268,115
222,890
3.7 %
2,051,975
48.1 %
Mortgagors’ escrow accounts
4,420
4,858
4,117
(438)
(9.0) %
303
7.4 %
Federal Home Loan Bank (“FHLB”) borrowings
181,247
189,701
127,600
(8,454)
(4.5) %
53,647
42.0 %
Accrued expenses and other liabilities
77,549
70,983
68,235
6,566
9.3 %
9,314
13.6 %
Accrued retirement liabilities
21,572
21,129
21,429
443
2.1 %
143
0.7 %
Total liabilities
6,604,878
6,383,871
4,489,496
221,007
3.5 %
2,115,382
47.1 %
Shareholders’ equity:
Preferred stock, $0.01 par value, 5,000,000 shares authorized; no shares
issued and outstanding
–
–
–
–
0.0 %
–
0.0 %
Common stock, $0.01 par value, 120,000,000 shares authorized; 43,818,490 issued and
outstanding at June 30, 2026, 44,765,178 issued and outstanding at March 31, 2026
and 40,748,380 issued and outstanding at June 30, 2025
438
448
407
(10)
(2.2) %
31
7.6 %
Additional paid-in capital
415,841
432,858
358,793
(17,017)
(3.9) %
57,048
15.9 %
Unallocated common shares held by the Employee Stock Ownership Plan (“ESOP”)
(41,285)
(41,873)
(43,643)
588
(1.4) %
2,358
(5.4) %
Retained earnings
474,970
456,978
427,707
17,992
3.9 %
47,263
11.1 %
Accumulated other comprehensive loss
(7,962)
(5,633)
(6,142)
(2,329)
41.3 %
(1,820)
29.6 %
Total shareholders’ equity
842,002
842,778
737,122
(776)
(0.1) %
104,880
14.2 %
Total liabilities and shareholders’ equity
$
7,446,880
$
7,226,649
$
5,226,618
$
220,231
3.0 %
$
2,220,262
42.5 %
NB BANCORP, INC.
CONSOLIDATED STATEMENTS OF INCOME
(Unaudited)
(Dollars in thousands, except share and per share data)
Three Months Ended June 30, 2026
For the Three Months Ended
Change From Three Months Ended
June 30, 2026
March 31, 2026
June 30, 2025
March 31, 2026
June 30, 2025
INTEREST AND DIVIDEND INCOME
Interest and fees on loans
$
106,574
$
100,042
$
74,719
$
6,532
6.5 %
$
31,855
42.6 %
Interest on securities
2,758
2,708
2,307
50
1.8 %
451
19.5 %
Interest and dividends on cash equivalents and other
2,460
2,936
2,822
(476)
(16.2) %
(362)
(12.8) %
Total interest and dividend income
111,792
105,686
79,848
6,106
5.8 %
31,944
40.0 %
INTEREST EXPENSE
Interest on deposits
40,686
39,579
31,690
1,107
2.8 %
8,996
28.4 %
Interest on borrowings
1,961
1,239
1,151
722
58.3 %
810
70.4 %
Total interest expense
42,647
40,818
32,841
1,829
4.5 %
9,806
29.9 %
NET INTEREST INCOME
69,145
64,868
47,007
4,277
6.6 %
22,138
47.1 %
PROVISION FOR CREDIT LOSSES
Provision for credit losses – loans
2,994
6,382
4,244
(3,388)
(53.1) %
(1,250)
(29.5) %
Provision for (release of) credit losses – unfunded commitments
199
(54)
(1,083)
253
468.5 %
1,282
(118.4) %
Total provision for credit losses
3,193
6,328
3,161
(3,135)
(49.5) %
32
1.0 %
NET INTEREST INCOME AFTER
PROVISION FOR CREDIT LOSSES
65,952
58,540
43,846
7,412
12.7 %
22,106
50.4 %
NONINTEREST INCOME
Customer service fees
3,681
3,131
2,554
550
17.6 %
1,127
44.1 %
Increase in cash surrender value of BOLI
962
853
787
109
12.8 %
175
22.2 %
Mortgage banking income
92
119
120
(27)
(22.7) %
(28)
(23.3) %
Swap contract income
72
201
524
(129)
(64.2) %
(452)
(86.3) %
Gain (loss) on sale of loans, net
227
(1)
21
228
22800.0 %
206
981.0 %
Other income
525
210
272
315
150.0 %
253
93.0 %
Total noninterest income
5,559
4,513
4,278
1,046
23.2 %
1,281
29.9 %
NONINTEREST EXPENSE
Salaries and employee benefits
25,549
25,468
18,567
81
0.3 %
6,982
37.6 %
Director and professional service fees
3,816
4,049
2,943
(233)
(5.8) %
873
29.7 %
Occupancy and equipment expenses
2,468
2,491
1,465
(23)
(0.9) %
1,003
68.5 %
Data processing expenses
4,899
4,439
2,493
460
10.4 %
2,406
96.5 %
Marketing and charitable contribution expenses
1,530
1,033
954
497
48.1 %
576
60.4 %
FDIC and state insurance assessments
1,584
1,152
883
432
37.5 %
701
79.4 %
General and administrative expenses
4,171
4,069
2,100
102
2.5 %
2,071
98.6 %
Total noninterest expense
44,017
42,701
29,405
1,316
3.1 %
14,612
49.7 %
INCOME BEFORE TAXES
27,494
20,352
18,719
7,142
35.1 %
8,775
46.9 %
INCOME TAX EXPENSE
6,371
5,368
4,140
1,003
18.7 %
2,231
53.9 %
NET INCOME
$
21,123
$
14,984
$
14,579
$
6,139
41.0 %
$
6,544
44.9 %
Weighted average common shares outstanding, basic
39,693,140
40,969,748
37,191,460
(1,276,608)
(3.1) %
2,501,680
6.7 %
Weighted average common shares outstanding, diluted
40,000,305
41,421,002
37,550,409
(1,420,697)
(3.4) %
2,449,896
6.5 %
Earnings per share, basic
$
0.53
$
0.37
$
0.39
$
0.16
43.2 %
$
0.14
35.9 %
Earnings per share, diluted
$
0.53
$
0.36
$
0.39
$
0.17
47.2 %
$
0.14
35.9 %
NB BANCORP, INC.
AVERAGE BALANCES, INTEREST EARNED/PAID & AVERAGE YIELDS
(Unaudited)
(Dollars in thousands)
For the Three Months Ended
June 30, 2026
March 31, 2026
June 30, 2025
Average
Average
Average
Outstanding
Average
Outstanding
Average
Outstanding
Average
Balance
Interest
Yield/Rate (4)
Balance
Interest
Yield/Rate (4)
Balance
Interest
Yield/Rate (4)
Interest-earning assets:
Loans (5)
$
6,377,025
$
106,574
6.70
%
$
6,090,227
$
100,042
6.66
%
$
4,479,479
$
74,719
6.69
%
Securities
279,196
2,758
3.96
%
273,308
2,708
4.02
%
232,812
2,307
3.97
%
Other investments (5)
34,301
612
7.16
%
28,275
265
3.80
%
28,525
605
8.51
%
Short-term investments (5)
237,667
1,848
3.12
%
295,394
2,671
3.67
%
200,524
2,217
4.43
%
Total interest-earning assets
6,928,189
111,792
6.47
%
6,687,204
105,686
6.41
%
4,941,340
79,848
6.48
%
Non-interest-earning assets
394,611
375,966
277,915
Allowance for credit losses
(81,276)
(88,102)
(39,931)
Total assets
$
7,241,524
$
6,975,068
$
5,179,324
Interest-bearing liabilities:
Savings accounts
$
210,544
324
0.62
%
$
207,681
263
0.51
%
$
119,736
134
0.45
%
NOW accounts
701,167
2,265
1.30
%
639,347
2,006
1.27
%
469,472
1,259
1.08
%
Money market accounts
1,699,366
12,783
3.02
%
1,711,672
12,732
3.02
%
1,090,163
9,062
3.33
%
Certificates of deposit and individual retirement accounts
2,595,290
25,314
3.91
%
2,497,213
24,578
3.99
%
1,964,678
21,235
4.34
%
Total interest-bearing deposits
5,206,367
40,686
3.13
%
5,055,913
39,579
3.17
%
3,644,049
31,690
3.49
%
FHLB borrowings
209,002
1,961
3.76
%
135,441
1,239
3.71
%
103,406
1,151
4.46
%
Total interest-bearing liabilities
5,415,369
42,647
3.16
%
5,191,354
40,818
3.19
%
3,747,455
32,841
3.52
%
Non-interest-bearing deposits
883,487
824,839
593,136
Other non-interest-bearing liabilities
98,225
97,370
93,063
Total liabilities
6,397,081
6,113,563
4,433,654
Shareholders’ equity
844,443
861,505
745,670
Total liabilities and shareholders’ equity
$
7,241,524
$
6,975,068
$
5,179,324
Net interest income
$
69,145
$
64,868
$
47,007
Net interest rate spread (1)
3.31
%
3.22
%
2.96
%
Net interest-earning assets (2)
$
1,512,820
$
1,495,850
$
1,193,885
Net interest margin (3)
4.00
%
3.93
%
3.82
%
Average interest-earning assets to interest-bearing liabilities
127.94
%
128.81
%
131.86
%
(1)
Net interest rate spread represents the difference between the weighted average yield on interest-earning assets and the weighted average rate of interest-bearing liabilities.
(2)
Net interest-earning assets represent total interest-earning assets less total interest-bearing liabilities.
(3)
Net interest margin represents net interest income divided by average total interest-earning assets.
(4)
Annualized.
(5)
Loans include loans held for sale, at fair value. Other investments are comprised of Federal Reserve Bank stock, FHLB stock and swap collateral accounts. Short-term investments are comprised of cash and cash equivalents.
NB BANCORP, INC.
COMMERCIAL REAL ESTATE BY COLLATERAL TYPE
(Unaudited)
(Dollars in thousands)
June 30, 2026
Owner-Occupied
Non-Owner-Occupied
Balance
Percentage
Multi-Family
$
—
$
567,722
$
567,722
20 %
Industrial
185,270
163,112
348,382
13 %
Office
44,635
291,110
335,745
12 %
Hospitality
41,266
247,242
288,508
11 %
Mixed-Use
22,408
225,392
247,800
9 %
Retail
126,323
109,201
235,524
9 %
Cannabis Facility
201,153
8,913
210,066
8 %
Special Purpose
84,655
69,837
154,492
6 %
Recreational Vehicle Parks
13,255
65,162
78,417
3 %
Self Storage Facilities
—
71,147
71,147
3 %
Other
87,282
64,164
151,446
6 %
Total commercial real estate
$
806,247
$
1,883,002
$
2,689,249
100 %
Change From March 31, 2026
Change From June 30, 2025
Owner-Occupied
Non-Owner-Occupied
Balance
Percentage
Owner-Occupied
Non-Owner-Occupied
Balance
Percentage
Multi-Family
$
—
$
29,558
$
29,558
5 %
$
—
$
250,977
$
250,977
79 %
Industrial
55,111
6,772
61,883
22 %
98,479
50,105
148,584
74 %
Office
2,706
(2,552)
154
0 %
18,478
110,801
129,279
63 %
Hospitality
1,996
(11,711)
(9,715)
(3) %
41,266
75,083
116,349
68 %
Mixed-Use
(922)
24,693
23,771
11 %
14,765
65,014
79,779
47 %
Retail
73,112
(5,164)
67,948
41 %
86,769
22,358
109,127
86 %
Cannabis Facility
(3,613)
(85)
(3,698)
(2) %
(54,604)
(6,185)
(60,789)
(22) %
Special Purpose
(2,298)
8,159
5,861
4 %
6,535
12,860
19,395
14 %
Recreational Vehicle Parks
(125)
13,159
13,034
20 %
13,255
65,162
78,417
100 %
Self Storage Facilities
—
(16,443)
(16,443)
(19) %
—
71,147
71,147
100 %
Other
38,079
15,791
53,870
55 %
47,462
9,372
56,834
60 %
Total commercial real
estate
$
164,046
$
62,177
$
226,223
9 %
$
272,405
$
726,694
$
999,099
59 %
March 31, 2026
June 30, 2025
Owner-Occupied
Non-Owner-Occupied
Balance
Percentage
Owner-Occupied
Non-Owner-Occupied
Balance
Percentage
Multi-Family
$
—
$
538,164
$
538,164
21 %
$
—
$
316,745
$
316,745
19 %
Industrial
130,159
156,340
286,499
12 %
86,791
113,007
199,798
12 %
Office
41,929
293,662
335,591
13 %
26,157
180,309
206,466
12 %
Hospitality
39,270
258,953
298,223
12 %
—
172,159
172,159
10 %
Mixed-Use
23,330
200,699
224,029
9 %
7,643
160,378
168,021
10 %
Retail
53,211
114,365
167,576
7 %
39,554
86,843
126,397
7 %
Cannabis Facility
204,766
8,998
213,764
9 %
255,757
15,098
270,855
16 %
Special Purpose
86,953
61,678
148,631
6 %
78,120
56,977
135,097
8 %
Recreational Vehicle Parks
13,380
52,003
65,383
3 %
—
—
—
0 %
Self Storage Facilities
—
87,590
87,590
4 %
—
—
—
0 %
Other
49,203
48,373
97,576
4 %
39,820
54,792
94,612
6 %
Total commercial real
estate
$
642,201
$
1,820,825
$
2,463,026
100 %
$
533,842
$
1,156,308
$
1,690,150
100 %
NB BANCORP, INC.
NON-GAAP RECONCILIATION
(Unaudited)
(Dollars in thousands)
For the Three Months Ended
June 30, 2026
March 31, 2026
June 30, 2025
Net income (GAAP)
$
21,123
$
14,984
$
14,579
Add (Subtract):
Adjustments to net income:
Non-recurring fees for business line expansion
649
500
–
BOLI surrender tax and modified endowment contract penalty
27
50
64
Merger and acquisition expenses
296
534
530
Total adjustments to net income
$
972
$
1,084
$
594
Less net tax benefit associated with pre-tax non-GAAP adjustments to net income
218
277
130
Non-GAAP adjustments, net of tax
754
807
464
Operating net income (non-GAAP)
$
21,877
$
15,791
$
15,043
Weighted average common shares outstanding, basic
39,693,140
40,969,748
37,191,460
Weighted average common shares outstanding, diluted
40,000,305
41,421,002
37,550,409
Operating earnings per share, basic (non-GAAP)
$
0.55
$
0.39
$
0.40
Operating earnings per share, diluted (non-GAAP)
$
0.55
$
0.38
$
0.40
Pre-tax income (GAAP)
$
27,494
$
20,352
$
18,719
Add (Subtract):
Adjustments to pre-tax income:
Non-recurring fees for business line expansion
649
500
–
Merger and acquisition expenses
296
534
530
Total adjustments to pre-tax income
945
1,034
530
Operating pre-tax income (non-GAAP)
$
28,439
$
21,386
$
19,249
Net interest income (GAAP)
$
69,145
$
64,868
$
47,007
Subtract (Add):
Adjustments to net interest income:
Purchase accounting adjustments
1,972
1,623
–
Total impact of non-GAAP interest net income adjustments
$
1,972
$
1,623
$
–
Net interest income, excluding purchase accounting adjustments (non-GAAP)
$
67,173
$
63,245
$
47,007
Noninterest expense (GAAP)
$
44,017
$
42,701
$
29,405
Subtract (Add):
Adjustments to noninterest expense:
Non-recurring fees for business line expansion
649
500
–
Merger and acquisition expenses
296
534
530
Total impact of non-GAAP noninterest expense adjustments
$
945
$
1,034
$
530
Operating noninterest expense (non-GAAP)
$
43,072
$
41,667
$
28,875
Operating net income (non-GAAP)
$
21,877
$
15,791
$
15,043
Average assets
7,241,524
6,975,068
5,179,324
Operating return on average assets (non-GAAP)
1.21 %
0.92 %
1.16 %
Average shareholders’ equity
$
844,443
$
861,505
$
745,670
Operating return on average shareholders’ equity (non-GAAP)
10.39 %
7.43 %
8.09 %
Operating noninterest expense (non-GAAP)
$
43,072
$
41,667
$
28,875
Total pre-provision net revenue (net interest income plus total noninterest income)
74,704
69,381
51,285
Operating efficiency ratio (non-GAAP)
57.66 %
60.06 %
56.30 %
Income tax expense (GAAP)
$
6,371
$
5,368
$
4,140
Add (Subtract):
Adjustments to income tax expense:
Net tax benefit associated with pre-tax non-GAAP adjustments to net income
218
277
–
BOLI surrender tax and modified endowment contract penalty
(27)
(50)
(64)
Total impact of non-GAAP income tax expense adjustments
$
191
$
227
$
(64)
Operating income tax expense (non-GAAP)
$
6,562
$
5,595
$
4,076
Operating effective tax rate (non-GAAP)
23.1 %
26.2 %
21.2 %
As of
June 30, 2026
March 31, 2026
June 30, 2025
Total shareholders’ equity (GAAP)
$
842,002
$
842,778
$
737,122
Subtract:
Intangible assets (core deposit intangible, net of tax and goodwill)
31,023
32,067
782
Total tangible shareholders’ equity (non-GAAP)
810,979
810,711
736,340
Total assets (GAAP)
7,446,880
7,226,649
5,226,618
Subtract:
Intangible assets (core deposit intangible, net of tax and goodwill)
31,023
32,067
782
Total tangible assets (non-GAAP)
$
7,415,857
$
7,194,582
$
5,225,836
Tangible shareholders’ equity / tangible assets (non-GAAP)
10.94 %
11.27 %
14.09 %
Total common shares outstanding
43,818,490
44,765,178
40,748,380
Tangible book value per share (non-GAAP)
$
18.51
$
18.11
$
18.07
NB BANCORP, INC.
ASSET QUALITY – NON-PERFORMING ASSETS (1)
(Unaudited)
(Dollars in thousands)
June 30, 2026
March 31, 2026
June 30, 2025
Real estate loans:
One-to-four-family residential
$
2,963
$
1,763
$
3,030
Home equity
1,547
1,673
1,368
Commercial real estate
957
394
1,984
Construction and land development
–
10
10
Commercial and industrial
20,446
38,885
4,558
Consumer
1,747
2,838
1,528
Total
$
27,660
$
45,563
$
12,478
Total non-performing loans to total loans
0.43 %
0.73 %
0.27 %
Total non-performing PCD loans to total loans (2)
0.22 %
0.49 %
0.00 %
Total non-performing non-PCD loans to total loans
0.21 %
0.24 %
0.27 %
Total non-performing assets to total assets
0.37 %
0.63 %
0.24 %
Total non-performing PCD assets to total assets
0.19 %
0.42 %
0.00 %
Total non-performing non-PCD assets to total assets
0.18 %
0.21 %
0.24 %
(1)
Non-performing loans and assets are comprised of non-accrual loans.
(2)
PCD loans were the result of the BankProv acquisition closed on 11/15/25 and did not exist prior to that date.
NB BANCORP, INC.
ASSET QUALITY – PROVISION, ALLOWANCE, AND NET (CHARGE-OFFS) RECOVERIES
(Unaudited)
(Dollars in thousands)
For the Three Months Ended
June 30, 2026
March 31, 2026
June 30, 2025
Allowance for credit losses at beginning of the period
$
80,195
$
87,411
$
38,338
Provision for credit losses
2,994
6,382
4,244
Charge-offs:
One-to-Four-Family Residential
—
(56)
—
Commercial & Industrial
(294)
(12,370)
—
Consumer
(2,081)
(1,409)
(1,190)
Commercial real estate
(10)
—
—
Total charge-offs
(2,385)
(13,835)
(1,190)
Recoveries of loans previously charged off:
Commercial and industrial
1,188
12
12
Commercial real estate
—
—
923
Consumer
96
225
274
Total recoveries
1,284
237
1,209
Net charge-offs
(1,101)
(13,598)
19
Allowance for credit losses at end of the period
$
82,088
$
80,195
$
42,601
Allowance to non-performing loans
297 %
176 %
341.4 %
Allowance to total loans outstanding at the end of the period
1.28 %
1.29 %
0.94 %
Annualized net charge-offs to average loans outstanding during the period
(0.07) %
(0.91) %
0.00 %
Annualized net charge-offs to average loans outstanding during the period – PCD loans (1)
0.00 %
(0.82) %
0.00 %
Annualized net charge-offs to average loans outstanding during the period – Non-PCD loans
(0.07) %
(0.08) %
0.00 %
(1)
PCD loans were the result of the BankProv acquisition closed on 11/15/25 and did not exist prior to that date.
View original content to download multimedia:https://www.prnewswire.com/news-releases/nb-bancorp-inc-reports-second-quarter-2026-financial-results-declares-quarterly-cash-dividend-302832578.html
SOURCE Needham Bank

You may like
Technology
Vertical IQ Will Expand Industry Intelligence Platform with Small Business Financial Exchange (SBFE) Small Business Credit Data
Published
28 minutes agoon
October 27, 2026By

RALEIGH, N.C., Oct. 27, 2026 /PRNewswire/ — Small Business Financial Exchange (SBFE), the trusted source for small business lending data and Vertical IQ, a nationally recognized provider of Industry Intelligence, today announced their partnership. Through the partnership, Vertical IQ will incorporate SBFE small business credit insights into its platform, providing financial institutions with deeper context to support commercial lending decisions.
The collaboration enables banks, credit unions, and other commercial lenders using Vertical IQ to gain access to SBFE small business credit insights within the Industry Intelligence platform. Default rates, delinquencies, and credit trends by industries are just a few of the SBFE features that will be included. These insights allow financial services professionals to better understand small business borrowers and support key commercial lending activities.
“At SBFE, we’re committed to helping lenders better understand and support small businesses. Extending access to SBFE insights through Vertical IQ is another way we can deliver value to the lending community and support greater access to capital.”
– Elisabeth MacDonald, President and CEO, SBFE
“At Vertical IQ, we believe financial institutions make their best decisions when they have access to trusted, Verified Industry Intelligence powered by the highest-quality data available,” said Bobby Martin, co-founder and CEO of Vertical IQ. “Our partnership with SBFE represents another important step in that commitment by bringing highly respected small business credit insights into our platform. By combining SBFE’s credit data with Vertical IQ’s industry expertise, we’re helping lenders gain deeper context to strengthen credit analysis, improve risk assessment, and make more confident decisions throughout the commercial lending lifecycle.”
– Bobby Martin, Co-founder and CEO, Vertical IQ
About SBFE
SBFE is the trusted data exchange where the small business lending industry comes together to strengthen access to capital for America’s small businesses. For more than 25 years, SBFE has united lenders in a member-driven community built on trust, collaboration, and the responsible use of data. Today, SBFE securely manages one of the nation’s largest repositories of small business credit data, contributed by more than 140 member institutions, including many of the country’s largest commercial banks. This data enables highly predictive credit reporting and portfolio management solutions that help lenders make more informed decisions, manage risk, and support the financial health and growth of small businesses. By transforming shared data into trusted lending intelligence, SBFE helps its members strengthen credit decisioning and promote greater access to capital. Learn more at www.SBFE.org
About Vertical IQ
Headquartered in Raleigh, North Carolina, Vertical IQ is a nationally recognized provider of Industry Intelligence. Whether discussing cash management with a local brewery or evaluating risk for a large manufacturing company, successful banks, credit unions, accounting firms, insurance organizations, and advisory firms use Vertical IQ to better understand a prospect’s or client’s business challenges before, during, and after meetings. Covering 100% of the industries that comprise the U.S. and Canadian economies, as well as more than 3,400 local economic reports, Vertical IQ equips professionals with the confidence and credibility to build stronger client relationships and make more informed decisions. Learn more at www.verticaliq.com
View original content to download multimedia:https://www.prnewswire.com/news-releases/vertical-iq-will-expand-industry-intelligence-platform-with-small-business-financial-exchange-sbfe-small-business-credit-data-302920872.html
SOURCE SBFE
Technology
CME Group Brazilian Real Futures Set New Daily Volume Record Following Election
Published
28 minutes agoon
October 27, 2026By
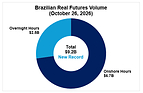
Record $9 billion notional traded, eleven times the year-to-date average daily volume (ADV) as market participants turned to CME Group to manage risk around the clock
CHICAGO, Oct. 27, 2026 /PRNewswire/ — CME Group, the world’s leading derivatives marketplace, today announced that its Brazilian real (BRL) futures reached a new daily volume record of 498,498 contracts (R$49.8 billion, ~$9.2 billion notional value) on October 26, surpassing the previous record of 191,325 contracts (~$3.7 billion notional value) traded on September 28, 2026.
“Following the results of the Brazilian presidential election, clients turned to our BRL futures market to immediately manage their risk outside of Brazilian trading hours, driving all-time record volume,” said Paul Houston, Global Head of FX Products, CME Group. “Even before the onshore market opened, $2.5 billion in notional value had already traded, roughly three times the year-to-date ADV for BRL futures. With liquidity in all timezones and contracts denominated in USD, our markets are fast becoming the main venue for Brazilian real price discovery and trading outside of onshore hours, giving global participants the liquidity they need around the clock.”
In the first half of 2026, Mexican peso and Brazilian real futures and options saw a record combined average daily volume of $2.94 billion.
For more information on CME Group BRL futures, please visit https://www.cmegroup.com/articles/faqs/latam-fx-futures-frequently-asked-questions.html
As the world’s leading derivatives marketplace, CME Group (www.cmegroup.com) enables clients to trade futures, options, cash and OTC markets, optimize portfolios, and analyze data – empowering market participants worldwide to efficiently manage risk and capture opportunities. CME Group exchanges offer the widest range of global benchmark products across all major asset classes based on interest rates, equity indexes, foreign exchange, cryptocurrencies, energy, agricultural products and metals. The company offers futures and options on futures trading through the CME Globex platform, fixed income trading via BrokerTec and foreign exchange trading on the EBS platform. In addition, it operates one of the world’s leading central counterparty clearing providers, CME Clearing.
CME Group, the Globe logo, CME, Chicago Mercantile Exchange, Globex, and E-mini are trademarks of Chicago Mercantile Exchange Inc. CBOT and Chicago Board of Trade are trademarks of Board of Trade of the City of Chicago, Inc. NYMEX, New York Mercantile Exchange and ClearPort are trademarks of New York Mercantile Exchange, Inc. COMEX is a trademark of Commodity Exchange, Inc. BrokerTec is a trademark of BrokerTec Americas LLC and EBS is a trademark of EBS Group LTD. The S&P 500 Index is a product of S&P Dow Jones Indices LLC (“S&P DJI”). “S&P®”, “S&P 500®”, “SPY®”, “SPX®”, US 500 and The 500 are trademarks of Standard & Poor’s Financial Services LLC; Dow Jones®, DJIA® and Dow Jones Industrial Average are service and/or trademarks of Dow Jones Trademark Holdings LLC. These trademarks have been licensed for use by Chicago Mercantile Exchange Inc. Futures contracts based on the S&P 500 Index are not sponsored, endorsed, marketed, or promoted by S&P DJI, and S&P DJI makes no representation regarding the advisability of investing in such products. All other trademarks are the property of their respective owners.
CME-G
View original content to download multimedia:https://www.prnewswire.com/news-releases/cme-group-brazilian-real-futures-set-new-daily-volume-record-following-election-302920902.html
SOURCE CME Group
Technology
Vera Health Quietly Became One of the World’s Most Used Clinical Tools. Now It Has Raised $32 Million to Give Every Clinician in the World the Best Medical Knowledge in Seconds
Published
28 minutes agoon
October 27, 2026By

With a team of just 12 employees, the clinical AI company has grown largely through physician referrals, bringing total funding to $32 million
More than 800,000 clinicians across 190 countries use Vera Health, including approximately 1 in 4 physicians in Spain and Italy, with most discovering the platform through recommendations from colleagues.Threshold Ventures led Vera Health’s $28.5 million Series A, with participation from Mantis VC and SV Angel. Existing investors Y Combinator and Gradient tripled down, bringing total funding to $32 million.The investment will accelerate Vera Health’s evidence-focused clinical AI platform, expanding its ability to make global medical knowledge locally relevant and deepening partnerships with medical societies, publishers and health systems.
SAN FRANCISCO, Oct. 27, 2026 /PRNewswire/ — A year ago, a few thousand clinicians were using Vera Health. Today, more than 800,000 are, most having discovered the platform through a colleague. Every month since June, Vera has been the most downloaded clinical app in the world across the App Store and Google Play.¹ In September alone, it was downloaded more times than OpenEvidence and Doximity combined, while monthly downloads had more than tripled since February. With a team of just 12 employees, Vera has reached clinicians in 190 countries, including approximately 1 in 4 physicians in Spain and Italy, largely through word of mouth. Vera Health is a clinical AI search engine that reasons like a clinician, helping physicians find and evaluate medical evidence in seconds.
Today, Vera Health announced a $28.5 million Series A led by Threshold Ventures, with participation from Mantis VC and SV Angel. Existing investors Y Combinator and Gradient, tripled down in the round, bringing the company’s total funding to $32 million. The investment will accelerate Vera Health’s mission to close the gap between what medicine knows and what every patient receives.
Only a few months after raising its Series A, Vera already has more daily active users than it had monthly active users at the time of the raise. Clinicians went from asking Vera a few thousand questions a day to asking hundreds of thousands, every single day.
“Clinicians are the best data scientists I’ve ever met. They make the call in seconds, with more evidence than any human could ever read,” said Taieb Bennani, Co-Founder of Vera Health. “The secret to building for them is to live and breathe the problem like no one else. Everyone on our team is a clinician, or the child or sibling of one, like Maxime and me. That passion translates into every detail of the product, and when you build with that kind of obsession, the product speaks for itself, and clinicians share it with their colleagues. We don’t have the biggest team or the most money. We have the people who care the most about getting it right.”
How does Vera Health differ from general-purpose AI tools?
Clinical AI is increasingly being used to help physicians navigate complex medical questions, but the ability to generate an accurate-sounding answer does not necessarily establish whether the underlying research is reliable. Medicine now publishes a new scientific paper roughly every 20 seconds. Chatbots are built to sound confident. Vera is built to be accurate, and honest when the evidence is thin. Physicians are expected to keep up with an expanding body of research while interpreting guidelines, evaluating treatment options and making decisions for individual patients, sometimes within seconds.
Vera Health finds the evidence first, then writes the answer. Its technology searches more than 60 million peer-reviewed publications, clinical guidelines, consensus statements and drug labels, evaluating sources based on study design, level of evidence, cohort size, recency, journal quality and citation impact. Every claim is linked to its supporting research and color-coded to show the strength of the available evidence. Sometimes that color is red. A rare condition may have no large randomized trial or comprehensive guideline behind it, leaving only a small case series or a report involving a single patient. Vera Health surfaces that research while making its limitations visible, allowing physicians to assess how much weight the findings deserve.
“Medical knowledge moves too quickly for any one clinician to read, and general-purpose AI tools can make uncertain evidence sound settled,” said Maxime Allouch, co-founder, Vera Health. “Unlike other tools, we believe there’s value in making uncertainty visible. The grade shapes what Vera retrieves and writes, while the clinician brings the patient, the context and the judgment.”
Vera Health developed its approach alongside physicians who evaluate medical evidence and help write the guidelines other clinicians follow. Through its partnership with the American College of Emergency Physicians (ACEP), the platform integrates ACEP clinical policies with source attribution, bringing medical society guidance directly into clinical research workflows.
“In medicine, not all evidence is equal,” said Scott M. Silvers, MD, FACEP, Chair of the American College of Emergency Physicians’ Clinical Policies Committee and former Chair of Emergency Medicine at Mayo Clinic. “A large, randomized trial and a case report should never carry the same weight, yet most AI tools blend them into the same confident answer. Level of evidence is the foundation of every guideline we write, and Vera Health is built on it.”
For Dr. Bernard P. Chang, Vera Health’s Chief Scientific Advisor and Vice Chair of Research in the Department of Emergency Medicine at Columbia University, the importance of clinical evidence extends to how physicians evaluate patients.
“On a recent emergency-department shift, I saw a young woman with cough and shortness of breath. The symptoms could easily be attributed to a routine respiratory illness,” said Chang. “Vera Health surfaced evidence that raised my concern for pulmonary embolism, a potentially life-threatening blood clot in the lungs, and led me to broaden my evaluation. What interests me isn’t AI simply providing an answer. It’s whether it can reliably surface evidence that challenges our initial assumptions and improves clinical reasoning. That’s what we’re now evaluating rigorously, inside the academic medical centers where medicine is actually practiced.”
Vera Health’s clinical advisors also include Christopher Baugh, MD, MBA, FACEP, Vice Chair of Clinical Affairs in Emergency Medicine at Brigham and Women’s Hospital and Associate Professor of Emergency Medicine at Harvard Medical School. Its clinical council includes physician leaders affiliated with Mayo Clinic, Yale, Harvard, Columbia and Penn.
Why is Vera Health growing so quickly across international markets?
Bennani and Allouch grew up in families of physicians and initially developed Vera Health for their own fathers. What began with two users has since grown into a platform serving hundreds of thousands of clinicians, with physicians asking hundreds of thousands of questions each day. The company’s international growth reflects an approach built around a central reality of medicine. Medical knowledge is global, but clinical practice is local.
An emergency physician in France may follow different treatment guidelines than a physician in the United States. An oncologist reviewing a complex case may need an exhaustive evaluation of the available research, while an emergency physician needs a concise answer within seconds. Even physicians practicing the same specialty may follow different protocols depending on their institution.
Vera Health accounts for those differences by prioritizing locally relevant guidance while drawing on medical research from around the world. Through Vera Spaces, health systems can also integrate their own clinical protocols and pathways alongside national guidelines and international medical literature.
“Medicine is global, yet most tools in our space were built for a single geography,” said Allouch. “We went international from day one, because only a global view reveals what is truly local.”
The approach has helped Vera Health expand across Europe, where approximately 1 in 4 physicians in Spain and Italy and 1 in 7 in France use the platform, according to company data. Vera Health has achieved that international reach with a small team and a product that clinicians have largely discovered through their peers.
What will Vera Health’s Series A funding support next?
The financing will support further development of Vera Health’s clinical evidence infrastructure, expansion into additional healthcare markets and deeper partnerships with medical societies, publishers and health systems. The company will continue investing in locally relevant clinical guidance and tools that allow healthcare institutions to incorporate their own medical knowledge into the platform.
“In healthcare, trust is earned, not bought. Vera’s adoption among clinicians worldwide speaks to what Taieb and Maxime have built. By combining the most rigorous medical evidence with an understanding of each physician’s specialty, protocols and practice context, Vera makes the world’s medical knowledge relevant to how care is actually delivered. We believe that creates an enormous opportunity to improve global health,” said Andrew Brackin, Partner at Gradient.
“Vera is compelling because it starts with the evidence, not just an answer—helping clinicians find and assess the research behind a decision while making its strengths and limitations visible. By bringing that evidence to the point of care, Vera becomes a trusted clinical intelligence layer, not just another AI tool,” said Emily Melton, co-founder and managing partner of Threshold Ventures.
Vera Health will remain free for licensed clinicians and medical trainees worldwide as it expands access to medical evidence and locally relevant clinical guidance.
New medical knowledge takes an estimated 17 years to reach routine clinical practice, according to research published in the Journal of the Royal Society of Medicine. Vera Health aims to reduce the time physicians spend searching for and evaluating that knowledge, bringing relevant evidence closer to the moment clinical decisions are made.
“Our mission is to close the gap between what medicine knows and what every patient receives,” said Bennani. “Today, that gap is measured in years. We want it measured in seconds.”
About Vera Health
Vera Health is the search engine that reasons like a clinician, finding and grading evidence before showing the source, strength and limits behind every answer. More than 800,000 clinicians in 190 countries use Vera, which is free for licensed clinicians and trainees, never trains on clinicians’ questions, and is HIPAA and GDPR compliant and SOC 2 Type II certified. Founded in 2024 at Y Combinator by MIT graduates and sons of physicians Taieb Bennani and Maxime Allouch, Vera is headquartered in San Francisco and backed by Threshold Ventures, Gradient, Y Combinator, SV Angel and Mantis VC.
Learn more at verahealth.ai.
¹ Download data: Appark, worldwide App Store and Google Play downloads, June through [September] 2026.
Media Contact
Interdependence
(949) 259-6377 x 225
425709@email4pr.com
View original content to download multimedia:https://www.prnewswire.com/news-releases/vera-health-quietly-became-one-of-the-worlds-most-used-clinical-tools-now-it-has-raised-32-million-to-give-every-clinician-in-the-world-the-best-medical-knowledge-in-seconds-302920905.html
SOURCE Vera Health


Vertical IQ Will Expand Industry Intelligence Platform with Small Business Financial Exchange (SBFE) Small Business Credit Data

CME Group Brazilian Real Futures Set New Daily Volume Record Following Election

Vera Health Quietly Became One of the World’s Most Used Clinical Tools. Now It Has Raised $32 Million to Give Every Clinician in the World the Best Medical Knowledge in Seconds

Send Rakhi to UK swiftly with UK Gifts Portal

Whiteboard Series with NEAR | Ep: 45 Joel Thorstensson from ceramic.network

Nullmax and Renesas Forge Strategic Partnership to Deliver Competitive ADAS Solutions for the Global Market

Why You Should Build on #NEAR – Co-founder Illia Polosukhin at CV Labs
Whiteboard Series with NEAR | Ep: 45 Joel Thorstensson from ceramic.network

NEAR End of Year Town Hall 2021: The Open Web World, MetaBUILD 2 Hackathon and 2021 recap
Trending
-

 Technology4 days ago
Miami Startup BOB Raises $5.5M To Build An AI-Powered Banking Platform
-

 Coin Market4 days ago
Bitcoin ETFs bleed $635M as October slides back into the red
-

 Coin Market4 days ago
Cysic dangles a 10% bounty, hacker pours loot into Tornado Cash
-

 Coin Market4 days ago
Ethereum delays Glamsterdam Hoodi testnet launch over security risks
-

 Coin Market4 days ago
Malaysia, Thailand join Singapore’s cross-border stablecoin push
-

 Technology4 days ago
Kin Becomes First U.S. Home Insurer to Enable WebMCP for AI Shopping
-

 Coin Market5 days ago
Winklevoss PAC moves into Texas Senate race with $81K ad buy
-

 Technology5 days ago
Lunai Bioworks Announces Receipt of Nasdaq Determination and Intention to Voluntarily Delist and Deregister