Connect with us

Technology

General Dynamics Reports Second-Quarter 2026 Financial Results

Published

on

Revenue $14.1 billion, up 8.1% versus prior yearDiluted EPS $4.24, up 13.4% versus prior year$1.9 billion cash from operating activities, 162% of net earnings1.4-to-1 book-to-bill, with strong order activity in all segments

RESTON, Va., July 29, 2026 /PRNewswire/ — General Dynamics (NYSE: GD) today reported second-quarter 2026 operating earnings of $1.5 billion, and $4.24 per diluted share (EPS), on revenue of $14.1 billion. Compared with the year-ago quarter, revenue increased 8.1%, operating earnings increased 11.9%, and diluted EPS increased 13.4%. Operating margin of 10.4% was a 40-basis-point expansion from the year-ago quarter.

“Our businesses delivered solid results in the quarter, with revenue growth across all four segments – including double-digit increases in revenue and noteworthy margin expansion in Aerospace and Marine Systems – reflecting our ongoing efforts to increase the pace of execution and deliver on our backlog,” said Phebe Novakovic, chairman and chief executive officer. “We are well positioned to support our customers’ needs and are continuing to make significant investments to increase output to meet strong and growing demand.”

Cash and Capital Deployment

Net cash provided by operating activities in the quarter totaled $1.9 billion, or 162% of net earnings. During the quarter, the company paid $429 million in dividends, invested $234 million in capital expenditures, and reduced total debt by $498 million. The company ended the quarter with $7.5 billion in total debt and $4.3 billion in cash and equivalents on hand.

Orders and Backlog

Orders received in the quarter totaled $14.7 billion in the defense segments and $5.3 billion in the Aerospace segment, for a total of $20 billion. Book-to-bill ratio, defined as orders divided by revenue, was 1.4-to-1 for the quarter for the defense segments, 1.5-to-1 for the Aerospace segment, and 1.4-to-1 on a company-wide basis. 

Backlog at the end of the quarter was $136.5 billion. Estimated potential contract value, representing management’s estimate of additional value in unfunded indefinite delivery, indefinite quantity (IDIQ) contracts and unexercised options, was $50.4 billion. Total estimated contract value, the sum of backlog plus estimated potential contract value, was $186.9 billion.

About General Dynamics

Headquartered in Reston, Virginia, General Dynamics is a global aerospace and defense company that offers a broad portfolio of products and services in business aviation; ship construction and repair; land combat vehicles, weapons systems and munitions; and technology products and services. General Dynamics employs more than 120,000 people worldwide and generated $52.6 billion in revenue in 2025. More information is available at www.gd.com.  

WEBCAST INFORMATION: General Dynamics’ financial results conference call will be held on Wednesday, July 29, 2026, at 9:00 a.m. EDT.  A link to the live webcast will be available at www.gd.com and will be available for replay following the call. Corresponding presentation slides will be available for download prior to the call.

This press release may contain forward-looking statements (FLS), including statements about the company’s future operational and financial performance, which are based on management’s expectations, estimates, projections and assumptions. Words such as “expects,” “anticipates,” “plans,” “believes,” “forecasts,” “scheduled,” “outlook,” “estimates,” “should” and variations of these words and similar expressions are intended to identify FLS. In making FLS, we rely on assumptions and analyses based on our experience and perception of historical trends; current conditions and expected future developments; and other factors, estimates and judgments we consider reasonable and appropriate based on information available to us at the time. FLS are made pursuant to the safe harbor provisions of the Private Securities Litigation Reform Act of 1995, as amended. FLS are not guarantees of future performance and involve factors, risks and uncertainties that are difficult to predict. Actual future results and trends may differ materially from what is forecast in the FLS. All FLS speak only as of the date they were made. We do not undertake any obligation to update or publicly release revisions to FLS to reflect events, circumstances or changes in expectations after the date of this press release. Additional information regarding these factors is contained in the company’s filings with the SEC, and these factors may be revised or supplemented in future SEC filings. In addition, this press release may contain some financial measures not prepared in accordance with U.S. generally accepted accounting principles (GAAP). While we believe these non-GAAP metrics provide useful information for investors, there are limitations associated with their use, and our calculations of these metrics may not be comparable to similarly titled measures of other companies. Non-GAAP metrics should not be considered in isolation from, or as a substitute for, GAAP measures. Reconciliations to comparable GAAP measures and other information relating to our non-GAAP measures are included in other filings with the SEC, which are available at investorrelations.gd.com.

EXHIBIT A

CONSOLIDATED STATEMENT OF EARNINGS – (UNAUDITED)

DOLLARS IN MILLIONS, EXCEPT PER SHARE AMOUNTS

Three Months Ended

Variance

July 5, 2026

June 29, 2025

$

%

Revenue

$                     14,094

$                     13,041

$     1,053

8.1 %

Operating costs and expenses

(12,634)

(11,736)

(898)

Operating earnings

1,460

1,305

155

11.9 %

Other, net

(4)

15

(19)

Interest, net

(49)

(88)

39

Earnings before income tax

1,407

1,232

175

14.2 %

Provision for income tax, net

(247)

(218)

(29)

Net earnings

$                       1,160

$                       1,014

$        146

14.4 %

Earnings per share—basic

$                         4.29

$                         3.78

$       0.51

13.5 %

Basic weighted average shares outstanding

270.2

268.1

Earnings per share—diluted

$                         4.24

$                         3.74

$       0.50

13.4 %

Diluted weighted average shares outstanding

273.5

270.9


EXHIBIT B

CONSOLIDATED STATEMENT OF EARNINGS – (UNAUDITED)

DOLLARS IN MILLIONS, EXCEPT PER SHARE AMOUNTS

Six Months Ended

Variance

July 5, 2026

June 29, 2025

$

%

Revenue

$                     27,575

$                     25,264

$     2,311

9.1 %

Operating costs and expenses

(24,695)

(22,691)

(2,004)

Operating earnings

2,880

2,573

307

11.9 %

Other, net

14

36

(22)

Interest, net

(118)

(177)

59

Earnings before income tax

2,776

2,432

344

14.1 %

Provision for income tax, net

(491)

(424)

(67)

Net earnings

$                       2,285

$                       2,008

$        277

13.8 %

Earnings per share—basic

$                         8.46

$                         7.48

$       0.98

13.1 %

Basic weighted average shares outstanding

270.2

268.6

Earnings per share—diluted

$                         8.35

$                         7.40

$       0.95

12.8 %

Diluted weighted average shares outstanding

273.8

271.3


EXHIBIT C

REVENUE AND OPERATING EARNINGS BY SEGMENT – (UNAUDITED)

DOLLARS IN MILLIONS

Three Months Ended

Variance

July 5, 2026

June 29, 2025

$

%

Revenue:

Aerospace

$                  3,525

$                   3,062

$            463

15.1 %

Marine Systems

4,660

4,220

440

10.4 %

Combat Systems

2,290

2,283

7

0.3 %

Technologies

3,619

3,476

143

4.1 %

Total

$                14,094

$                 13,041

$         1,053

8.1 %

Operating earnings:                                           

Aerospace

$                     510

$                      403

$            107

26.6 %

Marine Systems

342

291

51

17.5 %

Combat Systems

318

324

(6)

(1.9) %

Technologies

339

332

7

2.1 %

Corporate

(49)

(45)

(4)

(8.9) %

Total

$                  1,460

$                   1,305

$            155

11.9 %

Operating margin:

Aerospace

14.5 %

13.2 %

Marine Systems

7.3 %

6.9 %

Combat Systems

13.9 %

14.2 %

Technologies

9.4 %

9.6 %

Total

10.4 %

10.0 %


EXHIBIT D

REVENUE AND OPERATING EARNINGS BY SEGMENT – (UNAUDITED)

DOLLARS IN MILLIONS

Six Months Ended

Variance

July 5, 2026

June 29, 2025

$

%

Revenue:

Aerospace

$                  6,804

$                   6,088

$            716

11.8 %

Marine Systems

9,003

7,809

1,194

15.3 %

Combat Systems

4,573

4,459

114

2.6 %

Technologies

7,195

6,908

287

4.2 %

Total

$                27,575

$                 25,264

$         2,311

9.1 %

Operating earnings:                                          

Aerospace

$                  1,003

$                      835

$            168

20.1 %

Marine Systems

658

541

117

21.6 %

Combat Systems

628

615

13

2.1 %

Technologies

678

660

18

2.7 %

Corporate

(87)

(78)

(9)

(11.5) %

Total

$                  2,880

$                   2,573

$            307

11.9 %

Operating margin:

Aerospace

14.7 %

13.7 %

Marine Systems

7.3 %

6.9 %

Combat Systems

13.7 %

13.8 %

Technologies

9.4 %

9.6 %

Total

10.4 %

10.2 %


EXHIBIT E

CONSOLIDATED BALANCE SHEET

DOLLARS IN MILLIONS

(Unaudited)

July 5, 2026

December 31, 2025

ASSETS

Current assets:

Cash and equivalents

$                        4,333

$                        2,333

Accounts receivable

2,398

2,406

Unbilled receivables

9,255

8,380

Inventories

9,097

9,232

Other current assets

1,955

1,897

Total current assets

27,038

24,248

Noncurrent assets:

Property, plant and equipment, net

7,575

7,525

Intangible assets, net

1,281

1,375

Goodwill

20,927

21,009

Other assets

3,342

3,092

Total noncurrent assets

33,125

33,001

Total assets

$                      60,163

$                      57,249

LIABILITIES AND SHAREHOLDERS’ EQUITY

Current liabilities:

Short-term debt and current portion of long-term debt                                                  

$                        1,256

$                        1,006

Accounts payable

2,874

2,678

Customer advances and deposits

11,034

9,824

Other current liabilities

3,601

3,288

Total current liabilities

18,765

16,796

Noncurrent liabilities:

Long-term debt

6,260

7,007

Other liabilities

8,312

7,824

Total noncurrent liabilities

14,572

14,831

Shareholders’ equity:

Common stock

482

482

Surplus

4,535

4,403

Retained earnings

45,502

44,080

Treasury stock

(23,110)

(22,860)

Accumulated other comprehensive loss

(583)

(483)

Total shareholders’ equity

26,826

25,622

Total liabilities and shareholders’ equity

$                      60,163

$                      57,249


EXHIBIT F

CONSOLIDATED STATEMENT OF CASH FLOWS – (UNAUDITED)

DOLLARS IN MILLIONS

Six Months Ended

July 5, 2026

June 29, 2025

Cash flows from operating activities—continuing operations:

Net earnings

$                      2,285

$                      2,008

Adjustments to reconcile net earnings to net cash from operating activities:              

Depreciation of property, plant and equipment

348

325

Amortization of intangible and finance lease right-of-use assets

115

121

Equity-based compensation expense

107

89

Deferred income tax provision (benefit)

365

(98)

(Increase) decrease in assets, net of effects of business acquisitions:

Accounts receivable

8

(612)

Unbilled receivables

(846)

(200)

Inventories

135

(207)

Increase (decrease) in liabilities, net of effects of business acquisitions:

Accounts payable

196

(261)

Customer advances and deposits

1,168

106

Other, net

154

179

Net cash provided by operating activities

4,035

1,450

Cash flows from investing activities:

Capital expenditures

(437)

(340)

Other, net

13

124

Net cash used by investing activities

(424)

(216)

Cash flows from financing activities:

Dividends paid

(834)

(785)

Repayment of fixed-rate notes

(500)

(1,500)

Purchases of common stock

(319)

(600)

Proceeds from commercial paper, net

—

696

Proceeds from fixed-rate notes

—

747

Other, net

48

39

Net cash used by financing activities

(1,605)

(1,403)

Net cash used by discontinued operations

(6)

(5)

Net increase (decrease) in cash and equivalents

2,000

(174)

Cash and equivalents at beginning of period

2,333

1,697

Cash and equivalents at end of period

$                      4,333

$                      1,523


EXHIBIT G

ADDITIONAL FINANCIAL INFORMATION – (UNAUDITED)

DOLLARS IN MILLIONS, EXCEPT PER SHARE AMOUNTS

Non-GAAP Financial Measures:

Second Quarter

Six Months

2026

2025

2026

2025

Free cash flow:

Net cash provided by operating activities 

$                       1,880

$                  1,598

$                    4,035

$                    1,450

Capital expenditures

(234)

(198)

(437)

(340)

Free cash flow (a)

$                       1,646

$                  1,400

$                    3,598

$                    1,110

July 5, 2026

December 31, 2025

Net debt:

Total debt

$                       7,516

$                  8,013

Less cash and equivalents

4,333

2,333

Net debt (b)

$                       3,183

$                  5,680

Supplemental Aerospace Data:

Second Quarter

Six Months

2026

2025

2026

2025

Gulfstream Aircraft Deliveries (units):

Large-cabin aircraft

35

32

66

62

Mid-cabin aircraft

6

6

13

12

Total

41

38

79

74

Aerospace Book-to-Bill:

Orders (c)

$                       5,278

$                  4,003

$                    9,121

$                    6,364

Revenue

3,525

3,062

6,804

6,088

Book-to-Bill Ratio

1.5x

1.3x

1.3x

1.0x

(a)  

We define free cash flow as net cash from operating activities less capital expenditures. We believe free cash flow is a useful measure

for investors because it portrays our ability to generate cash from our businesses for purposes such as repaying debt, funding business

acquisitions, paying dividends and repurchasing our common stock to cover dilution. We use free cash flow to assess the quality of our

earnings and as a key performance measure in evaluating management.

(b)

We define net debt as short- and long-term debt (total debt) less cash and equivalents. We believe net debt is a useful measure for

investors because it reflects the borrowings that support our operations and capital deployment strategy. We use net debt as an

important indicator of liquidity and financial position.

(c)

Excludes customer defaults, liquidated damages, cancellations, foreign exchange fluctuations and other backlog adjustments.


EXHIBIT H

BACKLOG – (UNAUDITED)

DOLLARS IN MILLIONS

Funded

Unfunded

Total

Backlog

Estimated

Potential

Contract Value*

Total

Estimated

Contract Value

Second Quarter 2026:                         

Aerospace

$            22,992

$                 985

$            23,977

$                     1,170

$               25,147

Marine Systems

42,356

22,826

65,182

7,442

72,624

Combat Systems

27,507

1,843

29,350

10,847

40,197

Technologies

11,256

6,733

17,989

30,945

48,934

Total

$          104,111

$            32,387

$          136,498

$                   50,404

$             186,902

First Quarter 2026:

Aerospace

$            21,172

$              1,095

$            22,267

$                     1,040

$               23,307

Marine Systems

40,598

23,373

63,971

12,519

76,490

Combat Systems

25,532

1,383

26,915

11,770

38,685

Technologies

10,818

6,869

17,687

32,272

49,959

Total

$            98,120

$            32,720

$          130,840

$                   57,601

$             188,441

Second Quarter 2025:      

Aerospace

$            18,676

$              1,227

$            19,903

$                     1,165

$               21,068

Marine Systems

39,298

13,674

52,972

14,708

67,680

Combat Systems

15,961

616

16,577

9,592

26,169

Technologies

9,945

4,285

14,230

32,011

46,241

Total

$            83,880

$            19,802

$          103,682

$                   57,476

$             161,158

*   

The estimated potential contract value includes work awarded on unfunded indefinite delivery, indefinite quantity (IDIQ) contracts and

unexercised options associated with existing firm contracts, including options and other agreements with existing customers to purchase

new aircraft and aircraft services. We recognize options in backlog when the customer exercises the option and establishes a firm order.

For IDIQ contracts, we evaluate the amount of funding we expect to receive and include this amount in our estimated potential contract

value. The actual amount of funding received in the future may be higher or lower than our estimate of potential contract value.


EXHIBIT H-1

BACKLOG – (UNAUDITED)

DOLLARS IN MILLIONS

https://mmx.prnewswire.com/media/MS1959817/GD-Q2.jpg?id=OA2797589

View original content to download multimedia:https://www.prnewswire.com/news-releases/general-dynamics-reports-second-quarter-2026-financial-results-302836859.html

SOURCE General Dynamics

Continue Reading

Technology

Unity: The Convergence of the Three Main Red Army Forces

Published

on

By

BEIJING, Oct. 21, 2026 /PRNewswire/ — An interview from China.org.cn with Wang Xiaohui and David Ferguson on the Long March:

Wang Xiaohui:

We have all been through something similar — a group of people disagreeing with one another, with each side holding sound reasons to believe their own judgment is correct.

In such moments, should they part ways, or find another path forward together?

David Ferguson:

The word “unity” is often understood as a strategy. People unite when they face a common enemy, and when that enemy disappears, the cooperation ends with it. But I’ve always wondered if there is a different kind of unity — one not forged by a common enemy, but by a common destination. A unity that isn’t temporary, that doesn’t fall apart the moment circumstances change. I wanted to find out.

Wang Xiaohui:

An arduous expedition like the Long March posed unparalleled trials for any military unit.

Bitter cold on snow-capped mountains, hidden mire across marshlands, and dangers lurking every step of the way; food and warm clothes were constantly scarce, while enemies and artillery fire were relentless. Even so, through the Long March, these poorly equipped and raggedly dressed Red Army troops remained tightly bonded as one.

This bond was not coerced by harsh military discipline, but arose spontaneously from every soldier’s heart. Before they even set off, shared ideals and conviction had already taken deep root within every soldier, steeling their resolve to follow the Communist Party of China without hesitation. Along the trail, officers and soldiers of the Red Army ate from the same pots and wore uniforms made from the same coarse cloth. High-ranking commanders like Zhu De and Peng Dehuai covered most of the journey on foot alongside their troops, leaving their horses to the ill and wounded, while splitting their last rations with soldiers. Amid food shortages, even when columns in the front discovered edible greens, they would never dig them all up; instead, they sent words to rear units so that all troops could share.

The Red Army’s unity took root in shared ideals, flourished under equal treatment for all, and was forged through countless moments of entrusting each other with their lives. It also became the unshakable foundation that carried them through every ordeal.

In the late autumn of 1936, the Loess Plateau in northwestern China witnessed two hopeful rendezvous, marking the Long March’s triumphant close. First in Huining, soldiers of the First and Fourth Front Armies embraced in a long-awaited reunion. Just over 10 days later, at Jiangtaibu, the waiting First Front Army finally greeted the travel-worn soldiers of the Second Front Army.

Many of these soldiers had never met before, yet they greeted one another like long-lost brothers, eyes brimming with tears as they clasped hands. Officers and soldiers of the First Front Army sent whatever supplies they had saved up to their brother troops. Three battle-hardened columns merged into a mighty iron stream across the plateau. Just one month later, they fought in coordinated formation to secure triumph in the battle of Shanchengbao, putting a glorious full stop to the Long March.

When scattered sparks merge, inherent unity surges into a mighty force, powerful enough to rewrite an army’s fate and shift the course of a nation’s history.

At the time, Japanese invaders advanced deeper into China, occupying more and more territory, yet the civil war persisted. The CPC clearly understood that brutal conflict among the Chinese would only play to the invaders’ hands, and only national unity could safeguard the motherland. The CPC publicly called for an end to the civil war and joint resistance against Japanese invaders, officially proposed to build the national united front against Japanese aggression, and even took the initiative to halt military operations and withdraw troops as a gesture of goodwill — when the survival of a nation hung by a thread, they chose to unite all Chinese people.

The two KMT officers, Zhang Xueliang and Yang Hucheng, who were stationed in the northwest, witnessed the nation’s peril and were touched by the CPC’s advocacy of a united resistance. Resolved to collaborate with the CPC to fend off Japanese aggression, Zhang and Yang repeatedly pleaded with Chiang Kai-shek to shift focus to national defense, but to no avail. Ultimately, they detained Chiang by force, which later became known as the Xi’an Incident.

When word spread of Chiang’s detention, many assumed the CPC would demand a public trial, given years of bitter partisan strife. Instead, Zhou Enlai personally traveled to Xi’an with the CPC delegation to mediate, laying out the stakes for all parties concerned: executing Chiang would only result in a much larger-scale civil war, handing the Japanese aggressors golden opportunities to advance further into China. The only path to a promising future for the Chinese nation lay in a peaceful settlement that would compel Chiang to join the resistance against Japanese aggression.

Setting aside partisan divisions and prioritizing the supreme interests of the nation — this was the answer delivered by the CPC. At last, the Xi’an Incident was settled in peace, bringing an end to a decade of war. Since then, the Chinese nation finally stood united in fighting back against foreign invasion.

Nearly a century has passed, yet the spirit of unity forged on the Long March has never faded.

In September 1949, the First Plenary Session of the Chinese People’s Political Consultative Conference (CPPCC) was convened, officially instituting the system of multiparty cooperation and political consultation under the leadership of the Communist Party of China. The spirit of solidarity tempered amid the Long March was thereafter embedded in the very fabric of China’s governance system, with unity becoming one of its enduring tenets.

From the early reconstruction years since the founding of the People’s Republic of China in 1949, through the era of reform and opening up since 1978, to today’s march toward China’s modernization, each successive trial has burnished this core spirit of unity. In the fight against absolute poverty, the whole nation pulled together as a single force: the more developed eastern regions lent robust support to underdeveloped western regions, officials devoted themselves to working at grassroots communities, and local residents worked hard and strove for self-improvement. Together, hundreds of millions of Chinese worked to eradicate absolute poverty nationwide. When earthquakes and floods struck, rescue teams rushed to disaster zones from every corner of the country, while relief supplies and charitable donations poured in ceaselessly.

From the helping hands extended between soldiers along the Long March to the nationwide solidarity repeatedly demonstrated today, the essence of unity has never changed. It was the key that carried the Red Army through seemingly impossible odds, and it endures as China’s bedrock strength that propels China forward to this day.

David Ferguson:

After hearing the stories of the reunion of the three main forces of the Red Army and the Xi’an Incident, I found my answer.

The Long March showed me that unity is a condition for survival — not in the sense of “I need you for now, so let’s work together.” Rather, it was “We believe in a common cause, so we must stand together.” That kind of unity does not dissolve when the danger is gone, because it is rooted not in fear, but in conviction.

Whether I look at stories of the Long March or at China’s development today, what strikes me is not simply unity itself. What gives unity its power is the shared ideal that enables people to stand together, and the common mission that at critical moments, enables them to rise above the interests of the individual, of groups, and even of political parties.

Wang Xiaohui:

From the arduous trails of the Long March to the contemporary journey of national rejuvenation, when a group of people or a whole nation stand united around common ideals, they will always arrive at the future they hoped for, no matter how lengthy and winding the road ahead is.

China Mosaic 
http://www.china.org.cn/video/node_7230027.htm 

Unity: The Convergence of the Three Main Red Army Forces
http://www.china.org.cn/2026-10/20/content_118741729.shtml 


View original content to download multimedia:https://www.prnewswire.com/news-releases/unity-the-convergence-of-the-three-main-red-army-forces-302914999.html

SOURCE China.org.cn

Continue Reading

Technology

KingClean Debuts at the 140th Canton Fair with One-Stop ODM Solutions for Global Brands

Published

on

By

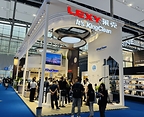
GUANGZHOU, China, Oct. 21, 2026 /PRNewswire/ — KingClean, a global leader in home appliances and cleaning solutions, showcased its latest smart home product line at the 140th Canton Fair, which includes cleaning appliances, kitchen and coffee equipment, drinking equipment, personal care and air comfort products. During the exhibition, KingClean held in-depth discussions with global channel partners at Booths E30–36 and F13–19, Hall 2.2, Zone A.

KingClean showcased over 40 innovative products. The cleaning appliances exhibition area covers cordless stick vacuum cleaners with docking stations, upright 3-in-1 wet-and-dry vacuum cleaner with steam, spot cleaner with steam, cordless mattress cleaners and canister. The kitchen appliance exhibition area showcases products such as cooking robot, commercial blenders, and fully automatic coffee machines. The water & beverage solutions area presents desktop intelligent water purifiers with functions of water purification, sparkling water, ice making, and tea brewing. In addition, KingClean balances personal care with environmental comfort, showcasing water-ion turbofan hair dryers, desktop air purifiers, and smart air circulation fans.

The collaboration between high-performance cleaning equipment and intelligent base stations is the key direction of this exhibition. The exhibits include cordless vacuum cleaners equipped with high-power motors, dust‑cup or dust‑bag docking stations, charging and automatic cleaning functions, as well as floor cleaning vacuum cleaners that integrate functions of steam cleaning, automatic water refilling, and hot air drying. Multiple reference models intuitively demonstrate how the same technology platform can flexibly adapt to different power levels, structural schemes, and accessory configurations.

KingClean also showcased a series of home fully automatic coffee machines, smoothies and ice-making equipment, as well as desktop intelligent beverage purifiers that supported flexible combinations of sparkling water, ice water, tea brewing, and coffee related modules in the beverage area. These exhibits could be further customized based on the customer’s beverage menus, usage frequency, and after-sales mode.

“We connect globally through innovative products, focusing on smart solutions that improve life and strengthen our leadership in the smart home industry” said Nate Yang, Senior Marketing Director at KingClean Electric Co., Ltd.

About KingClean

KingClean was founded in 1994 and is headquartered in Suzhou, China. The company specializes in high-end smart home appliances and mechatronic products, with motor as our core technology.

For more information, visit http://www.kingclean.com.

View original content to download multimedia:https://www.prnewswire.com/news-releases/kingclean-debuts-at-the-140th-canton-fair-with-one-stop-odm-solutions-for-global-brands-302914851.html

SOURCE KingClean

Continue Reading

Technology

Husqvarna Group: INTERIM REPORT JANUARY – SEPTEMBER 2026

Published

on

By

STOCKHOLM, Oct. 21, 2026 /PRNewswire/ — 

Consistent strategy execution in a continued challenging market 

Third quarter 2026

Net sales decreased organically by 5%.Net sales decreased by 2% to SEK 9,012m (9,204), and included a positive impact of 3% from changes in exchange rates.Operating income amounted to SEK -334m (141) and the operating margin was -3.7% (1.5).Items affecting comparability (IAC) amounted to SEK -88m. These were primarily related to the execution of cost-saving initiatives.Excluding IAC, operating income amounted to SEK -246m (140), and the operating margin was -2.7% (1.5).Earnings per share (EPS) after dilution amounted to SEK -0.70 (-0.02) and EPS excluding IAC and after dilution amounted to SEK -0.58 (-0.02).Free operating cash flow was SEK 2,422m (2,423).Net debt was SEK 9.4bn (9.9).

January – September 2026

Net sales decreased organically by 2%.Net sales decreased by 5% to SEK 37,356m (39,184), and included an impact of -3% from changes in exchange rates.Operating income amounted to SEK 2,977m (3,735) and the operating margin was 8.0% (9.5).Items affecting comparability (IAC) amounted to SEK -445m. These were primarily related to the execution of cost-saving initiatives.Excluding IAC, operating income amounted to SEK 3,421m (3,742), and the operating margin was 9.2% (9.5).IEEPA-related tariff refunds of SEK 240m were recognized in COGS during the second quarter.Earnings per share (EPS) after dilution amounted to SEK 3.14 (4.43) and EPS excluding IAC and after dilution amounted to SEK 3.74 (4.44).Free operating cash flow was SEK 4,891m (4,743).

CEO Comment

We are making solid progress on our strategic priorities. Our cost savings program remains on track, recent product launches are receiving encouraging customer feedback, and we are broadening our presence across sales channels. Although these measures have not yet fully offset current market headwinds, they reinforce our confidence in the Group’s long-term competitiveness and prospects.

Financial performance summary

Net sales were SEK 9,012m (9,204), representing an organic decline of 5% in the quarter, primarily driven by continued weakness in Europe. Organic sales in the Husqvarna Forest & Garden Division declined by 10%, sales in the Husqvarna Construction Division were unchanged, while the Gardena Division delivered solid organic growth of 8%. Performance in the Husqvarna Forest & Garden Division was significantly affected by the widespread drought across large parts of Europe and continued weak consumer demand in key markets, including Germany and France. In contrast, strong growth in the Gardena Division’s Watering business highlighted the resilience of our diversified portfolio, gaining market shares in key markets, and the Husqvarna Construction Division has continued good momentum in its aftermarket business. I am also encouraged by continued growth across all three divisions in North America.

Operating income excluding IAC was SEK -246m (140), corresponding to a margin of -2.7% (1.5). The result reflected lower volumes in the Husqvarna Forest & Garden Division, an unfavorable product mix, inventory reductions and cost increases on raw materials and logistics costs. Free operating cash flow was stable at SEK 2,422m (2,423), as lower operating income was offset by changes in working capital, primarily driven by reduced inventories. We further strengthened the balance sheet, reducing net debt to SEK 9.4bn (9.9).

Executing on cost savings while navigating cost headwinds

Our transformative cost savings program remains on track to deliver SEK 3bn in gross savings by the end of 2028. Year-to-date savings reached approximately SEK 935m, including around SEK 305m in the third quarter, driven mainly by sourcing activities and personnel reductions. However, lower volumes, inventory reductions and cost headwinds continue to weigh on profitability. We are responding with targeted price increases, supply chain actions and product cost optimization, which will partly offset these pressures, although near-term headwinds are expected to remain.

We are advancing our asset-light strategy through further outsourcing initiatives. We will transfer production of selected Husqvarna-branded battery handheld products from Europe to Asia, using both our own facilities and external partners to enhance efficiency and competitiveness.

In addition, the ongoing discontinuation of the stone diamond tool business in the Construction Division, the phase-out of our Brastad component factory in the Husqvarna Forest & Garden Division and relocation of selected activities within Gardena’s European manufacturing network are progressing according to plan.

Unlocking the next phase of robotics growth

Our robotic lawn mowing business faced a difficult quarter, with adverse weather, competitive headwinds, and elevated channel partner inventories in Europe constraining demand for Husqvarna- and Gardena-branded products. Although recent performance has fallen short of expectations, we remain the clear market leader and we are confident in our strategy and longer-term development.

The strategic review of the Powered Garden BPU in the Gardena Division is ongoing and we aim to provide an update in the beginning of next year. Our priorities in the Husqvarna Forest & Garden Residential Robotics BPU include expanding our retail footprint and product range across price points and channels, strengthening the robotics organization and development model.

During the quarter, the US became the largest market in terms of sales for our Professional Robotics BPU, driven mainly by continued growth in the golf segment. Upcoming product launches and broader US distribution are expected to further strengthen our competitive position next season. We are also encouraged to be the first robotics company to receive conditional approval from the Federal Communications Commission (FCC) for foreign-produced advanced robotic devices in the US market.

Building a stronger, more competitive Husqvarna Group

We are accelerating change across the Group to create a leaner, more agile and asset-light organization. By challenging established ways of working, simplifying operations and acting decisively, we are strengthening competitiveness and profitability in the longer-term. Significant work remains, but I am confident we are moving in the right direction.

When consumer sentiment recovers, particularly in Europe, we will be well positioned to capture growth and improve earnings.

Glen Instone, CEO

Webcast presentation and telephone conference

A webcast presentation of the Q3 report hosted by Glen Instone, CEO and Patrik Johnson, CFO will be held at 9:00 CEST on Oct 21, 2026.
To view the presentation, please use this link.
The dial-in to the telephone conference (to ask questions):
+46 (0) 8 505 100 31 (Sweden) or +44 203 059 58 63 (UK)

Contact
Emelie Alm, Vice President, Investor Relations
+46 70 514 64 14

Husqvarna AB (publ), P.O. Box 7454, SE-103 92 Stockholm
Hälsingegatan 49, +46 8 738 90 00, www.husqvarnagroup.com

Reg. Nr: 556000-5331

(NASDAQ STOCKHOLM: HUSQ-A) (NASDAQ STOCKHOLM: HUSQ-B)

This report contains insider information that Husqvarna AB is required to disclose under the EU Market Abuse Regulation. The information was submitted for publication, through the contact person set out above, at 07:00 CEST on Oct 21, 2026.

Factors affecting forward-looking statements

This report contains some forward-looking statements. These statements are subject to risks and uncertainties that may give rise to major deviations in the result due to several aspects. These aspects include, among other things: consumer demand and market conditions in the geographical areas and lines of business in which Husqvarna operates, the effects of currency fluctuations, downward pressure on prices due to competition, success in developing new products, outcome of product responsibility litigation and progress in terms of reaching the goals set for productivity and efficient use of capital.

This information was brought to you by Cision http://news.cision.com

https://news.cision.com/husqvarna-group/r/interim-report-january—september-2026,c4412543

The following files are available for download:

https://mb.cision.com/Main/996/4412543/4328797.pdf

Interim report Q3 2026 Husqvarna Group


View original content:https://www.prnewswire.com/news-releases/husqvarna-group-interim-report-january–september-2026-302915009.html

SOURCE Husqvarna Group

Continue Reading

Trending