Technology
Camden National Bank Names Josh Nash Chief Technology Officer, Advancing Its Digital Innovation Strategy
Published
1 hour agoon
By
Promotion reinforces Camden National Bank’s investment in secure technology, stronger data capabilities, and continued digital progress.
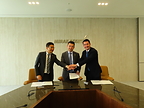
CAMDEN, Maine, Aug. 3, 2026 /PRNewswire/ — Camden National Bank announced today that Josh Nash has been promoted to Executive Vice President, Chief Technology Officer, succeeding William “Bill” Martel, who has retired after a distinguished career with the Bank.
In his expanded role, Nash will lead enterprise technology strategy, including infrastructure, cybersecurity, business intelligence, data governance, and digital transformation. Known for pairing technical depth with practical execution, he has helped modernize Camden National Bank’s technology architecture and strengthen the data capabilities that support growth, faster decision-making, and a stronger customer experience.
“Josh brings the rare combination of deep technical expertise, strategic judgment, and people-first leadership that today’s banking environment requires,” said Simon Griffiths, President and Chief Executive Officer of Camden National Bank. “He has been instrumental in building the technology and data foundation that will help us continue to innovate responsibly and deliver a best-in-class customer experience.”
Nash has more than a decade of progressive leadership experience in financial services technology. Most recently, he served as Senior Vice President, Director of Technology, Business Intelligence, and Loan Operations, where he led advances in cloud migration, automation, cybersecurity modernization, data governance, and AI-enabled capabilities.
Nash’s leadership was recently highlighted at Snowflake Summit 26, where his well-attended presentation showcased how Camden National Bank is moving from AI pilot to production with trusted data in Snowflake. He outlined the framework his team is using to bring trusted data into Snowflake with Qlik and Passerelle’s Data Rocket, expand adoption across business lines through education and enablement, and build the foundation for how the Bank will use data and AI responsibly. Camden National Bank’s progress is reflected in measurable results, including a 250% year-over-year increase in analytic data product output, and in the speed with which Nash’s team is making trusted data and AI capabilities more accessible to business users and senior leaders.
“Camden National Bank is demonstrating what’s possible when trusted data becomes the foundation for innovation,” said James McGeehan, Head of Banking and Payments, Financial Services, Snowflake. “Josh and his team have taken a thoughtful approach to modernizing their data strategy—creating a scalable foundation that supports not only what the business needs today – it’s architected for what AI will demand tomorrow.”
Nash holds a master’s degree in information systems and a bachelor’s degree in psychology from the University of Maine. His credentials include CISA, PMP, CEH, and CGEIT certifications.
About Camden National Bank
Camden National Corporation (NASDAQ: CAC) is Northern New England’s largest publicly traded bank holding company, with $7.0 billion in assets. Founded in 1875, Camden National Bank, with 72 banking centers in Maine and New Hampshire, is a full-service community bank offering modern digital banking services, complemented by award-winning, personalized support. Additional information is available at CamdenNational.bank. Member FDIC. Equal Housing Lender.
Comprehensive wealth management, investment, and financial planning services are delivered by Camden National Wealth Management.
View original content to download multimedia:https://www.prnewswire.com/news-releases/camden-national-bank-names-josh-nash-chief-technology-officer-advancing-its-digital-innovation-strategy-302841389.html
SOURCE Camden National Bank
You may like
Technology
SU GROUP HOLDINGS LIMITED RECEIVES NASDAQ STAFF DELISTING DETERMINATION AND INTENDS TO REQUEST HEARING
Published
20 minutes agoon
August 3, 2026By
Timely hearing request will stay suspension of trading and Form 25 filing pending Nasdaq Hearings Panel decision; approved share consolidation expected on or about August 6, 2026 may enable the Company to regain compliance prior to the hearing
HONG KONG, Aug. 3, 2026 /PRNewswire/ — SU Group Holdings Limited (Nasdaq: SUGP) (“SU Group” or the “Company”), an integrated security-related services company in Hong Kong, today announced that on August 3, 2026, it received a written determination letter (the “Staff Determination”) from the Listing Qualifications Department of The Nasdaq Stock Market LLC (“Nasdaq”), notifying the Company that Nasdaq has determined to delist the Company’s Class A ordinary shares from The Nasdaq Capital Market unless the Company timely requests a hearing before a Nasdaq Hearings Panel (the “Panel”).
The Staff Determination was issued because the closing bid price of the Company’s Class A ordinary shares was below $1.00 per share for 30 consecutive business days from June 18, 2026 through July 31, 2026, and the Company therefore did not satisfy the minimum bid price requirement set forth in Nasdaq Listing Rule 5550(a)(2).
Because the Company effected a one-for-ten share consolidation, or reverse stock split, on August 25, 2025, Nasdaq Listing Rule 5810(c)(3)(A)(iv) provides that the Company is not eligible for the compliance period that would otherwise be available under Nasdaq’s standard minimum bid price deficiency framework. Accordingly, Nasdaq issued the Staff Determination, subject to the Company’s right to appeal the determination to the Panel.
The Company intends to timely request a hearing before the Panel pursuant to Nasdaq Listing Rule 5815(a). Consistent with the Staff Determination, a timely hearing request will stay the suspension of trading in the Company’s Class A ordinary shares and the filing of a Form 25-NSE pending the Panel’s decision. Accordingly, the Staff Determination has no immediate effect on the listing or trading of the Company’s Class A ordinary shares, which will continue to trade on The Nasdaq Capital Market under the symbol “SUGP” during the hearing process. If the Company regains compliance with the minimum bid price requirement prior to the hearing, it may not be necessary for the Company to proceed to the Panel hearing.
In connection with its hearing request, the Company intends to present its plan to regain compliance with Nasdaq’s continued listing requirements. The Company’s board of directors and shareholders have approved a further share consolidation at a ratio of 1-for-5, which is expected to become effective on August 6, 2026, to restore compliance with the minimum bid price requirement. If, following the share consolidation, the closing bid price of the Company’s Class A ordinary shares equals or exceeds $1.00 per share for the minimum period required under applicable Nasdaq rules, the Company may regain compliance with Nasdaq Listing Rule 5550(a)(2) and the Panel hearing may not need to proceed. The Company intends to notify Nasdaq promptly if and when it has regained compliance following the share consolidation.
There can be no assurance that the approved share consolidation will result in a sustained increase in the bid price of the Company’s Class A ordinary shares to at or above $1.00 per share, that the Company will regain compliance with the minimum bid price requirement prior to the Panel hearing, that the Panel will grant the Company’s request for continued listing if a hearing proceeds, that the Company will be able to regain compliance with the applicable continued listing requirements within any period granted by the Panel, or that the Company’s Class A ordinary shares will remain listed on The Nasdaq Capital Market.
About SU Group Holdings Limited
SU Group (Nasdaq: SUGP) is an integrated security-related services company that primarily provides security-related engineering services, security guarding and screening services, and related vocational training services in Hong Kong. Through its subsidiaries, SU Group has been providing turnkey services to the existing infrastructure or planned development of its customers through the design, supply, installation, and maintenance of security systems for over two decades. The security systems that SU Group provides services include threat detection systems, traffic and pedestrian control systems, and extra-low voltage systems in private and public sectors, including commercial properties, public facilities, and residential properties in Hong Kong. For more information visit www.sugroup.com.hk.
Forward-Looking Statements
The Company makes forward-looking statements in this report within the meaning of the Private Securities Litigation Reform Act of 1995. These forward-looking statements involve known and unknown risks and uncertainties, including the expected effectiveness of the share consolidation on or about August 6, 2026, the possibility that the Company may regain compliance with Nasdaq’s minimum bid price requirement following the share consolidation and that the Panel hearing may not need to proceed, and are based on the Company’s current expectations and projections about future events that the Company believes may affect its financial condition, results of operations, business strategy and financial needs. These statements may be preceded by, followed by or include the words “may,” “might,” “will,” “will likely result,” “should,” “estimate,” “plan,” “project,” “forecast,” “intend,” “expect,” “anticipate,” “believe,” “seek,” “continue,” “target” or similar expressions. These forward-looking statements are based on information available to the Company as of the date of this report and involve substantial risks and uncertainties. Actual results may vary materially from those expressed or implied by the forward-looking statements herein due to a variety of factors, and other risks and uncertainties set forth in our reports filed with the U.S. Securities and Exchange Commission. The Company does not undertake any obligation to update forward-looking statements as a result of new information, future events or developments or otherwise.
View original content to download multimedia:https://www.prnewswire.com/news-releases/su-group-holdings-limited-receives-nasdaq-staff-delisting-determination-and-intends-to-request-hearing-302841459.html
SOURCE SU Group Holdings Limited
Technology
Ultra Clean Reports Second Quarter 2026 Financial Results
Published
20 minutes agoon
August 3, 2026By
HAYWARD, Calif., Aug. 3, 2026 /PRNewswire/ — Ultra Clean Holdings, Inc. (Nasdaq: UCTT), today reported its financial results for the second quarter ended June 26, 2026.
“UCT delivered second quarter results above the top end of our guided range reflecting strong operational execution and increasing customer demand,” said James Xiao, CEO. “The long-term outlook for semiconductor manufacturing remains compelling as AI continues to drive investment across the industry. Our priority is executing UCT 3.0 by expanding our global manufacturing capacity, enhancing engineering and operational capabilities, and accelerating digital transformation. Together, these initiatives position us to support our customers with greater speed, agility, and scale while delivering sustainable, profitable growth and creating long-term value for our shareholders.”
Second Quarter 2026 GAAP Financial Results
Total revenue was $644.9 million. Products contributed $572.7 million and Services added $72.2 million. Total gross margin was 16.1%, operating margin was 4.6%, and net income was $8.7 million or $0.19 per diluted share. This compares to total revenue of $533.7 million, gross margin of 15.8%, operating margin of 2.1%, and net loss of $(17.9) million or $(0.40) per diluted share, in the prior quarter.
Second Quarter 2026 Non-GAAP Financial Results
On a non-GAAP basis, gross margin was 16.7%, operating margin was 7.0%, and net income was $32.3 million or $0.70 per diluted share. This compares to gross margin of 16.5%, operating margin of 5.1%, and net income of $14.5 million or $0.31 per diluted share in the prior quarter.
Third Quarter 2026 Outlook
The Company expects revenue in the range of $700 million to $750 million. The Company expects GAAP diluted net income per share to be between $0.67 and $0.87 and non-GAAP diluted net income per share to be between $0.83 and $1.03.
Conference Call
The call will take place at 1:45 p.m. PT and can be accessed by dialing 1-800-836-8184 or 1-646-357-8785. No passcode is required. A replay of the call will be available by dialing 1-888-660-6345 or 1-646-517-4150 and entering the confirmation code 68934#. The Webcast will be available on the Investor Relations section of the Company’s website at http://uct.com/investors/events/.
About Ultra Clean Holdings, Inc.
Ultra Clean Holdings, Inc. is a leading developer and supplier of critical subsystems, components, parts, and ultra-high purity cleaning and analytical services, primarily for the semiconductor industry. Under its Products division, UCT offers its customers an integrated outsourced solution for major subassemblies, improved design-to-delivery cycle times, design for manufacturability, prototyping, and high-precision manufacturing. Under its Services Division, UCT offers its customers tool chamber parts cleaning and coating, as well as micro-contamination analytical services. Ultra Clean is headquartered in Hayward, California. Additional information is available at www.uct.com.
Use of Non-GAAP Measures
In addition to providing results that are determined in accordance with Generally Accepted Accounting Principles in the United States of America (“GAAP”), management uses non-GAAP gross margin, non-GAAP operating margin and non-GAAP net income to evaluate the Company’s operating and financial results. We believe the presentation of non-GAAP results is useful to investors for analyzing our core business and business trends and comparing performance to prior periods, along with enhancing investors’ ability to view the Company’s results from management’s perspective. The presentation of this additional information should not be considered a substitute for results prepared in accordance with GAAP. Tables presenting reconciliations from GAAP results to non-GAAP results are included at the end of this press release.
The Company defines non-GAAP net income as net loss before amortization of intangible assets, stock-based compensation, restructuring charges, debt refinancing costs, legal-related costs, unrealized loss (gain) on foreign exchange, and the tax effects of the foregoing adjustments.
A reconciliation of our guidance for non-GAAP net income per diluted share for the subsequent quarter is not available due to fluctuations in the geographic mix of our earnings from quarter to quarter, which impacts our tax rate and cannot be reasonably predicted or determined. As a result, such reconciliation is not available without unreasonable efforts and we are unable to determine the probable significance of the unavailable information.
Safe Harbor Statement
The foregoing information contains, or may be deemed to contain, “forward-looking statements” (as defined in the US Private Securities Litigation Reform Act of 1995) which reflect our current views with respect to future events and financial performance. We use words such as “anticipates,” “projection,” “outlook,” “forecast,” “believes,” “plan,” “expect,” “future,” “intends,” “may,” “will,” “estimates,” “see,” “predicts,” “should” and similar expressions to identify these forward-looking statements. Forward looking statements included in this press release include our expectations about the semiconductor capital equipment market and outlook. All forward-looking statements address matters that involve risks and uncertainties. Accordingly, the Company’s actual results may differ materially from the results predicted or implied by these forward-looking statements. These risks, uncertainties and other factors also include, among others, those identified in “Risk Factors,” “Management’s Discussion and Analysis of Financial Condition and Results of Operations” and elsewhere in our annual report on Form 10-K for the year ended December 26, 2025, as filed with the Securities and Exchange Commission. Ultra Clean Holdings, Inc. undertakes no obligation to publicly update or review any forward-looking statements, whether as a result of new information, future developments or otherwise unless required by law.
Contact:
Rhonda Bennetto
SVP Investor Relations
rbennetto@uct.com
ULTRA CLEAN HOLDINGS, INC.
CONDENSED CONSOLIDATED STATEMENTS OF OPERATIONS
(Unaudited; in millions, except per share data)
Three Months Ended
Six Months Ended
June 26,
2026
June 27,
2025
June 26,
2026
June 27,
2025
Revenues:
Products
$ 572.7
$ 454.9
$ 1,038.4
$ 911.9
Services
72.2
63.9
140.2
125.5
Total revenues
644.9
518.8
1,178.6
1,037.4
Cost of revenues:
Products
488.8
393.3
889.5
783.5
Services
52.4
46.0
101.0
90.4
Total cost revenues
541.2
439.3
990.5
873.9
Gross margin
103.7
79.5
188.1
163.5
Operating expenses:
Research and development
8.8
7.8
17.4
15.4
Sales and marketing
16.4
15.5
31.9
30.5
General and administrative
49.0
46.9
98.0
95.4
Impairment of goodwill
—
151.1
—
151.1
Total operating expenses
74.2
221.3
147.3
292.4
Income (loss) from operations
29.5
(141.8)
40.8
(128.9)
Interest income
1.0
0.8
2.4
1.9
Interest expense
(1.1)
(10.1)
(8.3)
(20.0)
Other income (expense), net
0.6
(2.2)
(0.7)
(1.3)
Income (loss) before provision for income taxes
30.0
(153.3)
34.2
(148.3)
Provision for income taxes
18.1
7.2
37.2
14.6
Net income (loss)
11.9
(160.5)
(3.0)
(162.9)
Less: Net income attributable to noncontrolling
interests
3.2
1.5
6.2
4.1
Net income (loss) attributable to UCT
$ 8.7
$ (162.0)
$ (9.2)
$ (167.0)
Net income (loss) per share attributable to UCT common stockholders:
Basic
$ 0.19
$ (3.58)
$ (0.20)
$ (3.70)
Diluted
$ 0.19
$ (3.58)
$ (0.20)
$ (3.70)
Shares used in computing net income (loss) per share:
Basic
45.1
45.2
45.2
45.2
Diluted
46.1
45.2
45.2
45.2
ULTRA CLEAN HOLDINGS, INC.
CONDENSED CONSOLIDATED BALANCE SHEETS
(Unaudited; in millions)
June 26,
2026
December 26,
2025
ASSETS
Current assets:
Cash and cash equivalents
$ 255.9
$ 311.8
Accounts receivable, net of allowance for credit losses
208.0
208.8
Inventories
629.9
390.9
Prepaid expenses and other current assets
66.7
48.2
Total current assets
1,160.5
959.7
Property, plant and equipment, net
323.7
324.6
Goodwill
114.2
114.2
Intangible assets, net
143.2
156.8
Deferred tax assets, net
4.4
3.5
Operating lease right-of-use assets
158.1
157.2
Other non-current assets
14.0
13.0
Total assets
$ 1,918.1
$ 1,729.0
LIABILITIES AND STOCKHOLDERS’ EQUITY
Current liabilities:
Current portion of long-term debt
$ —
$ 9.9
Accounts payable
300.6
194.9
Accrued compensation and related benefits
62.4
51.1
Operating lease liabilities
21.5
20.2
Other current liabilities
40.2
24.6
Total current liabilities
424.7
300.7
Long-term debt
599.4
467.0
Deferred tax liabilities
14.1
13.8
Operating lease liabilities
155.0
156.6
Other liabilities
7.8
6.8
Total liabilities
1,201.0
944.9
Equity:
UCT stockholders’ equity:
Common stock
0.1
0.1
Additional paid-in capital
560.8
578.7
Common shares held in treasury
(88.7)
(48.4)
Retained earnings
180.0
189.2
Accumulated other comprehensive loss
(12.4)
(8.6)
Total UCT stockholders’ equity
639.8
711.0
Noncontrolling interests
77.3
73.1
Total equity
717.1
784.1
Total liabilities and equity
$ 1,918.1
$ 1,729.0
ULTRA CLEAN HOLDINGS, INC.
CONDENSED CONSOLIDATED STATEMENTS OF CASH FLOWS
(Unaudited; in millions)
Six Months Ended
June 26,
2026
June 27,
2025
(In millions)
Cash flows from operating activities:
Net loss
$ (3.0)
$ (162.9)
Adjustments to reconcile net loss to net cash provided by (used in) operating
activities:
Depreciation and amortization
24.8
23.4
Amortization of intangible assets
13.7
14.3
Stock-based compensation
9.6
10.0
Amortization of debt issuance costs
1.6
1.1
Impairment of goodwill
—
151.1
Loss on extinguishment of debt
3.4
—
Loss on disposal of property, plant and equipment
1.2
0.1
Change in the fair value of financial instruments
—
(0.1)
Deferred income taxes
(0.5)
0.6
Changes in assets and liabilities:
Accounts receivable
0.8
34.3
Inventories
(238.9)
5.4
Prepaid expenses and other current assets
(13.8)
(7.8)
Other non-current assets
0.9
(0.5)
Accounts payable
104.4
(11.9)
Accrued compensation and related benefits
11.3
(2.6)
Income taxes payable
(2.5)
(4.2)
Operating lease right-of-use assets and operating lease liabilities
(1.2)
11.1
Other liabilities
13.8
(4.0)
Net cash provided by (used in) operating activities
(74.4)
57.4
Cash flows from investing activities:
Purchases of property, plant and equipment
(25.8)
(29.2)
Proceeds from sale of equipment
0.1
0.1
Net cash used in investing activities
(25.7)
(29.1)
Cash flows from financing activities:
Proceeds from the issuance of convertible notes
600.0
—
Borrowings on revolving credit facility
15.0
—
Proceeds from issuance of common stock
1.1
1.1
Payment of debt issuance costs
(17.4)
(0.6)
Repurchase of common stock
(40.0)
(3.4)
Payment for capped call transactions
(25.1)
—
Principal payments on bank borrowings
(481.5)
(15.1)
Employees’ taxes paid upon vesting of restricted stock units
(3.5)
(0.7)
Payments of dividends to a joint venture shareholder
(0.1)
(0.1)
Net cash provided by (used in) financing activities
48.5
(18.8)
Effect of exchange rate changes on cash and cash equivalents
(4.3)
4.0
Net increase (decrease) in cash and cash equivalents
(55.9)
13.5
Cash and cash equivalents at beginning of period
311.8
313.9
Cash and cash equivalents at end of period
$ 255.9
$ 327.4
ULTRA CLEAN HOLDINGS, INC.
REPORTABLE SEGMENTS
GAAP TO NON-GAAP RECONCILIATION
(Unaudited; dollars in millions)
GAAP
Non-GAAP
Three Months Ended
Three Months Ended
June 26, 2026
June 26, 2026
Products
Services
Consolidated
Products
Services
Consolidated
Revenues
$ 572.7
$ 72.2
$ 644.9
$ 572.7
$ 72.2
$ 644.9
Gross profit
$ 83.9
$ 19.8
$ 103.7
$ 86.7
$ 20.9
$ 107.6
Gross margin
14.6 %
27.4 %
16.1 %
15.1 %
28.9 %
16.7 %
Income from operations
$ 24.8
$ 4.7
$ 29.5
$ 37.0
$ 8.1
$ 45.1
Operating margin
4.3 %
6.6 %
4.6 %
6.5 %
11.2 %
7.0 %
Three Months Ended
June 26, 2026
Products
Services
Consolidated
Reconciliation of GAAP Gross profit to Non-GAAP Gross profit (in millions)
Reported gross profit on a GAAP basis
$ 83.9
$ 19.8
$ 103.7
Amortization of intangible assets (1)
1.3
1.0
2.3
Stock-based compensation expense (2)
1.5
—
1.5
Restructuring charges (3)
—
0.1
0.1
Non-GAAP gross profit
$ 86.7
$ 20.9
$ 107.6
Reconciliation of GAAP Gross margin to Non-GAAP Gross margin
Reported gross margin on a GAAP basis
14.6 %
27.4 %
16.1 %
Amortization of intangible assets (1)
0.2 %
1.4 %
0.4 %
Stock-based compensation expense (2)
0.3 %
— %
0.2 %
Restructuring charges (3)
— %
0.1 %
— %
Non-GAAP gross margin
15.1 %
28.9 %
16.7 %
Reconciliation of GAAP Income from operations to Non-GAAP Income from operations (in millions)
Reported income from operations on a GAAP basis
$ 24.8
$ 4.7
$ 29.5
Amortization of intangible assets (1)
3.9
2.9
6.8
Stock-based compensation expense (2)
7.6
0.5
8.1
Restructuring charges (3)
0.7
—
0.7
Non-GAAP income from operations
$ 37.0
$ 8.1
$ 45.1
Reconciliation of GAAP Operating margin to Non-GAAP Operating margin
Reported operating margin on a GAAP basis
4.3 %
6.6 %
4.6 %
Amortization of intangible assets (1)
0.7 %
4.0 %
1.0 %
Stock-based compensation expense (2)
1.3 %
0.6 %
1.3 %
Restructuring charges (3)
0.1 %
— %
0.1 %
Non-GAAP operating margin
6.5 %
11.2 %
7.0 %
1 Amortization of intangible assets related to the Company’s business acquisitions
2 Represents compensation expense for stock granted to employees and directors
3 Represents costs associated with employee separation, severance, retention, and other expenses related to facility closures
ULTRA CLEAN HOLDINGS, INC.
UNAUDITED RECONCILIATION OF GAAP TO NON-GAAP ADJUSTED RESULTS
Three Months Ended
June 26,
2026
June 27,
2025
March 27,
2026
Reconciliation of GAAP Net Income (Loss) to Non-GAAP Net Income (in millions)
Reported net income (loss) attributable to UCT on a GAAP basis
$ 8.7
$ (162.0)
$ (17.9)
Amortization of intangible assets (1)
6.8
7.0
6.9
Stock-based compensation expense (2)
8.1
7.1
4.0
Restructuring charges (3)
0.7
4.8
4.8
Debt refinancing costs expensed (4)
0.7
—
3.0
Legal-related costs (5)
—
0.3
—
Unrealized loss (gain) on foreign exchange (6)
(1.9)
3.7
(1.1)
Impairment of goodwill (7)
—
151.1
—
Income tax effect of non-GAAP adjustments (8)
(2.9)
(34.9)
(3.5)
Income tax effect of valuation allowance (9)
12.1
37.9
18.3
Non-GAAP net income attributable to UCT
$ 32.3
$ 15.0
$ 14.5
Reconciliation of GAAP Income (Loss) from operations to Non-GAAP Income from operations (in millions)
Reported income (loss) from operations on a GAAP basis
$ 29.5
$ (141.8)
$ 11.4
Amortization of intangible assets (1)
6.8
7.0
6.9
Stock-based compensation expense (2)
8.1
7.1
4.0
Restructuring charges (3)
0.7
4.8
4.8
Legal-related costs (5)
—
0.3
—
Impairment of goodwill (7)
—
151.1
—
Non-GAAP income from operations
$ 45.1
$ 28.5
$ 27.1
Reconciliation of GAAP Operating margin to Non-GAAP Operating margin
Reported operating margin on a GAAP basis
4.6 %
(27.3) %
2.1 %
Amortization of intangible assets (1)
1.0 %
1.3 %
1.3 %
Stock-based compensation expense (2)
1.3 %
1.4 %
0.8 %
Restructuring charges (3)
0.1 %
0.9 %
0.9 %
Legal-related costs (5)
— %
0.1 %
— %
Impairment of goodwill (7)
— %
29.1 %
— %
Non-GAAP operating margin
7.0 %
5.5 %
5.1 %
Reconciliation of GAAP Gross profit to Non-GAAP Gross profit (in millions)
Reported gross profit on a GAAP basis
$ 103.7
$ 79.5
$ 84.4
Amortization of intangible assets (1)
2.3
2.3
2.3
Stock-based compensation expense (2)
1.5
0.4
1.2
Restructuring charges (3)
0.1
2.4
0.3
Non-GAAP gross profit
$ 107.6
$ 84.6
$ 88.2
Reconciliation of GAAP Gross margin to Non-GAAP Gross margin
Reported gross margin on a GAAP basis
16.1 %
15.3 %
15.8 %
Amortization of intangible assets (1)
0.4 %
0.4 %
0.4 %
Stock-based compensation expense (2)
0.2 %
0.1 %
0.2 %
Restructuring charges (3)
— %
0.5 %
0.1 %
Non-GAAP gross margin
16.7 %
16.3 %
16.5 %
Reconciliation of GAAP Other income (expense), net to Non-GAAP Other income (expense), net (in millions)
Reported Other income (expense), net on a GAAP basis
$ 0.6
$ (2.2)
$ (1.3)
Debt refinancing costs expensed (4)
0.7
—
3.0
Unrealized loss (gain) on foreign exchange (6)
(1.9)
3.7
(1.1)
Non-GAAP Other income (expense), net
$ (0.6)
$ 1.5
$ 0.6
Reconciliation of GAAP Income (Loss) Per Diluted Share to Non-GAAP Earnings Per Diluted Share
Reported net income (loss) on a GAAP basis
$ 0.19
$ (3.58)
$ (0.40)
Amortization of intangible assets (1)
0.15
0.15
0.15
Stock-based compensation expense (2)
0.18
0.16
0.09
Restructuring charges (3)
0.01
0.10
0.10
Debt refinancing costs expensed (4)
0.01
—
0.06
Legal-related costs (5)
—
0.01
—
Unrealized loss (gain) on foreign exchange (6)
(0.04)
0.08
(0.02)
Impairment of goodwill (7)
—
3.34
—
Income tax effect of non-GAAP adjustments (8)
(0.06)
(0.77)
(0.08)
Income tax effect of valuation allowance (9)
0.26
0.84
0.40
Impact of dilutive shares
—
—
0.01
Non-GAAP net earnings
$ 0.70
$ 0.33
$ 0.31
Weighted average number of diluted shares (in millions) on a
non-GAAP basis (10)
46.0
45.3
46.3
ULTRA CLEAN HOLDINGS, INC.
UNAUDITED RECONCILIATION OF GAAP TO NON-GAAP EFFECTIVE INCOME TAX RATE
Three Months Ended
June 26,
2026
June 27,
2025
March 27,
2026
Provision for income taxes on a GAAP basis
$ 18.1
$ 7.2
$ 19.2
Income tax effect of non-GAAP adjustments (8)
2.9
34.9
3.5
Income tax effect of valuation allowance (9)
(12.1)
(37.9)
(18.3)
Non-GAAP provision for income taxes
$ 8.9
$ 4.2
$ 4.4
Income before income taxes on a GAAP basis
$ 30.0
$ (153.3)
$ 4.2
Amortization of intangible assets (1)
6.8
7.0
6.9
Stock-based compensation expense (2)
8.1
7.1
4.0
Restructuring charges (3)
0.7
4.8
4.8
Debt refinancing costs expensed (4)
0.7
—
3.0
Legal-related costs (5)
—
0.3
—
Unrealized loss (gain) on foreign exchange (6)
(1.9)
3.7
(1.1)
Impairment of goodwill (7)
—
151.1
—
Non-GAAP income before income taxes
$ 44.4
$ 20.7
$ 21.8
Effective income tax rate on a GAAP basis
60.3 %
(4.7) %
457.1 %
Non-GAAP effective income tax rate
20.0 %
20.3 %
20.0 %
1
Amortization of intangible assets related to the Company’s business acquisitions
2
Represents compensation expense for stock granted to employees and directors
3
Represents costs associated with employee separation, severance, retention, and other expenses related to facility closures
4
Represents certain third party transaction costs related to the amended credit agreement and the previously capitalized costs of extinguished debt
5
Represents estimated costs related to certain legal proceedings
6
Represents unrealized foreign exchange gains and losses arising from the remeasurement of monetary assets and liabilities
7
Represents non-cash charges related to the impairment of goodwill
8
Tax effect of items (1) through (7) above based on the non-GAAP tax rate
9
The Company’s GAAP tax expense is generally higher than the Company’s non-GAAP tax expense, primarily due to losses in the U.S. with full federal and state valuation allowances. The Company’s non-GAAP tax rate and resulting non-GAAP tax expense considers the tax implications as if there was no federal or state valuation allowance position in effect
10
Non-GAAP diluted weighted-average common shares are adjusted to reflect the dilutive impact of our convertible note based on the higher note hedge strike price instead of the initial conversion price
View original content to download multimedia:https://www.prnewswire.com/news-releases/ultra-clean-reports-second-quarter-2026-financial-results-302841520.html
SOURCE Ultra Clean Holdings, Inc.
Technology
PrideStaff Sacramento (West) Relocates to Support Continued Growth
Published
21 minutes agoon
August 3, 2026By
SACRAMENTO, Calif., Aug. 3, 2026 /PRNewswire/ — PrideStaff, a nationally franchised staffing organization, announced that its Sacramento (West) office will relocate to a new facility effective August 2026, providing expanded space and improved accessibility for clients, candidates, and staff while supporting the office’s continued growth throughout the region, including accounting and finance roles through PrideStaff Financial.
The PrideStaff Sacramento (West) office will relocate to:
3831 N. Freeway Blvd., Suite 105
Sacramento, CA
The new location reflects the office’s ongoing commitment to delivering exceptional staffing and workforce solutions while creating an even better experience for employers and job seekers throughout the greater Sacramento area.
Led by Owners/Strategic-Partners Jeff Foldenauer and Craig Ryder, the Sacramento (West) office serves businesses across a wide range of industries by connecting organizations with qualified talent and helping job seekers find rewarding employment opportunities.
“The growth we’ve experienced is a direct reflection of the trust our clients and candidates place in us every day,” said Jeff Foldenauer. “Our new office provides a more welcoming environment where we can continue building strong relationships, better serve our community and help even more businesses and job seekers achieve their goals,” said Craig Ryder.
The relocation reinforces PrideStaff’s continued investment in the Sacramento market and its mission to “consistently provide client experiences focused on what they value most.” The expanded office will support the team’s ability to collaborate more effectively while enhancing visitors’ experience.
“Our franchise owners continue to invest in their communities by creating environments that reflect PrideStaff’s commitment to outstanding service,” said Tammi Heaton, Co-CEO of PrideStaff. “Jeff and Craig have built a respected presence in the West Sacramento market, and this new location positions them to continue delivering exceptional experiences for clients and candidates while supporting future growth.”
About PrideStaff
PrideStaff was founded in the 1970s as 100% company-owned units and began franchising in 1995. It operates offices in North America to serve thousands of clients and is headquartered in Central California. With 45-plus years in the staffing business, PrideStaff offers the resources and expertise of a national firm, with the spirit, dedication, and personal service of smaller, entrepreneurial firms. PrideStaff is the only nationwide commercial staffing firm in the U.S. and Canada with over $100 million in annual revenue to earn ClearlyRated’s prestigious Best of Staffing® 15-Year Diamond Awards three years in a row, highlighting exceptional client and talent service quality.
For more information on our services, or for staffing franchise information, visit our website.
View original content to download multimedia:https://www.prnewswire.com/news-releases/pridestaff-sacramento-west-relocates-to-support-continued-growth-302841433.html
SOURCE PrideStaff
SU GROUP HOLDINGS LIMITED RECEIVES NASDAQ STAFF DELISTING DETERMINATION AND INTENDS TO REQUEST HEARING
Ultra Clean Reports Second Quarter 2026 Financial Results
PrideStaff Sacramento (West) Relocates to Support Continued Growth
Send Rakhi to UK swiftly with UK Gifts Portal
Whiteboard Series with NEAR | Ep: 45 Joel Thorstensson from ceramic.network
New Gooseneck Omni Antennas Offer Enhanced Signals in a Durable Package
Why You Should Build on #NEAR – Co-founder Illia Polosukhin at CV Labs
Whiteboard Series with NEAR | Ep: 45 Joel Thorstensson from ceramic.network
NEAR End of Year Town Hall 2021: The Open Web World, MetaBUILD 2 Hackathon and 2021 recap
Trending
-
Technology5 days agoMAC.BID Brings $1 Online Auctions & Deep Retail Discounts to the St. Louis Metro
-
Near Videos4 days agoThe next AI power users won’t be big companies.
-
Technology5 days agoBingX Strengthens Market Confidence with Dedicated Trust Center
-
Coin Market5 days agoUS arbitration giant launches specialist panel for crypto disputes
-
Coin Market5 days agoLuno cuts 20% of staff as crypto layoffs spread across 12 firms in July
-
Technology4 days ago37th Parallel Properties Expands Dallas-Fort Worth Footprint with Off-Market Acquisition of 222-Unit Woodbridge Villas
-
Coin Market5 days agoBinance.US to attempt prediction markets entry as CFTC-licensed entity, says CEO
-
Coin Market5 days agoCrypto entering biggest consolidation phase in history, says ARK analyst