
Technology
DuPont Reports Second Quarter 2026 Results

Published
2 months agoon
By

Exceeds Second Quarter 2026 Guidance
Raises Full Year 2026 Guidance
Second Quarter 2026 Highlights
Net Sales of $1.8 billion increased 4%; organic sales increased 4% versus year-ago periodGAAP Income from continuing operations of $191 million; operating EBITDA of $448 millionGAAP EPS from continuing operations of $1.37; adjusted EPS of $1.88Cash provided by operating activities from continuing operations of $400 million; transaction-adjusted free cash flow of $326 million representing 127% conversionAnnounces intent to repurchase $250 million of shares in the third quarterAnnounces the Company’s Global Industry Classification Standard (GICS) code has changed to Industrials effective July 31, 2026
WILMINGTON, Del., Aug. 4, 2026 /PRNewswire/ — DuPont (NYSE: DD) announced its financial results(1) for the second quarter ended June 30, 2026 and raised financial guidance for the full year 2026.
“We delivered another strong quarter, exceeding our financial guidance and demonstrating our focus on consistent execution” said Lori Koch, DuPont Chief Executive Officer. “Mid-single digit organic growth, strong margin expansion, coupled with robust adjusted EPS growth and free cash flow generation underscore the strength of our market-leading businesses and reflect disciplined execution of our strategic priorities, supported by our ongoing focus on excellence and productivity.”
“We are delivering on our commitments, creating value for all of our key stakeholders and further strengthening the foundation for sustainable, long-term profitable growth,” Koch concluded.
Second Quarter 2026 Consolidated Results(1)
Dollars in millions, except EPS
2Q’26
2Q’25
Change
vs. 2Q’25
Organic Sales (2)
vs. 2Q’25
Net sales
$1,819
$1,749
4 %
4 %
GAAP Income from continuing operations
$191
$24
n.m.
Operating EBITDA(2)
$448
$423
6 %
Operating EBITDA margin(2) %
24.6 %
24.2 %
40 bps
GAAP EPS from continuing operations
$1.37
$0.17
n.m.
Adjusted EPS(2)
$1.88
$1.27
48 %
Cash provided by operating activities – cont. ops.
$400
$74
n.m.
Transaction-adjusted free cash flow(2)
$326
$107
205 %
Net sales
Net sales were up 4% on a 4% increase in organic sales.4% organic sales growth in Healthcare & Water Technologies; 3% organic sales growth in Diversified Industrials.
GAAP Income from continuing operations
GAAP Income/GAAP EPS from continuing operations improved on higher segment earnings and lower interest expense and transaction costs.
Operating EBITDA
Operating EBITDA increased on organic growth and productivity.
Adjusted EPS
Adjusted EPS increased on higher segment earnings, lower net interest expense and a lower tax rate.
Cash provided by operating activities from continuing operations
Cash provided by operating activities from continuing operations in the quarter of $400 million, capital expenditures of $76 million and separation-related transaction costs and other payments of $2 million resulted in transaction-adjusted free cash flow and related conversion of $326 million and 127%, respectively.
(1)
Results and cash flows are presented on a continuing operations basis. See page 6 for further information, including the basis of presentation included in this release.
(2)
Organic sales, operating EBITDA, operating EBITDA margin, adjusted EPS, transaction-adjusted free cash flow and transaction-adjusted free cash flow conversion are non-GAAP measures and only reflect continuing operations. See page 6 for further discussion, including a definition of significant items. Reconciliation to the most directly comparable GAAP measure, including details of significant items begins on page 13 of this communication.
Second Quarter 2026 Segment Highlights
Healthcare & Water Technologies
Dollars in millions
2Q’26
2Q’25
Change
vs. 2Q’25
Organic Sales(2)
vs. 2Q’25
Net sales
$856
$817
5 %
4 %
Operating EBITDA
$258
$248
4 %
Operating EBITDA margin %
30.1 %
30.4 %
(30) bps
Net sales
Net sales increased 5% on organic sales growth of 4% and a currency benefit of 1%.Healthcare Technologies sales up mid-single digits on an organic basis on broad-based growth led by personal protection and biopharma.Water Technologies sales up low-single digits on an organic basis on continued strength in industrial water and semiconductor markets, partially offset by weakness in the Middle East.
Operating EBITDA
Operating EBITDA increased on organic growth and productivity, partially offset by growth investments.Operating EBITDA margin of 30.1% decreased 30 basis points as organic growth and productivity were more than offset by less favorable mix and growth investments.
Diversified Industrials
Dollars in millions
2Q’26
2Q’25
Change
vs. 2Q’25
Organic Sales(2)
vs. 2Q’25
Net sales
$963
$932
3 %
3 %
Operating EBITDA
$213
$199
7 %
Operating EBITDA margin %
22.1 %
21.4 %
70 bps
Net sales
Net sales increased 3% on organic sales growth in the quarter.Building Technologies sales up low-single digits on an organic basis due to growth in residential and non-residential construction markets.Industrial Technologies sales up mid-single digits on an organic basis on continued strength in aerospace coupled with growth in electric vehicle applications.
Operating EBITDA
Operating EBITDA and margin increased on organic growth, favorable mix and productivity.
2026 Financial Outlook
Dollars in millions, except EPS
2H’26E
Full Year 2026E
Net sales
$3,660 – $3,690
$7,160 – $7,190
Operating EBITDA(2)
$890 – $910
$1,750 – $1,770
Adjusted EPS(2)
$3.65 – $3.80
$7.17 – $7.32
“Our strong execution and market-driven growth continue to translate into higher earnings and free cash flow generation. As a result of our second quarter outperformance, we are again raising the midpoint of our full-year 2026 operating EBITDA guidance to approximately $1.76 billion and adjusted EPS guidance to $7.24 per share, while increasing our expectation for organic sales growth to slightly above 4%,” said Antonella Franzen, DuPont Chief Financial Officer.
“With continued strength across healthcare, industrial water, and aerospace end-markets, we expect mid-single digit organic sales growth in the second half and remain focused on driving profitable growth and value creation for shareholders.” Franzen concluded.
Conference Call
The Company will host a live webcast of its quarterly earnings conference call with investors to discuss its results and business outlook beginning today at 8:00 a.m. ET. The slide presentation that accompanies the conference call will be posted on the DuPont’s Investor Relations Events and Presentations page. A replay of the webcast also will be available on the DuPont’s Investor Relations Events and Presentations page following the live event.
About DuPont
DuPont (NYSE: DD) is a global innovation leader, providing advanced solutions that help transform industries and improve everyday life across our key markets of healthcare, water, construction, and industrial. More information about the company, its businesses and solutions can be found at www.dupont.com. Investors can access information included on the Investor Relations section of the website at investors.dupont.com.
DuPontTM and all products, unless otherwise noted, denoted with TM, SM or ® are trademarks, service marks or registered trademarks of affiliates of DuPont de Nemours, Inc.
Overview
On May 26, 2026, DuPont’s Board of Directors announced a reverse stock split of the Company’s common stock, par value $0.01 per share, at a ratio of 1-for-3, as well as a reduction in the number of authorized shares of its common stock by a corresponding ratio (the “Reverse Stock Split”), as approved by shareholders. The Reverse Stock Split became effective on June 24, 2026. All share and share-related information presented in these interim Consolidated Financial Statements has been retroactively adjusted in all periods presented to reflect the decreased number of shares resulting from the Reverse Stock Split and related impacts.
On April 1, 2026, DuPont completed the sale of the Aramids business (the “Aramids Business” and the divestiture of the Aramids Business, the “Aramids Divestiture”) to Arclin, a portfolio company of an affiliate of TJC LP for pre-tax cash proceeds of approximately $1.2 billion, subject to customary transaction adjustments, a note receivable in the principal amount of $300 million (the “Aramids Note Receivable”) and a non-controlling common equity interest (the “Aramids Equity Consideration”), valued at $325 million, in New Arclin U.S. Holding Corp., which now owns the Arclin global materials business and the Aramids Business. The financial results of the divested Aramids Business are reflected in DuPont’s interim Consolidated Financial Statements as discontinued operations, along with comparative periods.
On November 1, 2025, DuPont completed the separation of its semiconductor and interconnect solutions businesses (the “Electronics Business” and the separation of the Electronics Business, the “Electronics Separation”) into an independent public company, Qnity Electronics, Inc. (“Qnity”), by way of the distribution to DuPont’s stockholders of record as of October 22, 2025 of all the issued and outstanding common stock of Qnity on November 1, 2025 (the “Qnity Distribution”). As a result, the financial results of the divested Electronics Business are reflected in DuPont’s interim Consolidated Financial Statements as discontinued operations for all periods.
Cautionary Statement Regarding Forward-looking Statements
Certain statements in this release may be considered forward-looking statements, within the meaning of the federal securities laws, including Section 27A of the Securities Act of 1933, as amended, and Section 21E of the Securities Exchange Act of 1934, as amended (the “Exchange Act”). Forward-looking statements often contain words such as “expect”, “anticipate”, “intend”, “plan”, “believe”, “seek”, “see”, “will”, “would”, “target”, “outlook”, “stabilization”, “confident”, “preliminary”, “initial”, “continue”, “may”, “could”, “project”, “estimate”, “forecast” and similar expressions and variations or negatives of these words. All statements, other than statements of historical fact, are forward-looking statements. Forward-looking statements address matters that are, to varying degrees, uncertain and subject to risks, uncertainties, and assumptions, many of which are beyond DuPont’s control, that could cause actual results to differ materially from those expressed in any forward-looking statements.
Forward-looking statements are not guarantees of future results. Some of the important factors that could cause DuPont’s actual results to differ materially from those projected in any such forward-looking statements include, but are not limited to (i) the ability to realize the intended benefits of the Electronics Separation and the Qnity Distribution, including achievement of the intended tax treatment, contractual allocation to, and assumption by Qnity of certain liabilities, including certain legacy liabilities with respect to per- and polyfluoroalkyl substances (“PFAS”) and the possibility of disputes, litigation or unanticipated costs in connection with the Electronics Separation and Qnity Distribution; (ii) the impact of the Aramids Divestiture on DuPont’s balance sheet, financial condition and future results of operations; (iii) risks and costs related to the impact of the arrangement to share future eligible PFAS costs by and among DuPont, Corteva, Inc. and The Chemours Company, including the outcome of pending or future litigation related to PFAS or PFOA, which includes personal injury claims and natural resource damages claims; the extent and cost of ongoing and potential future remediation obligations; and changes in laws and regulations applicable to PFAS chemicals; (iv) the failure to realize expected benefits and effectively manage and achieve anticipated synergies and operational efficiencies in connection with the Electronics Separation, the Aramids Divestiture and completed and future, if any, divestitures, mergers, acquisitions, and other portfolio management, productivity and infrastructure actions; (v) risks and uncertainties that are outside the Company’s control but adversely impact the overall environment in which DuPont, its customers and/or its suppliers operate, including changes in economic, political, regulatory, international trade, geopolitical, military conflicts, capital markets and other external conditions, including pandemics and responsive actions, as well as natural and other disasters or weather-related events; (vi) the ability to offset increases in cost of inputs, including raw materials, energy and logistics; (vii) the risks and uncertainties associated with continuing or expanding geopolitical conflicts or trade disputes or restrictions and responsive actions, new or increased tariffs or export controls, including on exports to China of U.S.-regulated products and technology; (viii) other risks to DuPont’s business and operations, including the risk of impairment; (ix) risks and uncertainties in connection with completing the $2 billion share buyback announced on November 6, 2025, including timeline, associated costs and the possibility that the authorization may be suspended or discontinued prior to completion; (x) the ability to realize the intended benefits of the Reverse Stock Split; (xi) the impact of the invalidation of certain tariffs imposed under the International Emergency Economic Powers Act and (xii) other risk factors discussed in DuPont’s most recent annual report on Form 10-K, and subsequent quarterly reports on Form 10-Q and current reports on Form 8-K filed with the U.S. Securities and Exchange Commission.
Unlisted factors may present significant additional obstacles to the realization of forward-looking statements. Consequences of material differences in results as compared with those anticipated in the forward-looking statements could include, among other things, business or supply chain disruption, operational problems, financial loss, legal liability to third parties and similar risks, any of which could have a material adverse effect on DuPont’s consolidated financial condition, results of operations, credit rating or liquidity. Undue reliance should not be placed on forward-looking statements, which speak only as of the date they are made. DuPont assumes no obligation to publicly provide revisions or updates to any forward-looking statements whether as a result of new information, future developments or otherwise, should circumstances change, except as otherwise required by securities and other applicable laws.
Non-GAAP Financial Measures
Unless otherwise indicated, all financial metrics presented reflect continuing operations only.
This communication includes information that does not conform to accounting principles generally accepted in the United States of America (“U.S. GAAP”) and are considered non-GAAP measures. Management uses these measures internally for planning, forecasting and evaluating the performance of the Company, including allocating resources. DuPont’s management believes these non-GAAP financial measures are useful to investors because they provide additional information related to the ongoing performance of DuPont to offer a more meaningful comparison related to future results of operations. These non-GAAP financial measures supplement disclosures prepared in accordance with U.S. GAAP, and should not be viewed as an alternative to U.S. GAAP. Furthermore, such non-GAAP measures may not be consistent with similar measures provided or used by other companies. Reconciliations for these Non-GAAP measures to U.S. GAAP are provided in the Selected Financial Information and Non-GAAP Measures starting on page 12. Non-GAAP measures included in this communication are defined below. The Company has not provided forward-looking U.S. GAAP financial measures or a reconciliation of forward-looking non-GAAP financial measures to the most comparable U.S. GAAP financial measures on a forward-looking basis because the Company is unable to predict with reasonable certainty the ultimate outcome of certain future events. These events include, among others, the impact of portfolio changes, including asset sales, mergers, acquisitions, and divestitures; contingent liabilities related to litigation, environmental and indemnifications matters; impairments and discrete tax items. These items are uncertain, depend on various factors, and could have a material impact on U.S. GAAP results for the guidance period.
Key Terms
Significant Items
Significant items are items that arise outside the ordinary course of business for the Company and includes items for nonconsolidated affiliates, that the Company’s management believes may cause misinterpretation of underlying business and investment performance, both historical and future, based on a combination of some or all of the item’s size, unusual nature and infrequent occurrence. Management classifies as significant items certain costs and expenses associated with integration and separation activities related to transformational acquisitions and divestitures as they are considered unrelated to ongoing business performance. There were no significant items associated with nonconsolidated affiliates recorded for the three and six month periods ended June 30, 2026 and June 30, 2025.
Future Reimbursable Indirect Costs
Indirect costs, such as those related to corporate and shared service functions previously allocated to the separated Electronics Business and Aramids Business, do not meet the criteria for discontinued operations and are reported within continuing operations in all respective periods presented. The Company has, is, will or expects to be reimbursed in accordance with the applicable transition service agreements (“TSAs”) for the portion of indirect costs related to activities the Company is, will or expects to undertake on a transitional basis to support a) Qnity not beyond year end 2027 for services and 2040 for site leases and, b) the Aramids Business post the Aramids Divestiture, but not beyond 2028 (such indirect costs “Future Reimbursable Indirect Costs”). Services provided and costs reimbursed in accordance with the applicable TSAs include but are not limited to, costs associated with information technology services/support, product stewardship and regulatory support, facilities services, and shared property lease costs.
Future Reimbursable Indirect Costs do not meet the criteria for discontinued operations and therefore are included in both GAAP Net Income from Continuing Operations and in GAAP Cash provided by operating activities-continuing operations for all periods presented. Future Reimbursable Indirect Costs are excluded from Adjusted Earnings, Operating EBITDA and Transaction-Adjusted Free Cash Flow, each defined below. Such indirect costs that are not subject to future reimbursement are reported within continuing operations in Corporate and are included within Adjusted Earnings, Operating EBITDA, and Cash provided by operating activities-continuing operations.
Corporate DDOB Remediation Costs
Corporate DDOB Remediation Costs are environmental remediation costs, including certain investigate, remediate and restoration costs, associated with discontinued or divested operations, businesses or product lines (“Corporate DDOB Remediation Costs”). DDOB Remediation Costs are excluded from Adjusted Earnings and Operating EBITDA, as defined below, to provide better insight into the underlying business performance of the Company.
Non-GAAP Measure Definitions
Organic Sales
Organic Sales is defined as net sales excluding the impacts of currency and portfolio.
Adjusted Earnings
Adjusted Earnings is defined as income from continuing operations excluding the after-tax impact of significant items, after-tax impact of amortization expense of intangibles, the after-tax impact of non-operating pension / other post employment benefits (“OPEB”) credits / costs, Future Reimbursable Indirect Costs and Corporate DDOB Remediation Costs.
Adjusted Earnings is the numerator used in the calculation of Adjusted EPS, as well as the denominator in Adjusted Free Cash Flow Conversion.
Adjusted EPS
Adjusted EPS is defined as Adjusted Earnings per common share – diluted. Management estimates amortization expense in 2026 associated with intangibles to be about $275 million on a pre-tax basis, or approximately $1.54 per share.
Operating EBITDA, EBITDA Margin & Incremental Margin
The Company’s measure of profit/loss for segment reporting purposes is Operating EBITDA as this is the manner in which the Company’s chief operating decision maker (“CODM”) assesses performance and allocates resources. The Company defines Operating EBITDA as earnings (i.e., “Income from continuing operations before income taxes”) before interest, depreciation, amortization, non-operating pension / OPEB benefits / charges, and foreign exchange gains / losses, excluding Future Reimbursable Indirect Costs, Corporate DDOB Remediation Costs, and adjusted for significant items. Reconciliations of these measures are provided on the following pages.
Operating EBITDA Margin is defined as Operating EBITDA divided by Net Sales.
Incremental Margin is the change in Operating EBITDA divided by the change in Net Sales for the applicable period.
Adjusted Free Cash Flow & Adjusted Free Cash Flow Conversion
Adjusted Free Cash Flow is defined as cash provided by/used for operating activities from continuing operations less capital expenditures and excluding the impact of cash inflows/outflows that are unusual in nature and/or infrequent in occurrence that neither relate to the ordinary course of the Company’s business nor reflect the Company’s underlying business liquidity. As a result, Adjusted Free Cash Flow represents cash that is available to the Company, after investing in its asset base, to fund obligations using the Company’s primary source of liquidity, cash provided by operating activities from continuing operations. Management believes Adjusted Free Cash Flow, even though it may be defined differently from other companies, is useful to investors, analysts and others to evaluate the Company’s cash flow and financial performance, and it is an integral measure used in the Company’s financial planning process. Management notes that there were no exclusions for items that are unusual in nature and/or infrequent in occurrence for the three and six month periods ended June 30, 2026.
Adjusted Free Cash Flow Conversion is defined as Adjusted Free Cash Flow divided by Adjusted Earnings. Management uses Adjusted Free Cash Flow Conversion as an indicator of our ability to convert earnings to cash.
Transaction Adjusted Free Cash Flow & Transaction Adjusted Free Cash Flow Conversion
Management believes supplemental non-GAAP financial measures including Transaction-Adjusted Free Cash Flow and Transaction-Adjusted Free Cash Flow Conversion (each defined below) provide an integral view of information on the Company’s underlying business performance during this period of transformational change. Management believes the Electronics Separation and Aramids Divestiture collectively represent a significant transformational change for the Company and separation-related transaction cost payments impact comparability to the Company’s continuing operations. Management believes Transaction-Adjusted Free Cash Flow, which may be defined differently from other companies, is useful to investors, analysts and others to evaluate the Company’s cash flow and financial performance, and it is an integral measure used in the Company’s financial planning process. These non-GAAP financial measures are not intended to represent residual cash flow for discretionary expenditures since other non-discretionary expenditures, such as mandatory debt service requirements, are not deducted from the measure.
Transaction-Adjusted Free Cash Flow is defined as cash provided by/used for operating activities from continuing operations less capital expenditures and removing the impact of separation-related transaction costs and other payment and cash inflows/outflows that are unusual in nature and/or infrequent in occurrence that neither relate to the ordinary course of the Company’s business nor reflect the Company’s underlying business liquidity.
Transaction-Adjusted Free Cash Flow Conversion is defined as Transaction-Adjusted Free Cash Flow excluding separation-related transaction costs, divided by Adjusted Earnings.
Separation-related transaction costs and other payments include cash outflows directly associated with the Electronics Separation and the Aramids Divestiture. These costs include advisor and banking fees, payments related to establishing a new capital structure (including fees associated with interest rate swaps), capital expenditures required to facilitate physical asset separation, restructuring payments associated with senior leadership, and Future Reimbursable Indirect Costs, among other expenditures.
Future Reimbursable Indirect Costs are excluded from Adjusted Earnings and Operating EBITDA. To provide comparable data analysis, the Company has also adjusted payments associated with Future Reimbursable Indirect Costs within Separation-related transaction costs and other payments. This adjustment is intended to provide insight into the Company’s underlying business performance. For the six months ended June 30, 2026, the Company adjusted $8 million associated with Future Reimbursable Indirect Costs within Separation-related transaction costs and other payments.
Additionally, $2 and $5 million were reflected in Separation-related transaction costs and other payments for the three and six month periods ended June 30, 2026, respectively, for capital expenditures incurred to complete the physical separation of shared locations.
Finally, $6 million of restructuring and short-term incentive program payments to former senior leadership were reflected in Separation-related transaction costs and other payments for the six month period ended June 30, 2026. These payments were reflected in other cash payments as they related to the establishment of the post-spin leadership structure.
DuPont de Nemours, Inc.
Consolidated Statements of Operations
Three Months Ended
June 30,
Six Months Ended
June 30,
In millions, except per share amounts (Unaudited)
2026
2025
2026
2025
Net sales
$ 1,819
$ 1,749
$ 3,500
$ 3,361
Cost of sales
1,180
1,143
2,259
2,212
Research and development expenses
42
53
89
103
Selling, general and administrative expenses
269
262
524
496
Amortization of intangibles
68
74
136
149
Restructuring and asset related (benefits) charges – net
(3)
—
43
39
Acquisition, integration and separation costs
7
55
7
105
Equity in earnings (loss) of nonconsolidated affiliates
9
9
8
(6)
Sundry income (expense) – net
42
(9)
78
91
Interest expense
41
84
81
167
Income from continuing operations before income taxes
$ 266
$ 78
$ 447
$ 175
Provision for income taxes on continuing operations
75
54
106
71
Income from continuing operations, net of tax
$ 191
$ 24
$ 341
$ 104
(Loss) income from discontinued operations, net of tax
(44)
46
(30)
(615)
Net income (loss)
$ 147
$ 70
$ 311
$ (511)
Net income attributable to noncontrolling interests
4
11
7
19
Net income (loss) available for DuPont common stockholders
$ 143
$ 59
$ 304
$ (530)
Per common share data:
Earnings per common share from continuing operations – basic
$ 1.38
$ 0.17
$ 2.45
$ 0.73
(Loss) earnings per common share from discontinued operations – basic
(0.32)
0.25
(0.22)
(4.53)
Earnings (loss) per common share – basic
$ 1.05
$ 0.42
$ 2.23
$ (3.80)
Earnings per common share from continuing operations – diluted
$ 1.37
$ 0.17
$ 2.43
$ 0.73
(Loss) earnings per common share from discontinued operations – diluted
(0.32)
0.25
(0.22)
(4.52)
Earnings (loss) per common share – diluted
$ 1.05
$ 0.42
$ 2.22
$ (3.79)
Weighted-average common shares outstanding – basic
135.9
139.6
136.3
139.6
Weighted-average common shares outstanding – diluted
136.8
139.9
137.2
139.9
DuPont de Nemours, Inc.
Condensed Consolidated Balance Sheets
In millions, except share amounts (Unaudited)
June 30, 2026
December 31, 2025
Assets
Current Assets
Cash and cash equivalents
$ 1,740
$ 715
Restricted cash and cash equivalents
42
42
Accounts and notes receivable – net
1,751
1,669
Inventories
1,210
1,172
Prepaid and other current assets
113
121
Assets of discontinued operations
—
1,856
Total current assets
$ 4,856
$ 5,575
Property, plant and equipment – net of accumulated depreciation (June 30,
2026 – $3,694; December 31, 2025 – $3,565)
3,379
3,464
Other Assets
Goodwill
7,840
7,915
Other intangible assets
2,789
2,936
Investments and noncurrent receivables
981
432
Deferred income tax assets
221
282
Deferred charges and other assets
995
971
Total other assets
$ 12,826
$ 12,536
Total Assets
$ 21,061
$ 21,575
Liabilities and Equity
Current Liabilities
Short-term borrowings
$ —
$ 60
Accounts payable
978
995
Income taxes payable
53
54
Accrued and other current liabilities
970
882
Liabilities of discontinued operations
—
314
Total current liabilities
$ 2,001
$ 2,305
Long-Term Debt
3,125
3,134
Other Noncurrent Liabilities
Deferred income tax liabilities
295
405
Pension and other post-employment benefits – noncurrent
400
432
Other noncurrent obligations
1,359
1,196
Total other noncurrent liabilities
$ 2,054
$ 2,033
Total Liabilities
$ 7,180
$ 7,472
Commitments and contingent liabilities
Stockholders’ Equity
Common stock (authorized 555,555,556 shares of $0.01 par value each;
issued 2026: 135,038,855 shares; 2025: 136,398,482 shares)
1
1
Additional paid-in capital
$ 38,710
38,721
Accumulated deficit
(24,326)
(24,278)
Accumulated other comprehensive loss
(616)
(525)
Total DuPont stockholders’ equity
$ 13,769
$ 13,919
Noncontrolling interests
112
184
Total equity
$ 13,881
$ 14,103
Total Liabilities and Equity
$ 21,061
$ 21,575
DuPont de Nemours, Inc.
Consolidated Statement of Cash Flows
Six Months Ended June 30,
In millions (Unaudited)
2026
2025
Operating Activities
Net income (loss)
$ 311
$ (511)
Loss from discontinued operations
(30)
(615)
Net income from continuing operations
$ 341
$ 104
Adjustments to reconcile net income to net cash provided by operating activities:
Depreciation and amortization
309
326
Credit for deferred income tax and other tax related items
45
9
(Earnings) losses of nonconsolidated affiliates (in excess of) less than dividends received
(6)
7
Net periodic pension benefit costs
6
2
Periodic benefit plan contributions
(28)
(23)
Restructuring and asset related charges – net
43
39
Interest rate swap gain
—
(51)
Stock based compensation
27
22
Donatelle contingent earn-out true-up
(14)
(12)
Other net (income) loss
(2)
16
Changes in assets and liabilities, net of effects of acquired and divested companies:
Accounts and notes receivable
(88)
(213)
Inventories
(29)
(51)
Accounts payable
92
(19)
Other assets and liabilities, net
(64)
(5)
Cash provided by operating activities – continuing operations
$ 632
$ 151
Investing Activities
Capital expenditures
(178)
(172)
Proceeds and adjustments to proceeds from sales of businesses, net of cash divested
1,158
—
Other investing activities, net
9
7
Cash provided by (used for) investing activities – continuing operations
$ 989
$ (165)
Financing Activities
Changes in short-term borrowings
(60)
—
Purchases of common stock and forward contracts
(275)
—
Proceeds from issuance of Company stock
107
4
Employee taxes paid for share-based payment arrangements
(22)
(22)
Distributions to noncontrolling interests
(11)
(5)
Dividends paid to stockholders
(163)
(343)
Other financing activities, net
(1)
(7)
Cash used for financing activities – continuing operations
$ (425)
$ (373)
Cash Flows from Discontinued Operations
Cash (used for) provided by operations – discontinued operations
(158)
540
Cash used for investing activities – discontinued operations
(6)
(193)
Cash used for financing activities – discontinued operations
(3)
(17)
Cash (used for) provided by discontinued operations
$ (167)
$ 330
Effect of exchange rate changes on cash, cash equivalents and restricted cash
(7)
44
Increase (decrease) in cash, cash equivalents and restricted cash
$ 1,022
$ (13)
Cash, cash equivalents and restricted cash from continuing operations, beginning of period
757
1,834
Cash, cash equivalents and restricted cash from discontinued operations, beginning of period
3
58
Cash, cash equivalents and restricted cash at beginning of period
$ 760
$ 1,892
Cash, cash equivalents and restricted cash from continuing operations, end of period
1,782
1,817
Cash, cash equivalents and restricted cash from discontinued operations, end of period
—
62
Cash, cash equivalents and restricted cash at end of period
$ 1,782
$ 1,879
DuPont de Nemours, Inc.
Select Segment Information and Non-GAAP Measures
Net Sales by Segment
Three Months Ended
Six Months Ended
In millions (Unaudited)
Jun 30, 2026
Jun 30, 2025
Jun 30, 2026
Jun 30, 2025
Healthcare & Water Technologies
$ 856
$ 817
$ 1,662
$ 1,580
Diversified Industrials
963
932
1,838
1,781
Total
$ 1,819
$ 1,749
$ 3,500
$ 3,361
Net Sales Variance by Segment
Three Months Ended June 30, 2026
Organic Sales
Currency
Portfolio / Other
Total
Percent change from prior year (Unaudited)
Healthcare & Water Technologies
4 %
1 %
— %
5 %
Diversified Industrials
3
—
—
3
Total
4 %
— %
— %
4 %
Net Sales Variance by Segment
Six Months Ended June 30, 2026
Organic Sales
Currency
Portfolio / Other
Total
Percent change from prior year (Unaudited)
Healthcare & Water Technologies
3 %
2 %
— %
5 %
Diversified Industrials
2
1
—
3
Total
3 %
1 %
— %
4 %
Operating EBITDA by Segment
Three Months Ended
Six Months Ended
In millions (Unaudited)
Jun 30, 2026
Jun 30, 2025
Jun 30, 2026
Jun 30, 2025
Healthcare & Water Technologies
$ 258
$ 248
$ 502
$ 471
Diversified Industrials
213
199
413
384
Corporate 1
(23)
(24)
(53)
(72)
Total
$ 448
$ 423
$ 862
$ 783
1.
Corporate includes expenses of the Corporate function not allocated to specific business in the Company.
Equity in Earnings (Loss) of Nonconsolidated Affiliates by Segment
Three Months Ended
Six Months Ended
In millions (Unaudited)
Jun 30, 2026
Jun 30, 2025
Jun 30, 2026
Jun 30, 2025
Healthcare & Water Technologies
$ 1
$ —
$ 2
$ —
Diversified Industrials
—
—
(1)
—
Corporate 1
8
9
7
(6)
Total equity earnings (loss) included in operating EBITDA (GAAP)
$ 9
$ 9
$ 8
$ (6)
1.
Corporate includes the equity interest acquired in the Delrin® Divestiture transaction.
DuPont de Nemours, Inc.
Selected Financial Information and Non-GAAP Measures
Reconciliation of “Income from continuing operations, net of tax” to
“Operating EBITDA”
Three Months Ended
Six Months Ended
In millions (Unaudited)
Jun 30, 2026
Jun 30, 2025
Jun 30, 2026
Jun 30, 2025
Income from continuing operations, net of tax (GAAP)
$ 191
$ 24
$ 341
$ 104
+ Provision for income taxes on continuing operations
75
54
106
71
Income from continuing operations before income taxes
$ 266
$ 78
$ 447
$ 175
+ Depreciation and amortization
154
166
309
326
– Interest income 1, 2
24
18
34
35
+ Interest expense 3
41
84
81
166
– Non-operating pension/OPEB benefit (costs) credits 1
(1)
—
(1)
2
– Foreign exchange gains (losses), net 1
4
(14)
14
(17)
+ Future Reimbursable Indirect Costs
—
25
8
50
+ Corporate DDOB Remediation Costs
6
2
10
5
– Significant items charge
(8)
(72)
(54)
(81)
Operating EBITDA (non-GAAP)
$ 448
$ 423
$ 862
$ 783
1.
Included in “Sundry income (expense) – net”.
2.
The three and six months ended June 30, 2026 and 2025 excludes accrued interest income earned on employee retention credits. Refer to details of significant items on page 14.
3.
The six months ended June 30, 2025 excludes interest rate swap basis amortization. Refer to details of significant items on page 14.
Reconciliation of “Cash provided by operating activities – continuing
operations” to Adjusted Free Cash Flow 1 , Transaction-Adjusted Free
Cash Flow1 and calculation of “Adjusted Free Cash Flow Conversion”
and “Transaction-Adjusted Free Cash Flow Conversion”
Three Months Ended
Six Months Ended
In millions (Unaudited)
Jun 30, 2026
Jun 30, 2025
Jun 30, 2026
Jun 30, 2025
Cash provided by operating activities (GAAP) 2 – continuing operations
$ 400
$ 74
$ 632
$ 151
Capital expenditures
(76)
(50)
(178)
(172)
Adjusted free cash flow (non-GAAP)
$ 324
$ 24
$ 454
$ (21)
Separation-related transaction cost and other payments3
2
83
19
136
Transaction-adjusted free cash flow (non-GAAP)
$ 326
$ 107
$ 473
$ 115
Adjusted earnings (non-GAAP) 4
$ 257
$ 177
$ 483
$ 331
Adjusted free cash flow conversion (non-GAAP)
126 %
14 %
94 %
(6) %
Transaction-adjusted free cash flow conversion (non-GAAP)
127 %
60 %
98 %
35 %
1
Adjusted Free Cash Flow and Transaction-Adjusted Free Cash Flow are calculated on a continuing operations basis for all periods presented. Refer to the definitions of Non-GAAP metrics on pages 7-8 for additional information.
2
Refer to the Consolidated Statement of Cash Flows included in the schedules above for major GAAP cash flow categories as well as further detail relating to the changes in “Cash provided by operating activities – continuing operations” for the six month periods noted.
3
Other payments for the three months ended June 30, 2026 includes $2 million related of separation-related capital expenditures. Other payments for the six months ended June 30, 2026 includes $5 million of separation-related capital expenditures, $6 million related to restructuring and short-term incentive program payments associated with former senior leadership, and $8 million for Future Reimbursable Indirect Costs (as defined in our Non-GAAP definitions).
4
Refer to page 14 for the Non-GAAP reconciliations of Net income from continuing operations available for DuPont common stockholders to Adjusted Earnings (Non-GAAP).
DuPont de Nemours, Inc.
Selected Financial Information and Non-GAAP Measures
Significant Items Impacting Results for the Three Months Ended June 30, 2026
In millions, except per share amounts (Unaudited)
Pretax 1
Net
Income 2
EPS 3
Income Statement Classification
Reported earnings (GAAP)
$ 266
$ 187
$ 1.37
Less: Significant items
Acquisition, integration & separation costs
(7)
(5)
(0.04)
Acquisition, integration and separation costs
Restructuring and asset related benefits – net
3
—
—
Restructuring and asset related charges – net
Other benefits (credits), net 4
(4)
(3)
(0.02)
Sundry income (expense) – net; Selling, general and administrative expenses
Income tax items 5
—
(3)
(0.02)
Provision for income taxes on continuing operations
Total significant items
$ (8)
$ (11)
$ (0.08)
Less: Amortization of intangibles
(68)
(53)
(0.39)
Amortization of intangibles
Less: Non-op pension / OPEB benefit costs
(1)
(1)
(0.01)
Sundry income (expense) – net
Less: Corporate DDOB remediation costs
(6)
(5)
(0.03)
Selling, general and administrative expenses
Adjusted earnings (non-GAAP)
$ 349
$ 257
$ 1.88
Significant Items Impacting Results for the Three Months Ended June 30, 2025
In millions, except per share amounts (Unaudited)
Pretax 1
Net
Income 2
EPS 3
Income Statement Classification
Reported earnings (GAAP)
$ 78
$ 24
$ 0.17
Less: Significant items
Acquisition, integration and separation costs
(55)
(46)
(0.32)
Acquisition, integration and separation costs
Restructuring and asset related benefits – net
—
1
—
Restructuring and asset related charges – net
Interest rate swap mark-to-market loss 6
(27)
(21)
(0.15)
Sundry income (expense) – net
Other benefits (credits), net 7
10
8
0.06
Sundry income (expense) – net
Income tax items 8
—
(18)
(0.13)
Provision for income taxes on continuing operations
Total significant items
$ (72)
$ (76)
$ (0.54)
Less: Amortization of intangibles
(74)
(58)
(0.42)
Amortization of intangibles
Less: Non-op pension / OPEB benefit credits
—
—
—
Sundry income (expense) – net
Less: Future reimbursable indirect costs
(25)
(19)
(0.14)
Selling, general and administrative expenses
Less: Corporate DDOB remediation costs
(2)
—
—
Selling, general and administrative expenses
Adjusted earnings (non-GAAP)
$ 251
$ 177
$ 1.27
1.
Income (loss) from continuing operations before income taxes.
2.
Net income (loss) from continuing operations available for DuPont common stockholders. The income tax effect on significant items was calculated based upon the enacted tax laws and statutory income tax rates applicable in the tax jurisdiction(s) of the underlying non-GAAP adjustment.
3.
Earnings (loss) per common share from continuing operations – diluted.
4.
Includes benefits related to an adjustment of the Donatelle contingent earn-out liability ($8 million pre-tax benefit) and legal costs within the Healthcare & Water Technologies segment associated with a pending intellectual property matter ($7 million pre-tax cost), and legal costs associated with personal injury cases associated with Corian® Quartz, a product within the Diversified Industrials segment ($8 million pre-tax cost).
5.
Reflects the net impact of a valuation allowance release in Europe and a deferred tax asset reversal in the U.S.
6.
The three months ended June 30, 2025 includes non-cash mark-to-market loss related to the 2022 Swaps and 2024 Swaps and the interest settlement loss on the 2022 Swaps.
7.
Reflects the accrued interest earned on employee retention credits ($3 million pre-tax benefit), benefits related to an adjustment of the Donatelle contingent earn-out liability ($12 million pre-tax benefit) and legal costs within the Healthcare & Water Technologies segment associated with a pending intellectual property matter ($5 million pre-tax cost).
8.
Reflects the income tax impact of certain internal restructurings related to the Electronics Separation.
DuPont de Nemours, Inc.
Selected Financial Information and Non-GAAP Measures
Significant Items Impacting Results for the Six Months Ended June 30, 2026
In millions, except per share amounts (Unaudited)
Pretax 1
Net
Income 2
EPS 3
Income Statement Classification
Reported earnings (GAAP)
$ 447
$ 334
$ 2.43
Less: Significant items
Acquisition, integration & separation costs
(7)
(5)
(0.04)
Acquisition, integration and separation costs
Restructuring and asset related charges – net
(43)
(36)
(0.26)
Restructuring and asset related charges – net
Other benefits (credits), net 4
(4)
(3)
(0.02)
Sundry income (expense) – net; Selling, general and administrative expenses
Income tax items 5
—
15
0.11
Provision for income taxes on continuing operations
Total significant items
$ (54)
$ (29)
$ (0.21)
Less: Amortization of intangibles
(136)
(105)
(0.77)
Amortization of intangibles
Less: Non-op pension / OPEB benefit costs
(1)
(1)
(0.01)
Sundry income (expense) – net
Less: Future reimbursable indirect costs
(8)
(6)
(0.04)
Selling, general and administrative expenses
Less: Corporate DDOB remediation costs
(10)
(8)
(0.06)
Selling, general and administrative expenses
Adjusted earnings (non-GAAP)
$ 656
$ 483
$ 3.52
Significant Items Impacting Results for the Six Months Ended June 30, 2025
In millions, except per share amounts (Unaudited)
Pretax 1
Net
Income 2
EPS 3
Income Statement Classification
Reported earnings (GAAP)
$ 175
$ 102
$ 0.73
Less: Significant items
Acquisition, integration and separation costs
(105)
(89)
(0.63)
Acquisition, integration and separation costs
Restructuring and asset related charges – net
(39)
(32)
(0.23)
Restructuring and asset related charges – net
Interest rate swap mark-to-market loss 6
50
39
0.28
Sundry income (expense) – net; Interest expense
Other benefits (credits), net 7
13
11
0.08
Sundry income (expense) – net
Income tax items 8
—
(2)
(0.02)
Provision for income taxes on continuing operations
Total significant items
$ (81)
$ (73)
$ (0.52)
Less: Amortization of intangibles
(149)
(117)
(0.84)
Amortization of intangibles
Less: Non-op pension / OPEB benefit credits
2
2
0.01
Sundry income (expense) – net
Less: Future reimbursable indirect costs
(50)
(39)
(0.28)
Selling, general and administrative expenses
Less: Corporate DDOB remediation costs
(5)
(2)
(0.01)
Selling, general and administrative expenses
Adjusted earnings (non-GAAP)
$ 458
$ 331
$ 2.37
1.
Income (loss) from continuing operations before income taxes.
2.
Net income (loss) from continuing operations available for DuPont common stockholders. The income tax effect on significant items was calculated based upon the enacted tax laws and statutory income tax rates applicable in the tax jurisdiction(s) of the underlying non-GAAP adjustment.
3.
Earnings (loss) per common share from continuing operations – diluted.
4.
Reflects the accrued interest earned on employee retention credits ($3 million pre-tax benefit), benefits related to an adjustment of the Donatelle contingent earn-out liability ($14 million pre-tax benefit), legal costs within the Healthcare & Water Technologies segment associated with a pending intellectual property matter ($10 million pre-tax cost), and legal costs associated with personal injury cases associated with Corian® Quartz, a product within the Diversified Industrials segment ($11 million pre-tax cost).
5.
Reflects the 2026 income tax benefit primarily the result of a discrete tax benefit relating to a change in tax classification of a non-U.S. legal entity ($20 million pre-tax benefit).
6.
The six months ended June 30, 2025 includes non-cash mark-to-market gain related to the 2022 Swaps and 2024 Swaps and the interest settlement loss on the 2022 Swaps. The six months ended June 30, 2025 also includes basis amortization on the 2022 Swaps ($1 million pre-tax, reflected in “Interest expense” within the Consolidated Statements of Operations).
7.
Reflects the accrued interest earned on employee retention credits ($6 million pre-tax benefit), benefits related to an adjustment of the Donatelle contingent earn-out liability ($12 million pre-tax benefit), legal costs within the Healthcare & Water Technologies segment associated with a pending intellectual property matter ($5 million pre-tax cost).
8.
Reflects the income tax impact of certain internal restructurings related to the Electronics Separation.
View original content to download multimedia:https://www.prnewswire.com/news-releases/dupont-reports-second-quarter-2026-results-302841628.html
SOURCE DuPont

You may like
Technology
MetaOptics Secures up to US$10 Million Investment Facility from White Lion Capital, Its First U.S. Institutional Investor, to Onshore Metalens Technology into the U.S.
Published
42 minutes agoon
September 21, 2026By

SINGAPORE, Sept. 20, 2026 /PRNewswire/ — MetaOptics Ltd (Catalist: 9MT) (“MetaOptics” or the “Company”, and together with its subsidiaries, the “Group”), a leading-edge semiconductor optics company pioneering metalens technology, today announced that it has secured an investment facility of up to US$10 million from White Lion Capital LLC (“White Lion”), pursuant to a warrant deed entered into with White Lion, under which the Company may, upon exercise of the warrants by the holder at its discretion, raise up to US$10 million through the issuance of up to 40,000,000 new ordinary shares of the Company. White Lion, based in Los Angeles, California, is the first institutional investor in the United States (“U.S.”) to participate in and invest in MetaOptics’ growth story, a strong validation of MetaOptics’ technology, solutions and commercialisation roadmap.
The investment comes one year after MetaOptics’ listing on the Catalist board of the Singapore Exchange. It follows a period of strong commercial momentum, with design and evaluation requests from world-class customers and sampling units shipped. White Lion’s participation extends the Company’s investor base beyond Asia into the U.S., its largest end market.
The proceeds of up to US$10 million, upon exercise of the warrants, will accelerate MetaOptics’ expansion in the U.S.. White Lion’s investment will not just support ongoing projects with U.S. customers across consumer devices, co-packaged optics (“CPO”) and optical interconnects, but more importantly, fund the establishment of the Group’s maiden front-end semiconductor fabrication line with 12-inch DUV immersion photolithography equipment in the U.S., for the mass production of metalenses and module. The establishment of the Group’s maiden front-end semiconductor fabrication line will not only onshore key metalens design, manufacturing and testing into the U.S., bringing such capabilities closer to U.S. customers, but also provide a shorter and clearer roadmap to securing purchase orders for the mass production of metalenses and modules.
The U.S. is a key market for metalens adoption, driven by consumer electronics, AR/VR wearables, automotive sensing and the multi-billion dollar CPO industry serving AI data centres. MetaOptics is currently working with several U.S. foundries to integrate its metalenses into their CPO designs. The smallest CPO metalens designed by MetaOptics measures 0.1 mm. The design can be scaled to a 12-inch semiconductor photolithography process on glass substrates, which is key to mass production.
“Securing our first U.S. institutional investor is an important step for MetaOptics,” said Mr Thng Chong Kim, Executive Chairman of MetaOptics. “Many of our most important customers are in the U.S., from consumer device brands to the companies building CPO and optical interconnects for AI data centres. This funding allows us to move faster on their projects and to onshore key metalens technology into the U.S..”
“MetaOptics is one of the few companies in the world that can design, mass-produce and test glass-based metalenses at scale,” said Gabriel Gumbiner, Senior Associate of White Lion. “We are particularly pleased that our first investment in an SGX-listed company is with an organization of MetaOptics’ caliber. The company has a strong management team with a clear vision for its growth, and we are proud to support MetaOptics as it expands its presence in the U.S. market.”
This press release is to be read in conjunction with MetaOptics’ announcement on White Lion’s investment facility of up to US$10 million, pursuant to a warrant deed entered into with White Lion, released via SGXNet on 21 September 2026. The Company will make further announcement(s) as and when appropriate.
About MetaOptics Ltd
MetaOptics Ltd (Catalist: 9MT) is a vertically integrated designer and manufacturer of metalens-based optical components and products, headquartered in Singapore. Founded in 2021, the Company uses semiconductor processes to pioneer glass-based colour metalenses and produce them at scale on both 4-inch and 12-inch platforms. Its portfolio spans metalenses, metalens camera modules, metalens manufacturing equipment and metalens IoT products, which customers integrate into applications including smartphones, contactless 3D biometrics, AR/VR devices, pico projectors, LiDAR and automotive sensing. MetaOptics aims to deliver high-performance optics with the reliability and scalability demanded by today’s most innovative technology brands. Find out more at www.metaoptics.sg.
About White Lion Capital
White Lion Capital LLC is a US-based private investment firm headquartered in Los Angeles, California. The firm provides growth capital to public companies seeking to become leaders in emerging technology sectors.
Forward-Looking Statements
This press release may contain forward-looking statements that involve known and unknown risks, uncertainties and other factors, many of which are beyond the Company’s control. A number of factors could cause actual results to differ materially from those contained in any forward-looking statement, including but not limited to the Company’s growth strategies, its future business development, results of operations and financial condition, its research and development efforts, its ability to attract and retain customers, and its ability to establish and maintain relationships with suppliers and business partners; and assumptions underlying or related to any of the foregoing. All information provided in this press release is as of the date of this press release, and the Company undertakes no obligation to update any forward-looking statement, except as required under applicable law.
Singapore (Headquarters)
MetaOptics Technologies Pte Ltd, 81 Ayer Rajah Crescent, #01-45, Singapore 139967
United States
MetaOptics Inc. (USA), 1 Ferry Building, Suite 201, San Francisco, CA 94111
SOURCE MetaOptics Ltd
Technology
FUJIFILM Business Innovation Singapore recognised for circular economy and waste management practices
Published
42 minutes agoon
September 21, 2026By

Company recovered more than 500,000 kg of used products annually from the Singapore market over the past two years
SINGAPORE, Sept. 21, 2026 /PRNewswire/ — FUJIFILM Business Innovation Singapore has received the Circular Economy Award – Singapore and Waste Management Award – Singapore at the ESGBusiness Awards 2026. Recognising organisations across Asia for their commitment and achievements in environmental, social and governance practices, the awards acknowledge the company’s efforts in product recovery, parts reuse, remanufacturing and material recycling.
Central to these efforts is an integrated approach spanning the full product lifecycle, from designing devices for easier repair and disassembly to collecting used equipment and recovering serviceable parts and materials. Selected products are also remanufactured in Japan to meet the required quality standards before returning to market. Together, these initiatives are intended to keep products and materials in use for longer and reduce the amount of waste sent for recycling or disposal. This product stewardship approach is also applied across the Asia-Pacific markets where FUJIFILM Business Innovation has direct operations.
Giving devices and materials a second life
Putting this lifecycle approach into practice starts at the design stage. Fujifilm’s multifunction devices feature compact, lightweight designs intended to reduce material use and transportation requirements across the value chain. They are also designed for disassembly to facilitate repair, parts recovery and material recycling.
At the end of commercial use, collected products are assessed for possible reuse before recycling. Over the past two years, FUJIFILM Business Innovation Singapore has consistently recovered more than 500,000 kg of used products annually from the Singapore market. Devices that are unsuitable for refurbishment are disassembled so that serviceable components can be recovered, repaired and reused where appropriate. Between 2024 and 2025, about 110,000 kg of parts were collected for reuse, extending the use of recovered resources and reducing the need for newly sourced materials.
Remaining equipment and toner cartridges are processed by licensed local e-waste recyclers. Through its recycling partner, more than 90 per cent of the material by weight is sorted for material recycling. This work builds on the company’s long-standing take-back programme, which was introduced before extended producer responsibility for electronic waste came into effect under the Resource Sustainability Act 2019.
Advancing circularity through remanufacturing
Beyond parts recovery and recycling, remanufacturing provides another pathway for extending product life. Selected used multifunction devices collected across the Asia-Pacific region undergo remanufacturing in Fujifilm’s factory in Japan. Each remanufactured unit undergoes quality assurance processes equivalent to those applied to newly manufactured products before returning to market. Lifecycle assessments of the relevant models indicate lower CO2 emissions than comparable newly manufactured devices. Applicable models are also certified under the Singapore Green Labelling Scheme.
Supporting customers’ environmental commitments
Alongside these product lifecycle initiatives, Fujifilm’s Managed Print Services offering helps customers better understand print usage across their workplaces. These insights can support more efficient use of paper, toner and energy, helping organisations identify opportunities to reduce resource consumption and waste. The delivery of these initiatives is supported by a certified environmental management system and a Certificate of Environmental Commitment from the Singapore Environment Council.
Tee Hsien Wee, Chief Executive Officer of FUJIFILM Business Innovation Singapore, said: “For local businesses, circularity is becoming an increasingly relevant consideration in how resources and technology are managed. These awards recognise the steps we have taken to apply circular principles across our operations. We will continue to review and strengthen these practices, while working with customers and partners to support more responsible resource use in Singapore.”
– Ends –
About FUJIFILM Business Innovation Singapore
As a pioneer in document solutions for over 60 years, FUJIFILM Business Innovation Singapore has a deep understanding of how businesses operate. Its mission is to empower organisations to work efficiently and effectively in the digital age. As a one-stop provider, it offers a comprehensive suite of digital transformation solutions and services, along with multifunction and production printers, partnering with customers to manage data, automate workflows, leverage data intelligence, and build exceptional customer experiences. The Group’s purpose, “Giving our world more smiles,” underscores its commitment to bringing together diverse ideas, unique capabilities, and extraordinary people to create a positive impact on society. For more information, visit https://www.fujifilm.com/fbsg/en.
View original content to download multimedia:https://www.prnewswire.com/apac/news-releases/fujifilm-business-innovation-singapore-recognised-for-circular-economy-and-waste-management-practices-302883004.html
SOURCE FUJIFILM Business Innovation Singapore
Technology
NYP launches Lumina to help students Go Beyond what they thought possible
Published
42 minutes agoon
September 21, 2026By

New talent development programme combines governance, public policy, futures thinking, ethics through theatre, mentorship and global learning to develop future leaders for a complex world
SINGAPORE, Sept. 21, 2026 /PRNewswire/ — What does public policy have to do with engineering? Why should a designer understand how leadership decisions affect communities? These are among the questions behind Lumina, Nanyang Polytechnic’s (NYP) new flagship talent development programme. At its heart is a simple belief: every student possesses untapped potential. With the right environment, opportunities and support, young people can develop strengths and capabilities they may never have realised they had, and go beyond their pre-conceived boundaries.
Mr Russell Chan, Principal & Chief Executive Officer of NYP, shares the rationale behind the launch of Lumina: “Lumina is designed to help students grow beyond what they thought possible. Leadership is not developed in isolation. It is developed through experience, through service, and through engaging with real people and real communities. Whether through immersive experiences or overseas learning journeys, students will look at issues from different perspectives, think critically about the challenges facing society, and develop the confidence to navigate an increasingly complex world.”
Lumina joins a slew of offerings that undergird the poly’s institution-wide approach to support a young person’s growth: Beyond academic learning, a student can take advantage of workshops and experiential learning opportunities to develop life and leadership skills through programmes under the Student Life Academy. Students seeking a more personalised learning pathway can tap on customised study programmes and mentorship tailored to their aspirations and circumstances, giving them greater flexibility to progress at a pace that best supports their goals.
Earlier this year, NYP also introduced Go Beyond, which allows students the opportunity to customise how they want to complete their diplomas – whether through the university pathway taking university modules or preparation courses, gaining international exposure through overseas study and internships, or a professional pathway to deepen expertise through industry-focused experiences.
While developing professional and technical expertise remains a core focus of polytechnic education, Lumina aims to nurture students who are thoughtful, responsible and capable of leading positive change, and challenge them to stretch themselves in ways they may not have imagined and discover how much further they can grow.
Students will progress to experiences that broadens their perspective beyond their disciplines, exploring areas like service design, and go for university-level short courses in public policy, government and future-thinking. The key milestone of the programme will challenge students to examine ethical dilemmas through a forum theatre format – encouraging different viewpoints, question assumptions and consider key leadership decisions using the arts.
The programme also pairs them up with mentors from the private and public sectors. A few will also get to experience two trips – one to a developed economy and one to a developing and fast burgeoning Asian city with dynamic growth possibilities.
Lumina was launched on 19 Sep at the NYP X Kampong Glam Community Day, where about 200 students – working with the Alliance for Sustainability Innovation, Central Singapore Community Development Council and grassroots partners – supported Project Rejuven-Aid to improve living environments for the elderly and less privileged, while engaging directly with people and communities.
The launch setting reflects an important part of Lumina’s design. Students will not study leadership, governance or societal issues only in the abstract. Community projects are built into the programme so that they can encounter different realities, work with others and apply what they learn to needs beyond themselves.
As Singapore navigates increasingly complex economic, social and environmental challenges, Lumina reflects NYP’s aspiration to develop graduates who are not only ready for the future of work, but also ready to contribute to the future of society.
About Nanyang Polytechnic
Established as an institution of higher learning in 1992, Nanyang Polytechnic’s (NYP) academic schools offer quality education and training through 39 full-time diploma courses and common entry programmes. NYP also has a full suite of Continuing Education and Training (CET) options for lifelong learning, ranging from specialist and advanced diplomas to SkillsFuture-supported modules and courses. NYP’s Asian Culinary Institute Singapore and the Singapore Institute of Retail Studies are CET institutes set up in partnership with SkillsFuture Singapore (SSG) to champion and transform Singapore’s F&B and retail sectors, respectively. A third NYP CET institute – the National Centre of Excellence for Workplace Learning – also set up in collaboration with SSG, will spearhead the development of progressive workplace learning strategies and programmes for companies here.
For more information, please visit www.nyp.edu.sg.
View original content to download multimedia:https://www.prnewswire.com/apac/news-releases/nyp-launches-lumina-to-help-students-go-beyond-what-they-thought-possible-302884137.html
SOURCE Nanyang Polytechnic

MetaOptics Secures up to US$10 Million Investment Facility from White Lion Capital, Its First U.S. Institutional Investor, to Onshore Metalens Technology into the U.S.

FUJIFILM Business Innovation Singapore recognised for circular economy and waste management practices

NYP launches Lumina to help students Go Beyond what they thought possible

Send Rakhi to UK swiftly with UK Gifts Portal

Whiteboard Series with NEAR | Ep: 45 Joel Thorstensson from ceramic.network

New Gooseneck Omni Antennas Offer Enhanced Signals in a Durable Package

Why You Should Build on #NEAR – Co-founder Illia Polosukhin at CV Labs
Whiteboard Series with NEAR | Ep: 45 Joel Thorstensson from ceramic.network

NEAR End of Year Town Hall 2021: The Open Web World, MetaBUILD 2 Hackathon and 2021 recap
Trending
-

 Technology4 days ago
Aristotle Secures $5M to Replace the Chatbot with High-Dosage AI Tutoring for Students
-

 Technology4 days ago
Blockboard Named Finalist in Two Categories at the 2026 Digiday Technology Awards
-

 Technology3 days ago
dtcpay Welcomes SBI Group as Strategic Investor, Extending Series A to US$25M
-

 Technology2 days ago
4Humanity Introduces the National Positivity Portal, Using AI to Make the Good Happening Across America Easier to See
-
Technology2 days ago
Saturday, September 19, 2026
-
 Technology3 days ago
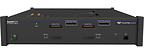
Teledyne LeCroy Announces PCI Express® 7.0 Protocol Exerciser
-

 Coin Market4 days ago
SEC grants temporary exemption for tokenized US stock trading
-

 Coin Market4 days ago
Bitcoin treasury firms can outperform BTC… but is the risk worth taking?