
Technology
Galaxy Announces Second Quarter 2026 Financial Results

Published
2 months agoon
By
NEW YORK, Aug. 5, 2026 /PRNewswire/ — Galaxy Digital Inc. (Nasdaq: GLXY) (the “Company” or “GDI”) today released financial results for the three and six months ended June 30, 2026. In this press release, a reference to “Galaxy,” “we,” “our” and similar words refers to GDI, its subsidiaries and affiliates, and, prior to the Reorganization Transactions, refers to Galaxy Digital Holdings LP (the “Partnership” or “GDH LP”), its subsidiaries and affiliates, or any one of them, as the context requires.1
— Financial Highlights
Q2 2026 net loss of $(85) million and diluted and adjusted EPS of $(0.09), driven primarily by the depreciation of digital asset prices in the quarter.2Q2 2026 adjusted gross profit of $43 million and adjusted EBITDA of $(77) million.2 Total equity of $2.7 billion and cash and stablecoin holdings of $2.5 billion as of June 30, 2026.
— Corporate Updates
Subsequent to quarter-end, Galaxy substantially expanded its data center footprint with the acquisition of three new sites in Texas for the development of AI data centers, bringing its total power pipeline to over 5.7 GW.Galaxy executed a development agreement to acquire 500 acres in the McGregor Industrial Park for its Merlin campus, securing an initial agreement to support 74 MW of capacity, with the potential to expand to up to 500 MW.Galaxy acquired two additional sites for development in Texas, Caspian and Selene, with potential power capacities of approximately 700 MW and 900 MW, respectively, subject to ERCOT’s interconnection process.Galaxy completed delivery of the first phase of power at its Helios data center campus in West Texas, delivering 200 MW of gross power — 133 MW of critical IT load — to CoreWeave under the Company’s 15-year lease agreement. Phase I was delivered on schedule, with rent commencement under the Phase I lease scaling with delivered capacity throughout the second quarter of 2026. On July 28, Galaxy, through its wholly-owned subsidiary Galaxy Helios Data Centers II LLC, completed a private offering of $3.5 billion of senior secured notes due 2031. Proceeds from the offering will be used to fund construction of Helios I, Phase II.Galaxy entered a multi-year agreement with BNY, which oversees more than $60 trillion in assets under custody, to further advance its digital asset infrastructure, including support for staking on BNY’s Digital Asset Custody platform. Galaxy is also serving as a design partner to support the continued development of BNY’s digital asset platform infrastructure.
SELECT FINANCIAL METRICS
Q2 2026
Q1 2026
Q/Q % Change
Total Assets
$10,844M
$9,992M
9 %
Total Equity
$2,720M
$2,779M
(2) %
Cash & Stablecoins3
$2,459M
$2,605M
(6) %
Net Digital Assets and Investments4
$1,160M
$1,362M
(15) %
Net Income / (Loss)
($85M)
($216M)
N.M.
Adjusted EBITDA2
($77M)
($188M)
N.M.
Note: Throughout this document, totals may not sum due to rounding. Percentage change calculations are based on unrounded results. N.M. is the abbreviation for “Not Meaningful”.
(1) On May 13, 2025, the Company, Galaxy Digital Holdings Ltd. and GDH LP consummated a series of transactions resulting in the reorganization of the Company’s corporate structure (the “Reorganization Transactions”).
(2) Adjusted EPS, Adjusted Gross Profit and Adjusted EBITDA are non-GAAP financial measures. Refer to pages 12 through 14 for more information and a non-GAAP to GAAP reconciliation to the most directly comparable GAAP measure.
(3) Includes $896M in Cash and Cash Equivalents and $1,563M in Stablecoins as of the end of Q2 2026 and $911M in Cash and Cash Equivalents and $1,694M in Stablecoins as of the end of Q1 2026.
(4) Refer to page 7 of this release for a breakout of Galaxy’s Treasury & Corporate net digital asset and investment exposure.
— Galaxy Financial Snapshot
Galaxy reported a net loss of $(85) million for Q2 2026 and diluted and adjusted EPS of $(0.09), driven primarily by the depreciation of digital asset prices during the period.1Digital Assets and Data Centers operating businesses generated $86 million of adjusted gross profit and $1 million of adjusted EBITDA, up $34 million and $21 million QoQ, respectively.1Digital Assets generated adjusted gross profit of $66 million and adjusted EBITDA of $(11) million. Despite the pullback in digital asset prices and activity during the quarter, adjusted gross profit increased by 34% QoQ, reflecting the resilience of our business model and further demonstrating that our earnings are becoming less dependent on the direction of digital asset prices.1Data Centers generated adjusted gross profit of $20 million and adjusted EBITDA of $11 million during the quarter, as capacity delivery to CoreWeave ramped throughout the period, with all 133 MW of critical IT load under the Phase I lease in service by quarter end. With the full 133 MW now delivered, due to contracted payments, Galaxy expects Phase I to generate quarterly leasing revenue of approximately $80 million, and expected quarterly project-level Adjusted EBITDA margin of over 90% beginning in the third quarter of 2026.1 Treasury & Corporate generated adjusted gross loss of $(42) million and adjusted EBITDA of $(78) million, driven primarily by unrealized losses on digital assets and investment positions.1
GAAP Revenues and Transaction Expenses
Q2 2026
Q1 2026
Q/Q % Change
Gross Revenues & Gains/(Losses) from Operations
$8,711M
$10,213M
(15) %
Gross Transaction Expenses
$8,486M
$10,017M
(15) %
Segment Reporting Breakdown
Q2 2026
Q1 2026
Q/Q % Change
Digital Assets Adjusted Gross Profit1
$66M
$49M
34 %
Digital Assets Adjusted EBITDA1
($11M)
($19M)
N.M.
Data Centers Adjusted Gross Profit1
$20M
$3M
560 %
Data Centers Adjusted EBITDA1
$11M
($0.9M)
N.M.
Treasury & Corporate Adjusted Gross Profit1
($42M)
($140M)
N.M.
Treasury & Corporate Adjusted EBITDA1
($78M)
($167M)
N.M.
Adjusted Gross Profit1
$43M
($88M)
N.M.
Adjusted EBITDA1
($77M)
($188M)
N.M.
Net Income
($85M)
($216M)
N.M.
Note: Throughout this document, totals may not sum due to rounding. Percentage change calculations are based on unrounded results. N.M. is the abbreviation for “Not Meaningful”.
(1) Adjusted EPS, Adjusted Gross Profit, Adjusted EBITDA and project-level Adjusted EBITDA margin are non-GAAP financial measures. Please see Non-GAAP Financial Measures below for further information. Refer to pages 12 through 14 for more information and a non-GAAP to GAAP reconciliation to the most directly comparable GAAP measure.
— Digital Assets
Global Markets
Global Markets reported adjusted gross profit of $49 million in the second quarter.1
Galaxy’s digital asset trading volumes declined 7% QoQ in a period where industry trading volumes were down more than double-digit percentage points sequentially. Average loan book size of $1.4 billion was up modestly compared to the prior quarter. New loan originations increased QoQ, supported by the successful pre-launch of the Galaxy Onchain Financing Rate (“GOFR”), alongside broader demand from new and existing clients.Galaxy launched an OTC Prediction Markets offering, enabling institutional clients to implement multi-asset hedging strategies around event-driven markets.
KEY PERFORMANCE INDICATORS
Q2 2026
Q1 2026
Q/Q % Change
Global Markets Adjusted Gross Profit1
$49M
$31M
58 %
Loan Book Size (Average)
$1,438M
$1,427M
1 %
Total Trading Counterparties
1,741
1,691
3 %
Global Markets Adjusted Gross Profit: Gross Profit from Galaxy trading activity, net of transaction expenses, and fee revenue associated with the Investment Banking business. Loan Book Size (Average): Average market value of all open loans, excluding uncommitted credit facilities.
Asset Management & Infrastructure Solutions
Asset Management & Infrastructure Solutions generated $17 million of adjusted gross profit in Q2 2026.1
Galaxy ended Q2 with $7.1 billion in combined assets under management and assets under stake, down 12% QoQ, driven primarily by the depreciation of digital asset prices during the period.3Galaxy entered a multi-year agreement with BNY, which oversees more than $60 trillion in assets under custody, to further advance digital asset infrastructure for institutional markets, including support for staking on BNY’s Digital Asset Custody platform. In addition to staking, Galaxy is serving as a design partner to further advance BNY’s digital asset platform infrastructure.Galaxy launched the Galaxy Fintech Fund, a long-short hedge fund investing in the convergence of traditional finance, blockchain infrastructure, and emerging technologies.Galaxy and State Street Investment Management launched the State Street Galaxy Onchain Liquidity Sweep Fund (“SWEEP”), a tokenized private liquidity fund designed to enable 24/7 onchain cash management via stablecoin, subject to availability of stablecoin in the fund’s portfolio.
KEY PERFORMANCE INDICATORS
Q2 2026
Q1 2026
Q/Q % Change
Asset Management & Infrastructure Solutions
Adjusted Gross Profit1
$17M
$18M
(6) %
ETFs
$1,805M
$2,190M
(18) %
Alternatives
$2,553M
$2,757M
(7) %
Assets Under Stake
$2,790M
$3,215M
(13) %
All figures are unaudited. ETFs: Include assets in Galaxy-sponsored and sub-advised exchange-traded funds, including seed investments by affiliates, based on prices as of the end of the specified period. ETF assets include both Galaxy balance sheet and third-party assets. Changes in ETF assets are generally the result of performance, inflows/outflows, and market movements. Alternatives: Includes committed capital closed-end vehicles, fund of fund products, engagements to unwind portfolios, affiliated and unaffiliated separately managed accounts, and seed investments by affiliates, based on prices as of the end of the specified period. For committed capital closed-end funds, Alternatives are reported as Net Asset Value (“NAV”) plus unfunded commitments. Alternatives for quarterly close vehicles are reported as of the most recent quarter available for the applicable period. Assets Under Stake: Represents the total notional value of assets bonded to Galaxy validators, based on prices as of the end of the specified period. These figures include both Galaxy balance sheet and third-party assets. Note: As of the end of Q2 2026, $733M of assets are captured within both Assets Under Stake and Alternatives.
(1) Adjusted Gross Profit is a non-GAAP financial measure. Refer to page 12 for more information and a reconciliation to the most directly comparable GAAP measure. (2) Source: The Block. Industry-wide trading volumes defined as spot cryptocurrency monthly exchange volumes, BTC futures, BTC options, and ETH options volumes. (3) Assumes prices for relevant cryptocurrencies as of 6/30/2026.
— Data Centers
Data Centers generated $20 million of adjusted gross profit and $11 million of adjusted EBITDA in Q2 2026.1
Q2 marked the segment’s first quarter of revenue-generating operations, as Phase I data hall delivery ramped throughout the quarter, with all 133 MW of critical IT load under the Phase I lease in service by quarter end. With the full 133 MW now delivered, due to contracted payments, Galaxy expects Phase I to generate quarterly leasing revenue of approximately $80 million and expected quarterly project-level Adjusted EBITDA margin of over 90% beginning in Q3 2026.1
KEY PERFORMANCE INDICATORS
Q2 2026
Q1 2026
Data Centers Adjusted Gross Profit1
$20M
$3M
Data Centers Adjusted EBITDA1
$11M
($0.9M)
Data Centers Total Assets (End of Period)
$2,544M
$2,104M
Data Centers Total Liabilities (End of Period)
$1,548M
$1,330M
Data Centers Quarterly Capital Expenditure
$448M
$354M
Delivered Critical IT Load2
133 MW
–
(1) Adjusted Gross Profit, Adjusted EBITDA and project-level Adjusted EBITDA margin are non-GAAP financial measures. Refer to pages 12 – 14 for more information and a reconciliation to the most directly comparable GAAP measure. (2) Represents revenue-generating capacity delivered to tenants, reflecting capacity delivered at quarter end.
Helios Data Center Campus:
Galaxy completed delivery of the first phase of power at its Helios data center campus in West Texas, delivering 200 MW of gross power — 133 MW of critical IT load — to CoreWeave under the Company’s 15-year lease agreement. Phase I was delivered on schedule, with rent commencement under the Phase I lease scaling with delivered capacity throughout the second quarter of 2026.Galaxy commenced construction on Phase II of Helios, a 260 MW critical IT capacity expansion, with HITT Contracting serving as general contractor. HITT has been mobilized and on site since April 2026, with earthwork complete and structural foundation work now underway. Data hall deliveries under Phase II are expected to begin in the second quarter of 2027.On July 28, Galaxy, through its wholly-owned subsidiary Galaxy Helios Data Centers II LLC, completed a private offering of $3.5 billion of senior secured notes due 2031. Proceeds from the offering will be used to fund construction of Helios I, Phase II.Galaxy continues to advance discussions with prospective tenants for the additional 830 MW of approved capacity at Helios not yet under lease, and has 2 GW of additional power under study at the Helios campus alone to support the rising demand for AI infrastructure.
The Helios Campus
CoreWeave Leases (Phases I+II+III)
1.63GW
800MW
526MW
15 Years
Total Approved Gross
Power Capacity
Gross Power Capacity
Critical IT Load
Base Lease Term, Excluding
Two 5-Year Extension Options
2,200+
Q2 2026
$1.2B+
90%+
Campus Acreage1
Phase I Rent
Commencement Date
Anticipated Average
Annual Revenue2
Anticipated Average Lease-
Level Adjusted EBITDA
Margins2
(1) Represents land under direct control. (2) Based on committed contractual terms, internal estimates for capital expenditures. Reflects anticipated average annual revenue across the full 526MW of contracted critical IT load over the lease term. Actual results may differ materially due to business, economic and competitive uncertainties and contingencies, which are beyond the control of the Company and its management and subject to change. Average Lease-Level adjusted EBITDA margin is a non-GAAP financial measure Refer to pages 12 – 14 for more information and a reconciliation to the most directly comparable GAAP measure.
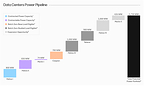
Galaxy’s Path to Multi-Gigawatt Scale
Galaxy continues to build out a multi-gigawatt power pipeline across Texas, now totaling over 5.7 GW of potential capacity, as it expands beyond Helios to meet accelerating demand for AI and HPC infrastructure.
The Helios Campus
Helios currently has more than 1.6 GW of approved power capacity. Two additional 1 GW load requests — Helios III and Helios IV — are progressing through ERCOT’s interconnection process. Together, these requests represent potential total capacity of 3.6 GW, which would place Helios among the largest known 100% front-of-the-meter data center campuses.
Recent Site Acquisitions
Galaxy executed a development agreement with the city of McGregor, Texas, to acquire 500 acres in the McGregor Industrial Park for the development of Merlin, an AI and HPC data center campus. Galaxy is advancing the electrical infrastructure required to support the campus and has secured an agreement for approximately 74 MW of capacity in the initial phase, with the potential to grow into a 500 MW campus as the utility upgrades transmission infrastructure.Galaxy also acquired two additional sites in Texas for the development of AI and HPC data center campuses, Caspian and Selene, which have potential capacity of approximately 700 MW and 900 MW, respectively, subject to ERCOT’s interconnection process.
— Balance Sheet
Equity Capital
As of June 30, 2026, Galaxy had $2.7 billion in equity capital.
Below is a breakout of how the Company’s equity capital is allocated across its Digital Assets, Data Centers and Treasury & Corporate segments.
$2.7 billion of equity capital across three segments:
~36%
~36%
~28%
Digital Assets
Data Centers
Treasury & Corporate
Treasury & Corporate Net Digital Asset and Investment Exposure
The Company’s Treasury & Corporate segment maintains exposure to the digital asset ecosystem through a diversified allocation across spot positions, derivatives, ETFs, equities, venture investments, private equity holdings and fund investments.
The below pie chart is representative of the Treasury & Corporate segment’s net digital asset and investment exposure as of June 30, 2026.
(1)
Includes spot BTC, BTC derivatives, short and other hedge positions, associated tokens such as wrapped BTC, and interests in investment vehicles designed to hold BTC.
(2)
Includes spot SOL, SOL derivatives, short and other hedge positions, associated tokens such as wrapped SOL, and interests in investment vehicles designed to hold SOL, including Galaxy’s investment in Forward Industries.
(3)
Represents spot and interests in investment vehicles that provide exposure to other digital assets.
(4)
Includes publicly traded securities, including those subject to a short-term lock-up.
Earnings Conference Call
An investor conference call will be held today, August 5, 2026, at 8:30 AM Eastern Time. A live webcast will be available at https://investor.galaxy.com/, on the Company’s YouTube channel and through the Company’s X profile (@GalaxyDigitalHQ). A replay of the webcast will be available and can be accessed in the same manner as the live webcast on the Company’s Investor Relations website. Through August 31, 2026, the recording will also be available by dialing 1-844-512-2921, or 1-412-317-6671 (outside the U.S. and Canada) and using the passcode: 18446.
About Galaxy Digital Inc. (Nasdaq: GLXY)
Galaxy Digital Inc. (Nasdaq: GLXY) is a global leader in digital assets and data center infrastructure, delivering solutions that accelerate progress in finance and artificial intelligence. Our digital assets platform offers institutional access to trading, advisory, asset management, staking, self-custody, and tokenization technology. In addition, we develop and operate cutting-edge data center infrastructure to power AI and HPC workloads. Our 1.6 GW Helios campus in Texas positions Galaxy among the largest and fastest-growing data center developers in North America. The Company is headquartered in New York City, with offices across North America, Europe, the Middle East, and Asia. Additional information about Galaxy’s businesses and products is available on www.galaxy.com.
CAUTIONARY STATEMENT ABOUT FORWARD-LOOKING STATEMENTS
This press release and the accompanying conference call may contain “forward-looking statements” within the meaning of Section 27A of the Securities Act of 1933, as amended (the “Securities Act”), Section 21E of the Securities Exchange Act of 1934, as amended (the “Exchange Act”) and the Private Securities Litigation Reform Act of 1995, and “forward-looking information” under Canadian securities laws (collectively, “forward-looking statements”). Our forward-looking statements include, but are not limited to, statements regarding our or our management team’s expectations, hopes, beliefs, intentions or strategies regarding the future. Statements that are not historical facts, including, without limitation, statements about Galaxy’s business plans and goals, including with respect to the Helios Data Center, lease agreements with CoreWeave, planned data centers, power capacity and energization timelines, the Galaxy Fintech fund, future reporting measures and business strategy, our future results of operations and financial position, and industry dynamics are forward-looking statements. In addition, any statements that refer to estimates, projections, forecasts or other characterizations of future events or circumstances, including any underlying assumptions, are forward-looking statements. The words “anticipate,” “believe,” “continue,” “could,” “estimate,” “expect,” “forecast,” “intend,” “may,” “might,” “plan,” “possible,” “potential,” “predict,” “project,” “should,” “would” and similar expressions may identify forward-looking statements, but the absence of these words does not mean that a statement is not forward-looking. The forward-looking statements contained in this document are based on our current expectations and beliefs concerning future developments and their potential effects on us taking into account information currently available to us. There can be no assurance that future developments affecting us will be those that we have anticipated. These forward-looking statements involve a number of risks, uncertainties (some of which are beyond our control) or other assumptions that may cause actual results or performance to be materially different from those expressed or implied by these forward-looking statements. These risks include, but are not limited to: (1) the inability to maintain Nasdaq’s listing standards; (2) costs related to AI/HPC plans, transactions, operations and strategy, including impairment charges recognized in connection with the conversion of our Helios mining infrastructure and negative Adjusted EBITDA in recent periods; (3) changes in applicable laws or regulations, and changes or events that impact the cryptocurrency and AI/HPC industry, including potential regulation, that are out of our control; (4) the possibility that the Company may be adversely affected by other economic, business, and/or competitive factors; (5) declines in the prices of digital assets or in the volume of transactions that we conduct, and our exposure to market risk on our digital asset and investment positions; (6) the risk that our business will not grow in line with our expectations; (7) the possibility that our addressable market is smaller than we have anticipated and/or that we may not gain share of it; (8) the possibility that there is a disruption or change in power dynamics impacting our results or current or future load capacity; (9) any delay or failure to consummate our business mandates or achieve our pipeline goals; (10) technological challenges, cyber incidents or exploits; (11) risks related to retrofitting our existing facility from mining to AI/HPC infrastructure, including the timing of construction and its impact on lease revenue; (12) any inability or difficulty in obtaining additional financing for AI/HPC infrastructure needs on acceptable terms or at all; (13) changes to the AI/HPC infrastructure needs and their impact on future plans at the Helios campus; (14) any delay in obtaining, or failure to obtain, necessary ERCOT power approvals; (15) risks associated with the leasing business, including those associated with counterparties; (16) risks associated with our GalaxyOne platform; and (17) those other risks contained in filings we make with the Securities and Exchange Commission (the “SEC”) from time to time, including in our Annual Report on Form 10-K for the fiscal year ended December 31, 2025, filed with the SEC on February 26, 2026 and available on Galaxy’s profile at www.sec.gov (our “Form 10-K”), as such factors may be updated from time to time in our filings with the SEC, including without limitation, our Quarterly Report on Form 10-Q for the quarterly period ended June 30, 2026. Should one or more of these risks or uncertainties materialize, they could cause our actual results to differ materially from the forward-looking statements. Except as required by law, we assume no obligation to update or revise any forward-looking statements whether as a result of new information, future events or otherwise, or to update the reasons if actual results differ materially from those anticipated in the forward-looking statements. You should not take any statement regarding past trends or activities as a representation that the trends or activities will continue in the future. Accordingly, you should not put undue reliance on these statements.
This press release and our earnings call contain certain preliminary information about our performance in the second quarter of 2026. This information is preliminary and represents the most current information available to management. The Company’s actual consolidated financial statements may differ materially as a result of the completion of normal quarterly accounting procedures and adjustments or due to other risks contained in our Form 10-K, as such risks may be updated from time to time in our filings with the SEC, including without limitation, our Quarterly Report on Form 10-Q for the quarterly period ended June 30, 2026. Although the Company believes the expectations reflected in this press release are based upon reasonable assumptions, the Company can give no assurance that actual results will not differ materially from these expectations.
Galaxy announces material information to the public through filings with the Securities and Exchange Commission, the investor relations and newsroom pages on its website (investor.galaxy.com and galaxy.com/newsroom), press releases, its LinkedIn profile (linkedin.com/company/galaxyhq), its X account (@galaxyhq), public conference calls and webcasts in order to achieve broad, non-exclusionary distribution of information to the public and for complying with its disclosure obligations under Regulation FD. Galaxy encourages investors and others to follow the channels listed above and to review the information disclosed through such channels.
Non-GAAP Financial Measures
In addition to our results determined in accordance with GAAP, this press release and the accompanying tables contain adjusted gross profit, adjusted EBITDA, project-level adjusted EBITDA margin, average lease-level adjusted EBITDA margin and adjusted EPS, which are non-GAAP financial measures. Adjusted gross profit, adjusted EBITDA, project-level adjusted EBITDA margin, average lease-level adjusted EBITDA margin and adjusted EPS are unaudited, presented as supplemental disclosure and should not be considered in isolation or as a substitute for, or superior to, the financial information prepared and presented in accordance with GAAP.
Please see pages 12 – 14 for a reconciliation of (i) adjusted gross profit to revenues and gains / (losses) from operations (including for our individual segments) during the three months ended June 30, 2026 and 2025, (ii) adjusted EBITDA to net income (loss) (including for our individual segments) during the three months ended June 30, 2026 and 2025 and (iii) adjusted EPS to diluted EPS for the three months ended June 30, 2026 and 2025. A reconciliation of the Company’s expected project-level adjusted EBITDA margin or average lease-level adjusted EBITDA margin to the most directly comparable GAAP financial measure cannot be provided without unreasonable effort and is not provided herein because of the inherent difficulty in forecasting and quantifying certain amounts that are necessary for such reconciliation and certain other items reflected in our reconciliation of historical non-GAAP financial measures, the amounts of which could be material.
It is important to note that the particular items we exclude from, or include in, adjusted gross profit, adjusted EBITDA, project-level adjusted EBITDA margin, average lease-level adjusted EBITDA margin and adjusted EPS may differ from the items excluded from, or included in, similar non-GAAP financial measures used by other companies in the same industry. We also periodically review our non-GAAP financial measures and may revise these measures to reflect changes in our business or otherwise.
We believe adjusted gross profit is a helpful non-GAAP financial measure to our management and investors because it eliminates the impact of the directly attributable transaction expenses. As such, it provides useful information about our financial performance, enhances the overall understanding of our past performance and future prospects, allows for greater transparency with respect to important metrics used by our management for financial, risk management and operational decision-making and provides an additional tool for investors to use to understand and compare our operating results across accounting periods.
Adjusted EBITDA is a non-GAAP financial measure that is used by management, in addition to GAAP financial measures, to understand and compare our operating results across accounting periods, for risk management and operational decision-making. This non-GAAP measure provides investors with additional information in evaluating the Company’s operating performance. Adjusted EBITDA represents Net income / (loss), excluding (i) equity-based compensation, (ii) notes interest and other expense, (iii) tax expense / (benefit), (iv) depreciation and amortization expense and (v) other discrete items which are not individually significant that we believe are not indicative of our ongoing results. The above items are excluded from our Adjusted EBITDA because these items are non-cash in nature, or because the amount and timing of these items are unpredictable, are not driven by core results of operations, and render comparisons with prior periods and competitors less meaningful. Project-level adjusted EBITDA margin is defined as project-level adjusted EBITDA for Helios Phase I, divided by leasing revenue, and excludes overhead expenses. Average lease-level adjusted EBITDA margin is defined as adjusted EBITDA for the CoreWeave lease, divided by leasing revenue, and excludes overhead expenses.
Adjusted EPS is defined as diluted EPS assuming all outstanding noncontrolling interest holders exchanged their LP units in GDH LP for Class A common stock of the Company. This non-GAAP financial measure is commonly used as an analytical indicator of performance by investors within the industries in which we operate. Adjusted EPS should not be considered in isolation or as an alternative to or a substitute for financial statement data presented in Galaxy Digital’s consolidated financial statements as indicators of financial performance.
Investors are cautioned that there are material limitations associated with the use of non-GAAP financial measures as an analytical tool.
© Copyright Galaxy Digital 2026. All rights reserved.
Galaxy Digital Inc.’s Consolidated Statements of Financial Position (unaudited)
(in thousands)
June 30, 2026
December 31,
2025
Assets
Current assets
Cash and cash equivalents
$ 895,744
$ 1,246,240
Digital intangible assets (includes $1,684.3 and $2,717.4 million measured at fair value)
2,450,733
3,526,216
Digital financial assets
1,055,655
988,621
Digital asset loans receivable, net of allowance
782,361
1,070,029
Investments
657,951
709,069
Assets posted as collateral, net of allowance
164,314
199,983
Derivative assets
135,134
83,807
Accounts receivable (includes $4.8 and $3.4 million due from related parties)
86,453
34,012
Digital assets receivable
3,171
3,778
Loans receivable, net of allowance
947,408
554,449
Prepaid expenses and other assets
59,523
99,734
Total current assets
7,238,447
8,515,938
Non-current assets
Digital assets receivable
3,218
4,719
Digital asset loans receivable, net of allowance, non-current
4,319
8,900
Investments (includes $740.9 and $864.0 million measured at fair value)
884,128
1,023,236
Digital intangible assets
11,023
26,824
Loans receivable, net of allowance, non-current
6,787
2,553
Property and equipment, net
2,218,204
1,423,113
Other non-current assets
411,332
276,275
Goodwill
66,523
66,523
Total non-current assets
3,605,534
2,832,143
Total assets
$ 10,843,981
$ 11,348,081
Liabilities and Equity
Current liabilities
Derivative liabilities
151,348
40,482
Accounts payable and accrued liabilities
306,839
277,663
Digital assets borrowed
1,486,909
2,361,161
Payable to customers
80,723
85,808
Loans payable
286,715
52,626
Collateral payable
1,933,066
1,980,171
Notes payable – current
436,985
428,545
Other current liabilities
130,583
85,062
Total current liabilities
4,813,168
5,311,518
Non-current liabilities
Notes payable
2,825,773
2,432,510
Digital assets borrowed, non-current
27,560
56,107
Other non-current liabilities (includes $71.5 and $72.3 million due to related parties)
457,372
513,169
Total non-current liabilities
3,310,705
3,001,786
Total liabilities
8,123,873
8,313,304
Equity
Class A common stock, $0.001 par value; 2,000,000,000 shares authorized and 194,798,949 issued and outstanding
194
192
Convertible Class B common stock, $0.0000000001 par value; 500,000,000 shares authorized and 196,596,698 issued and outstanding
—
—
Additional Paid in Capital
1,588,391
1,614,660
Accumulated other comprehensive income (loss)
1,926
(2,038)
Retained Earnings
232,855
342,921
Total stockholders’ equity(1)
1,823,366
1,955,735
Noncontrolling interest
896,742
1,079,042
Total equity
2,720,108
3,034,777
Total liabilities and equity
$ 10,843,981
$ 11,348,081
(1) For periods prior to the Reorganization Transactions, represents total GDH LP Unit Holders’ Capital.
Galaxy Digital Inc.’s Consolidated Statements of Operations and Other Comprehensive Income (Loss) (unaudited)
Three Months Ended
Six Months Ended
(in thousands)
June 30, 2026
June 30, 2025
June 30, 2026
June 30, 2025
Revenues
$ 8,557,336
$ 8,661,555
$ 18,598,780
$ 21,637,761
Gains / (losses) from operations
134,320
395,094
306,101
274,763
Data center leasing revenue
18,877
—
18,877
—
Revenues and gains / (losses) from operations
8,710,533
9,056,649
18,923,758
21,912,524
Operating expenses:
Transaction expenses
8,485,821
8,629,940
18,502,566
21,576,949
Impairment of digital assets
181,348
127,477
465,750
239,906
Compensation and benefits
83,996
64,969
167,544
121,922
General and administrative
18,766
11,783
33,348
85,745
Depreciation and amortization
9,161
7,458
15,000
20,071
Technology
16,254
11,598
31,017
21,485
Professional fees
19,012
22,791
30,043
43,563
Notes interest expense
25,098
14,240
42,674
28,311
Total operating expenses
8,839,456
8,890,256
19,287,942
22,137,952
Other income / (expense):
Unrealized gain / (loss) on notes payable – derivative
—
(125,150)
—
(35,544)
Other income / (expense), net
736
918
1,440
1,590
Total other income / (expense)
736
(124,232)
1,440
(33,954)
Net income / (loss) before taxes
$ (128,187)
$ 42,161
$ (362,744)
$ (259,382)
Income taxes expense / (benefit)
(42,871)
11,470
(61,117)
5,358
Net income / (loss)
$ (85,316)
$ 30,691
$ (301,627)
$ (264,740)
Other comprehensive income (loss), net of tax
Change in fair value of cash flow hedges
3,492
—
8,043
—
Other comprehensive income (loss)
3,492
—
8,043
—
Comprehensive income (loss)
$ (81,824)
$ 30,691
$ (293,584)
$ (264,740)
Comprehensive income / (loss) attributed to:
Class B Unit holders of GDH LP
—
(19,255)
—
(204,745)
Noncontrolling interests
(65,636)
35,446
(187,482)
35,446
Class A common stockholders of the Company(1)
$ (16,188)
$ 14,500
$ (106,102)
$ (95,441)
Net income / (loss) per share of Class A common stock (2)
Net income (loss) used in calculation of net income / (loss) per share of Class A common stock (2)
$ (17,913)
$ 14,500
$ (110,066)
$ (95,441)
Basic
$ (0.09)
$ 0.10
$ (0.57)
$ (0.70)
Diluted
$ (0.09)
$ 0.08
$ (0.58)
$ (0.76)
Weighted average shares outstanding used to compute net income / (loss) per share(3)
Basic
192,869,271
143,103,474
192,474,019
135,525,464
Diluted
192,869,271
371,717,071
390,465,556
349,390,820
(1) For periods prior to the Reorganization Transactions, represents net income / (loss) attributable to Class A Units of GDH LP.
(2) For periods prior to the Reorganization Transactions, represents net income / (loss) per Class A Unit of GDH LP.
(3) For periods prior to the Reorganization Transactions, represents weighted average Class A Units of GDH LP used to calculate net income / (loss) per unit.
Ownership of GDH LP Limited Partnership Interests
June 30, 2026
December31, 2025
Ownership
% interest
Ownership
% interest
Galaxy Digital Inc
194,798,949
49.8 %
192,695,681
49.3 %
Noncontrolling interests
196,596,698
50.2 %
198,408,277
50.7 %
Total
391,395,647
100.0 %
391,103,958
100.0 %
Reconciliation of Adjusted Gross Profit
The following table reconciles adjusted gross profit to revenues and gains / (losses) from operations for the three months ended June 30, 2026 and March 31, 2026:
Three Months Ended June 30, 2026
(in thousands)
Digital Assets
Data Centers
Treasury and
Corporate
Total
Revenues and gains / (losses) from operations
$ 8,716,232
$ 25,959
$ (31,658)
$ 8,710,533
Less: Transaction expenses
8,469,179
5,816
10,826
8,485,821
Less: Impairment of digital assets
181,348
—
—
181,348
Adjusted gross profit
$ 65,705
$ 20,143
$ (42,484)
$ 43,364
Three Months Ended March 31, 2026
(in thousands)
Digital Assets
Data Centers
Treasury and
Corporate
Total
Revenues and gains / (losses) from operations
$ 10,348,833
$ 3,050
$ (138,658)
$ 10,213,225
Less: Transaction expenses
10,015,414
—
1,331
10,016,745
Less: Impairment of digital assets
284,402
—
—
284,402
Adjusted gross profit
$ 49,017
$ 3,050
$ (139,989)
$ (87,922)
Reconciliation of Adjusted EBITDA
The following table reconciles the Company’s adjusted EBITDA figures to net income for the three months ended June 30, 2026 and March 31, 2026:
(in thousands)
Digital Assets
Data Centers
Treasury and
Corporate
Three Months
Ended June
30, 2026
Net income / (loss)
$ (19,048)
$ 31,155
$ (97,423)
$ (85,316)
Add back:
Equity based compensation and related expense
9,218
657
6,331
16,206
Notes interest and other expense
—
7,365
17,732
25,097
Tax expense / (benefit)
(1,704)
(32,450)
(8,717)
(42,871)
Depreciation and amortization expense
1,650
4,762
2,749
9,161
Other (1)
(646)
—
1,111
465
Adjusted EBITDA
$ (10,530)
$ 11,489
$ (78,217)
$ (77,258)
(in thousands)
Digital Assets
Data Centers
Treasury and
Corporate
Three Months
Ended March
31, 2026
Net income / (loss)
$ (34,304)
$ (1,547)
$ (180,460)
$ (216,311)
Add back:
Equity based compensation and related expense
10,971
637
6,491
18,099
Notes interest and other expense
—
—
17,576
17,576
Tax expense / (benefit)
—
—
(18,246)
(18,246)
Depreciation and amortization expense
3,164
—
2,675
5,839
Other (1)
808
—
4,698
5,506
Adjusted EBITDA
$ (19,361)
$ (910)
$ (167,266)
$ (187,537)
(1) Includes non-operating income and expenses, as well as other discrete items not indicative of ongoing operating performance, none of which were individually significant.
Reconciliation of Adjusted Income (Loss) per Share
The adjusted income (loss) per share represents the diluted income (loss) per Class A common stock assuming all outstanding noncontrolling interest holders exchanged their LP units in GDH LP for Class A common stock of the Company. In periods where the noncontrolling interest is already included in the GAAP diluted income (loss) per share, the adjusted income (loss) per share is identical to the GAAP income (loss) per share. Prior to the Reorganization Transactions, the noncontrolling interest was represented by Class B Units of Galaxy Digital Holdings LP.
The following table reconciles the Company’s adjusted income (loss) per share figures to diluted and basic income (loss) per share for the three and six months ended June 30, 2026 and June 30, 2025:
Three Months Ended
Six Months Ended
(in thousands, except for share data and per share amounts)
June 30, 2026
June 30, 2025
June 30, 2026
June 30, 2025
Net income (loss) to Class A unitholders
$ (17,913)
$ 14,500
$ (110,066)
$ (95,441)
Weighted-average Class A shares outstanding
192,869,271
143,103,474
192,474,019
135,525,464
Basic earnings (loss) per share
$ (0.09)
$ 0.10
$ (0.57)
$ (0.70)
Numerator:
Net income (loss) to Class A (basic)
$ (17,913)
$ 14,500
$ (110,066)
$ (95,441)
Add: Income (loss) attrib. to NCI (after tax)
—
16,191
(116,860)
(169,299)
Net income (loss) to Class A (diluted)
(17,913)
30,691
(226,926)
(264,740)
Denominator:
WA Class A shares outstanding (basic)
192,869,271
143,103,474
192,474,019
135,525,464
Add: NCI share exchange
—
211,890,313
197,991,537
213,865,356
Add: Compensatory awards
—
16,723,284
—
—
WA shares outstanding (diluted)
192,869,271
371,717,071
390,465,556
349,390,820
Diluted earnings (loss) per share
$ (0.09)
$ 0.08
$ (0.58)
$ (0.76)
Net income used to calculate diluted EPS
$ (17,913)
$ 30,691
$ (226,926)
$ (264,740)
Noncontrolling interest not included in diluted EPS numerator
(17,914)
—
—
—
Net income used to calculate adjusted income (loss) per share
$ (35,827)
$ 30,691
$ (226,926)
$ (264,740)
Weighted average number of Class A Common Stock shares for the purposes of diluted income (loss) per share
192,869,271
371,717,071
390,465,556
349,390,820
Additional noncontrolling interest weighted average shares outstanding
197,579,377
—
Weighted average number of Class A Common Stock shares for the purposes of Adjusted income (loss) per share
390,448,648
371,717,071
390,465,556
349,390,820
Adjusted income (loss) per share
$ (0.09)
$ 0.08
$ (0.58)
$ (0.76)
View original content to download multimedia:https://www.prnewswire.com/news-releases/galaxy-announces-second-quarter-2026-financial-results-302843529.html
SOURCE Galaxy Digital Inc.

You may like
Technology
Generate Capital Announces Sale of Global Anaerobic Digestion Platform Generate Upcycle
Published
41 minutes agoon
September 21, 2026By

Pinta Energy and Vanguard Renewables to acquire separate portions of 12-site platform across the United Kingdom, Canada and the United States
NEW YORK, Sept. 21, 2026 /PRNewswire/ — Generate Capital (“Generate”), a leading investor, owner and operator of critical infrastructure today announced the 100% sale of Generate Upcycle “Upcycle“, its global anaerobic digestion platform, through two separate transactions in North America and the UK.
Pinta Energy, a UK-based renewable energy platform and part of the ABIO Group of companies, a leading pan-European biogas platform backed by Asterion Industrial Partners, has acquired Upcycle’s seven UK facilities.
Vanguard Renewables, a leading U.S. environmental services platform and producer of biomethane from organic waste, has signed an agreement to acquire Upcycle’s five North American facilities in Ontario, Canada and upstate New York. The transaction is expected to close on October 1, 2026.
The transactions position the businesses with strategic operators to support their next phase of growth.
“We have spent the past decade building Upcycle into a scaled organic waste platform with strong businesses across three countries,” said David Crane, CEO of Generate Capital. “Pinta Energy and Vanguard Renewables bring the experience and capabilities to support these businesses as they continue to grow. For Generate, the transactions allow us to recycle capital toward our strategy of delivering reliable power to large energy users in an increasingly constrained grid.”
Upcycle is a renewable natural gas and electricity production platform that provides integrated organic waste solutions to public and private-sector partners across Canada, the United States and the United Kingdom. In 2025, Upcycle processed more than 871,000 tons of food and agricultural waste, and generated more than 365,000 MWh of renewable energy, including 1.1 billion cubic feet of renewable nature gas. As a result, the company avoided 609,739 MTCO2e tons of harmful emissions from escaping into the atmosphere, the equivalent of taking approximately 132,552 gasoline-powered passenger vehicles off the road for a year.
Generate has invested in anaerobic digestion since 2016, building Upcycle into one of the largest pure-play organic waste platforms, with 12 facilities across three countries. Through sustained investment in the platform, its management team and operations, Generate helped build businesses with strong operating track records that are well positioned for continued growth in their respective markets.
About Generate Capital
Generate Capital is an investor and operator providing reliable and affordable energy solutions to customers for over a decade. Founded in 2014, Generate focuses on accelerating the energy transition by helping large energy users access power and connection faster in a grid constrained world. The firm supports data centers and other power-intensive facilities with multi-technology scalable energy infrastructure solutions, combining deep investment expertise with hands-on operating capabilities. Since inception, Generate has raised more than $16 bn in capital and built a proven track record across critical infrastructure assets.
For more information, visit www.generatecapital.com.
About Vanguard Renewables
Vanguard Renewables is a leading U.S. environmental services company and producer of biomethane from organic waste. Headquartered in Weston, Massachusetts, the company builds, owns, and operates on-farm anaerobic digesters that convert food, beverage, and agricultural waste into pipeline-ready renewable natural gas. Vanguard Renewables is rapidly scaling its footprint, operating sites across the Northeast, Midwest, and Southeast while developing additional facilities nationwide. By diverting organic waste streams from landfills, the company is reducing greenhouse gas emissions at scale while supporting critical domestic energy infrastructure and regenerative agriculture for America’s farms. Vanguard Renewables is a portfolio company of Global Infrastructure Partners (GIP), part of BlackRock.
Learn more at www.vanguardrenewables.com
View original content to download multimedia:https://www.prnewswire.com/news-releases/generate-capital-announces-sale-of-global-anaerobic-digestion-platform-generate-upcycle-302882739.html
SOURCE Generate Capital
Technology
Vaulted Deep Secures $35 Million in Debt Financing to Expand Nationwide
Published
42 minutes agoon
September 21, 2026By
New financing from Mediobanca and facilitated by CFP Energy will support new waste disposal sites across the country and continued investment in technology to accelerate site development
HOUSTON, Sept. 21, 2026 /PRNewswire/ — Vaulted Deep, a waste management company building subsurface infrastructure for organic waste, today announced a $35 million debt facility from Mediobanca to expand its national buildout. The financing, arranged by CFP Energy, a leading provider of market-based energy transition solutions, is the largest publicly disclosed U.S. commercial debt deal in durable carbon removal to be secured by long-term purchase contracts. It demonstrates how such contracts can help companies borrow from mainstream lenders to build physical infrastructure.
The facility was supported by Vaulted’s waste service agreements and contracted carbon removal revenue, including its set of offtakes with Frontier buyers. Frontier is an advance market commitment backed by companies including Stripe, Shopify, and Google. Vaulted delivered more than 20,000 tons of carbon removal to Frontier buyers in the first half of 2026, surpassing the total amount delivered in 2025. Since 2023, the company has also increased weekly waste volume sixfold, reflecting its ability to scale operations alongside demand.
“Waste operators across the country need new options as traditional disposal options become limited. This financing lets us take on more projects and invest in the tools that help us evaluate and develop new sites faster,” said Julia Reichelstein, CEO and Co-Founder of Vaulted Deep. “This is a meaningful milestone for Vaulted as we move into the next phase of building infrastructure at a much larger scale.”
The new capital will help Vaulted advance more projects through its AI-Accelerated Site Development Platform, which combines proprietary technology and operating experience across site discovery, permitting, and injection operations. Geology, regulatory, and waste-supply data narrow the search for candidate sites while standardized templates and regulatory guides speed up the path to permitting. Once a site is running, monitoring and control algorithms maximize safe disposal capacity. Together, these tools make new sites faster to open and easier to replicate.
“Frontier’s theory of change is that robust demand for carbon removal, in the form of large, multi-year offtake agreements, gives companies the ability to raise the capital required to build and expand their businesses,” said Frontier spokesperson Hannah Bebbington Valori. “Vaulted raising institutional debt to expand their site development capabilities is a great example of this theory in practice.”
Tyler Manchester, Head of Voluntary Carbon, CFP Energy said: “By facilitating these types of transactions, we connect institutional capital with innovative climate technologies, helping accelerate the deployment of high-integrity carbon removal solutions. It reflects growing investor confidence in these solutions, driven by rising demand from corporate buyers seeking permanent pathways to support net-zero commitments and long-term climate strategies.”
The facility adds a new source of growth capital alongside the $48 million in equity Vaulted has raised to date and its $8 million XPRIZE Carbon Removal award. The capital positions Vaulted to advance multiple infrastructure projects as it builds beyond its existing operations.
Artio, a leading carbon insurance firm, supported the transaction by helping to de-risk the investment, as part of its wider work to unlock capital for high-quality carbon projects.
About Vaulted Deep
Vaulted Deep builds and operates subsurface infrastructure for organic waste, creating a scalable alternative to land application, landfilling, and incineration. Using proven deep well injection technology, the company stores waste deep underground in stable geologic formations. It works with municipalities, industrial operators, and agricultural producers to expand disposal capacity for hard-to-manage waste streams. By placing the waste deep underground, Vaulted reduces potential impacts on local land, air, and water that can come with surface disposal, while permanently removing carbon. Its infrastructure is permitted, operating, and designed to scale. Learn more at vaulteddeep.com.
Media Contact: Brooke Kinney | Vaulted@launchsquad.com
About CFP Energy
CFP Energy is a leading specialist in carbon and environmental markets, helping large organisations navigate complex regulatory environments and volatile market conditions. With 20 years of experience and 9 offices across Europe, CFP Energy has built deep expertise across all major compliance carbon markets, including the EU and UK ETS.
Alongside access to environmental markets, CFP Energy offers a broader suite of services across gas and power, as well as voluntary carbon, biofuels and financial products. Through tailored market access services and financial solutions, the company acts as a strategic partner, helping businesses unlock liquidity, support investment and drive commercial growth throughout the energy transition.
Media Contact: Weronika Slomka/Sophie Colton | CFPEnergy@h-advisors.global
View original content to download multimedia:https://www.prnewswire.com/news-releases/vaulted-deep-secures-35-million-in-debt-financing-to-expand-nationwide-302883742.html
SOURCE Vaulted Deep
Technology
RetailMeNot Launches App Week With Exclusive Cash Back Deals Across 7 Top Shopping Categories
Published
42 minutes agoon
September 21, 2026By

The new RetailMeNot Rewards app brings shoppers a week of hand-picked cash back offers, trending products and seasonal savings across seven key shopping categories.
AUSTIN, Texas, Sept. 21, 2026 /PRNewswire/ — Today, RetailMeNot kicks off App Week, a seven-day shopping event offering RetailMeNot Rewards app users exclusive, limited-time cash back offers across seven categories, from home and travel to electronics, beauty, fashion, pets and sports.
Running September 21–27, App Week transforms the RetailMeNot Rewards app into a daily shopping destination, with a new category spotlight each day and hand-picked offers featuring increased app-only cash back from brands and retailers shoppers know and love. The offers are available exclusively to RetailMeNot Rewards app users, giving shoppers a reason to tap in each day and discover what’s new.
App Week builds on the launch of the new RetailMeNot Rewards app, which debuted in August as the company’s latest evolution of its mobile shopping experience. Since launching the new app, buyers are placing 27% more orders with RetailMeNot merchant partners. The increase suggests that shoppers who engage with the new savings experience are returning more frequently and spending more overall.
“App Week is designed around how people actually shop today. They want to know what’s worth buying, where they can find value and whether a deal is really a deal,” said Stephanie Carls, Retail Insights Expert at RetailMeNot. “And right now, shoppers have a lot to think about. Halloween and holiday shopping are already underway for many consumers, so this is a great window to get ahead of seasonal purchases, whether that’s an advent calendar, a Christmas tree, a giant skeleton or matching family pajamas. App Week gives shoppers another reason to check in, see what’s trending and save while they’re at it.”
The Holiday Shopper is already in motion
App Week arrives as shoppers are getting an early start on fall and holiday purchases. A RetailMeNot survey found that 63% of shoppers begin holiday shopping in October or earlier, and 47% plan to shop earlier this year than last year.
As shoppers plan ahead, they’re also looking for more ways to stretch their budgets. 71% say they’re more likely to use savings tools because of the current economy, making timely, trusted savings more valuable than ever.
App Week brings that value together with RetailMeNot’s editorial expertise and shopping insights, giving shoppers a curated destination to discover what to buy, where to save and what’s trending throughout the week.
Seven days. Seven categories. App-only savings.
Throughout App Week, RetailMeNot Rewards app users can tap in to discover a new category spotlight each day. Offers remain available throughout the week, while daily spotlights introduce shoppers to the category and featured savings.
Date
Category
Offers
September 21
Home & Garden
Home Depot: 10% cash back sitewideLowe’s: 14% cash back sitewideTarget: 8% cash back sitewideWalmart: 8% cash back sitewide
September 22
Travel
Expedia: 16% cash back sitewideBooking.com: 20% cash back sitewideCVS: 28% cash back sitewideIHG: 20% cash back sitewideSamsonite: 12% cash back sitewide
September 23
Electronics & Smart
Home
Vitamix: 18% cash back sitewideBest Buy: 8% cash back sitewideLG: 28% cash back sitewideWalmart: 8% cash back sitewide
September 24
Health & Beauty
Ulta: 16% cash back sitewideSephora: 8% cash back sitewideCVS: 28% cash back sitewideTarte: 20% cash back sitewideL’Occitane: 20% cash back sitewide
September 25
Clothing, Accessories &
Shoes
Old Navy: 8% cash back sitewideAthleta: 8% cash back sitewideExpress: 18% cash back sitewideNike: 16% cash back sitewideSHEIN: 25% cash back sitewide
September 26
Pets
Chewy: 8% cash back sitewideWalmart: 8% cash back sitewidePetco: 8% cash back sitewidePetSmart: 8% cash back sitewide
September 27
Sports & Outdoors
Home Depot: 10% cash back sitewideAthleta: 8% cash back sitewideadidas: 24% cash back sitewideAlo Yoga: 14% cash back sitewideColumbia: 8% cash back sitewide
With rotating daily spotlights, app-only cash back and hand-picked offers, App Week gives shoppers a new reason to tap in throughout the week. RetailMeNot Rewards app users can tap into App Week from September 21–27 to discover each day’s featured savings. The RetailMeNot Rewards app is available for download on iOS and Android.
About RetailMeNot Group: The RetailMeNot Group brings together leading shopping, savings and deal discovery brands that help people shop smarter and help businesses connect with high-intent consumers at moments of purchase. The RetailMeNot Group portfolio includes RetailMeNot, Offers.com, BlackFriday.com, TechBargains, Deals of America and R BrandWorks, reaching millions of consumers through trusted social content, real-time deals, cash back, and seasonal shopping moments. RetailMeNot Group operates as part of Ziff Davis, a leading digital media and internet company.
To learn more, visit www.ziffdavis.com/brands/shopping
About Ziff Davis: Ziff Davis (NASDAQ: ZD) is a vertically focused digital media and internet company whose portfolio includes leading brands in technology, shopping, gaming and entertainment, health and wellness, connectivity, cybersecurity, and martech. For more information, visit www.ziffdavis.com.
Press Contact: media@rmn.com
View original content to download multimedia:https://www.prnewswire.com/news-releases/retailmenot-launches-app-week-with-exclusive-cash-back-deals-across-7-top-shopping-categories-302884736.html
SOURCE RetailMeNot, Inc.


Generate Capital Announces Sale of Global Anaerobic Digestion Platform Generate Upcycle

Vaulted Deep Secures $35 Million in Debt Financing to Expand Nationwide

RetailMeNot Launches App Week With Exclusive Cash Back Deals Across 7 Top Shopping Categories

Send Rakhi to UK swiftly with UK Gifts Portal

Whiteboard Series with NEAR | Ep: 45 Joel Thorstensson from ceramic.network

New Gooseneck Omni Antennas Offer Enhanced Signals in a Durable Package

Why You Should Build on #NEAR – Co-founder Illia Polosukhin at CV Labs
Whiteboard Series with NEAR | Ep: 45 Joel Thorstensson from ceramic.network

NEAR End of Year Town Hall 2021: The Open Web World, MetaBUILD 2 Hackathon and 2021 recap
Trending
-

 Technology4 days ago
Magentic raises $18M to build the AI workforce for the physical world
-
 Technology3 days ago
Peoplevine Secures Multi-Million-Dollar Growth Investment to Accelerate AI-Powered Hospitality
-

 Technology5 days ago
Aristotle Secures $5M to Replace the Chatbot with High-Dosage AI Tutoring for Students
-
Technology3 days ago
Saturday, September 19, 2026
-

 Technology3 days ago
4Humanity Introduces the National Positivity Portal, Using AI to Make the Good Happening Across America Easier to See
-

 Technology4 days ago
dtcpay Welcomes SBI Group as Strategic Investor, Extending Series A to US$25M
-
 Technology4 days ago
Insider One Introduces Agent One™, the Self-Optimizing Intelligence System for Autonomous Customer Engagement
-

 Technology5 days ago
Blockboard Named Finalist in Two Categories at the 2026 Digiday Technology Awards