Connect with us

Technology

Data Center Virtualization Market to Reach $60.90 Billion by 2035 as Multi-Hypervisor and Kubernetes-Native Adoption Reshape Enterprise Infrastructure

Published

on

DC Market Insights forecasts 7.43% CAGR through 2035; Kubernetes-native virtualization grows 21.29% annually while North America holds 40.6% of 2025 market value

LONDON, Oct. 7, 2026 /PRNewswire/ — The global Data Center Virtualization Market was valued at $29.75 billion in 2025 and is projected to reach $60.90 billion by 2035, expanding at a compound annual growth rate of 7.43%, according to a new study from DC Market Insights. The market is moving into a new phase in which platform diversification, licensing economics, Kubernetes-native infrastructure and higher demand for migration and managed services are reshaping how enterprises and data center operators deploy virtualized compute.

View the full report:  https://www.dcmarketinsights.com/report/data-center-virtualization-market 

$29.75B

$60.90B

7.43 %

40.6 %

2025 market size

2035 forecast

CAGR, 2025-2035

North America share

“The next decade of data center virtualization will be defined less by whether workloads are virtualized and more by how operators manage platform choice, licensing economics and mixed VM-container estates. Proprietary Type 1 hypervisors remain the largest segment today, but KVM-based and Kubernetes-native platforms together are projected to rise from 28.2% of market value in 2025 to 46.5% by 2035. That transition is creating a larger opportunity for migration, orchestration and managed services across enterprise, colocation and cloud environments.”

— Amit Jain, Senior Consultant, ICT & Emerging Technologies, DC Market Insights, and lead analyst of the report

Virtualized Core Growth and Licensing Changes Drive Market Expansion

DC Market Insights identifies three forces behind most of the market’s growth: expansion of the virtualized physical core base, higher software spend per core following licensing changes and a sustained wave of upgrade and migration projects. The firm models the installed virtualized core base rising from about 92.0 million in 2025 to 155.75 million by 2035. Server virtualization software alone is forecast to increase from $14.90 billion to $28.45 billion over the same period.

The report also finds that average server virtualization software spend increased from about $136 per core in 2023 to $162 per core in 2025. That price reset contributed significantly to the market’s 2025 value expansion. Looking ahead, growth becomes more volume- and service-driven as enterprises add cores, automate mixed infrastructure and outsource a larger share of ongoing operations.

Multi-Hypervisor Strategies Move Into the Mainstream

The competitive structure of virtualization is broadening. Proprietary Type 1 hypervisors accounted for 71.8% of market value in 2025, but their share is projected to decline to 53.5% by 2035. Open-source and KVM-based hypervisors are forecast to grow from $6.72 billion in 2025 to $16.83 billion by 2035, a 9.61% CAGR, while Kubernetes-native virtualization is the fastest-growing hypervisor category at 21.29% annually, increasing from $1.67 billion to $11.48 billion.

This shift does not imply the disappearance of established proprietary platforms. Instead, the report points to a more diversified operating model in which large buyers maintain core estates on established platforms while deploying new or less critical workloads on KVM-based, hyperconverged or Kubernetes-native alternatives. That architecture raises demand for cross-platform management, policy automation, skills, migration tooling and services.

Server Virtualization Software Retains the Largest Component Share

Server virtualization software represented 50.1% of global market revenue in 2025 at $14.90 billion. Professional services accounted for $4.15 billion, desktop and application virtualization for $4.66 billion, virtualization management and orchestration for $3.50 billion and managed services for $2.54 billion.

Managed services are projected to record the strongest growth among components, advancing at 11.70% annually to $7.67 billion by 2035. Virtualization management and orchestration also grows faster than the overall market, reaching $8.03 billion by 2035 as operators automate patching, policy enforcement, lifecycle management and capacity planning across several hypervisors.

On-Premises Enterprise Data Centers Lead, but Hosted and Edge Models Gain Share

On-premises enterprise data centers were the largest deployment segment in 2025 at $15.59 billion, or 52.4% of global spending. Colocation and hosted private cloud represented 23.6%, cloud service provider data centers 17.4% and edge and remote sites 6.6%. Edge and remote deployments are forecast to grow fastest at 11.90% annually, reaching $6.05 billion by 2035.

Large enterprises accounted for 69.3% of market value in 2025, while small and medium enterprises are projected to grow faster through hosted, managed and subscription-based offerings. Banking, financial services and insurance was the largest end-user vertical at 22.6% of spending, followed by IT and telecom. Healthcare is forecast to be the fastest-growing major vertical as hospitals virtualize clinical applications, shared workstations and data-intensive workloads.

North America Leads; Asia Pacific Gains the Most Share

North America led the market with $12.08 billion in 2025, representing 40.6% of global value, and is forecast to reach $22.42 billion by 2035. The region has the largest installed base of proprietary hypervisors and is therefore seeing a significant volume of licensing reviews, platform renewals and migration projects.

Europe held 27.8% of the market in 2025 at $8.27 billion, while Asia Pacific accounted for 23.4% at $6.96 billion. Asia Pacific is projected to reach $16.92 billion by 2035 at a 9.29% CAGR, gaining 4.4 percentage points of global share. The Middle East and Africa is the fastest-growing region at 9.79% annually, supported by new government, financial services and telecom infrastructure.

The United States was the largest country market at $10.77 billion in 2025, equal to 36.2% of global spending. China ranked second at $2.21 billion, followed by Germany at $1.75 billion. India is forecast to grow fastest among the major country markets at 13.49% annually through 2035.

Competitive Landscape Shifts Toward Platform Choice and Migration Economics

The report profiles 16 companies across server virtualization, desktop and application virtualization, management software and services. Broadcom (VMware) is estimated to lead the market with about 39% of 2025 value, while Broadcom, Microsoft and Citrix together account for approximately 58%. Other profiled competitors include Nutanix, Red Hat, Omnissa, Hewlett Packard Enterprise, Oracle, Proxmox Server Solutions, SUSE, Huawei, Scale Computing, Dell Technologies, IBM, Parallels and Canonical.

Recent developments reinforce the move toward broader platform choice. HPE made Morpheus VM Essentials generally available in May 2025, Omnissa announced Horizon support for Nutanix AHV, Broadcom made VMware Cloud Foundation 9.0 generally available in June 2025 and Proxmox released Proxmox VE 9.0 in August 2025. Nutanix reported fiscal 2026 revenue of $2.85 billion and more than 3,000 new customers, reflecting growing interest in alternative virtualization stacks.

Forecast Scenarios Put 2035 Market Between $51.28 Billion and $70.22 Billion

DC Market Insights’ base case places the market at $60.90 billion by 2035. A lower-growth scenario, built around faster switching to lower-cost platforms, flat spend per core after 2026 and slower core expansion, produces a $51.28 billion market. A high case, in which bundle pricing remains firm and managed services and edge deployments expand faster, places the market at $70.22 billion.

Kubernetes-native virtualization is a central structural variable in the forecast because it shifts value from the traditional hypervisor license toward container-platform subscriptions and integrated management. For buyers, that makes total cost of ownership, workload portability, governance and operational tooling increasingly important in platform selection.

Research Methodology

DC Market Insights built the market model bottom-up from annual cohorts of virtualized physical cores and concurrent hosted desktop users, with separate pricing curves for hypervisor and management software. Professional and managed services were then added as ratios of software spending. The model was split across five components, three hypervisor types, four deployment models, two organization sizes, seven verticals and five regions. Results were cross-checked against supplier disclosures, published licensing terms and country-level installed server and data center capacity estimates.

Get Free Report Sample – https://www.dcmarketinsights.com/report/data-center-virtualization-market 

Report author: Amit Jain, Senior Consultant, ICT & Emerging Technologies. Reviewed by: Deepti Agrawal, Senior Editor, Research.

Related Reports from DC Market Insights

Software-Defined Data Center MarketData Center Automation MarketData Center Orchestration MarketSoftware-Defined Networking (SDN) in the Data Center MarketAIOps for Data Center Management Market

Data Tools by DCMI – 

Data Center Map – Deal Tracker – PUE Calculator

About DC Market Insights

DC Market Insights is the data center research and consulting practice of Credence Research, founded in 2015. The firm sizes data center markets, develops forecasts to 2035 and advises investors, operators, vendors and governments on commercial due diligence, site selection, market entry, power strategy, market sizing and competitive intelligence. Its research spans the data center value chain across facilities, power, cooling, racks, cloud, AI compute, interconnection, software, services, storage, networking and energy.

Media and Research Contact

DC Market Insights
Email: sales@dcmarketinsights.com
United States: +1 628 262 7656
United Kingdom: +44 7453 598 606
Office: Tower C-1105, S 25, Akash Tower, Vishal Nagar, Pimple Nilakh, Pune, MH 411027, India
Web: www.dcmarketinsights.com

View original content to download multimedia:https://www.prnewswire.co.uk/news-releases/data-center-virtualization-market-to-reach-60-90-billion-by-2035-as-multi-hypervisor-and-kubernetes-native-adoption-reshape-enterprise-infrastructure-302901519.html

Continue Reading

Technology

Gong, Agentforce Sales, and Avoma Named 2026 Conversation Intelligence Champions by Info-Tech Research Group

Published

on

By

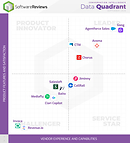
Drawing on verified end-user feedback collected through Info-Tech Research Group’s SoftwareReviews platform, the 2026 Conversation Intelligence Data Quadrant Report evaluates solutions that help organizations capture and analyze customer interactions, reduce manual effort, and improve visibility across teams. Champion recognition reflects strong product capabilities and overall user satisfaction.

ARLINGTON, Va., Oct. 7, 2026 /CNW/ — Info-Tech Research Group has named Gong, Agentforce Sales, and Avoma as Champions in its 2026 Conversation Intelligence Data Quadrant Report. The report recognizes the highest-rated software products in the category, helping organizations evaluate solutions to analyze customer conversations, improve sales coaching, and turn interactions into actionable insights.

Conversation intelligence solutions help organizations capture, transcribe, and analyze customer interactions across calls, meetings, and other communication channels. Features such as automated transcription, call recording, sentiment analysis, conversation summaries, keyword tracking, sales coaching, and CRM integration can help teams identify customer needs, improve employee performance, and make more informed business decisions.

Info-Tech’s Data Quadrant is a comprehensive software evaluation tool that ranks products using verified end-user feedback across key dimensions, including likelihood to recommend, feature rankings, net emotional footprint score, and vendor capabilities. These inputs are aggregated into a Composite Score (CS), which reflects overall user satisfaction and determines placement within the Data Quadrant. The firm’s methodology ensures that rankings are based entirely on authentic user reviews, free from analyst opinions or vendor influence.

The 2026 Conversation Intelligence Champions are as follows:

Gong, 9.0 CS, rated highly for its call recording features.Agentforce Sales, 9.0 CS, rated highly for its conversation coaching capabilities.Avoma, 8.6 CS, ranked highly for its audio transcription features.

“Every customer conversation contains valuable information, but organizations need the right tools to capture and make sense of it,” says Terra Higginson, Principal Research Director at Info-Tech Research Group. “Conversation intelligence platforms can make it easier to review large volumes of interactions and surface relevant information without adding to employee workloads. The best products fit smoothly into existing workflows, provide reliable analysis, reduce manual effort, and are easy for teams to use.”

User assessments of software categories on SoftwareReviews provide an accurate and detailed view of the constantly changing market. Info-Tech’s reports are informed by data from users and IT professionals with intimate experience with the software across the procurement, implementation, and maintenance processes.

Read the full report: 2026 Conversation Intelligence Champions

To learn more about Info-Tech’s Vendor Awards, including how Data Quadrant and Emotional Footprint recognition is determined using verified end-user feedback and the underlying evaluation criteria, visit Info-Tech’s Vendor Awards page, powered by SoftwareReviews.

About Info-Tech Research Group
Info-Tech Research Group is the “get things done” partner for over 30,000 IT, HR, and marketing leaders worldwide. The fastest growing research and advisory firm, Info-Tech enables leaders to make well-informed decisions and transform their organizations through AI, strategic foresight, step-by-step methodologies, practical tools, industry-leading advisory, and training programs. For nearly 30 years, tens of thousands of private and public organizations have trusted Info-Tech to lead their most important initiatives through periods of change and deliver outcomes that truly matter.

To learn more about Info-Tech’s HR research and advisory services, visit McLean & Company, and for data-driven software buying insights and vendor evaluations, visit the firm’s SoftwareReviews platform.

Media professionals can register for unrestricted access to research across IT, HR, and software, as well as hundreds of industry analysts through the firm’s Media Insiders program. To gain access, contact pr@infotech.com.

For information about Info-Tech Research Group or to access the latest research, visit infotech.com and connect via LinkedIn and X.

View original content to download multimedia:https://www.prnewswire.com/news-releases/gong-agentforce-sales-and-avoma-named-2026-conversation-intelligence-champions-by-info-tech-research-group-302901598.html

SOURCE Info-Tech Research Group

Continue Reading

Technology

PUDO Inc. reports FY 2027 second quarter results

Published

on

By

TORONTO, Oct. 7, 2026 /CNW/ — PUDO Inc. (“PUDO” or the “Company”) (CSE:  PDO; OTCQB: PDPTF) today filed its unaudited interim financial results and operational highlights for the three-month period ended August 31, 2026 (“Q2 FY 2027”).

Year over Year

Q2 FY 2027  

Q2 FY 2026  

Change

Revenue from Operations  

$1,401,167

$1,425,505

(1.7 %)

Gross Profit

$518,089

$498,699

3.9 %

Gross Margin

37.0 %

35.0 %

+2.0 pts

Cash Operating Income

$9,743

$16,227

(40.0 %)

“Our second quarter results are reflective of the stability we have seen with our current customer base. We continue to be very excited about the new customer opportunities in front of us.  In particular, we have continued to invest in significant new business opportunities while keeping a focus on managing the operations efficiently.  During the second quarter, we returned to positive cash operating income and delivered a very strong gross margin of 37%.”

A complete copy of the unaudited interim consolidated financial statements and the Management’s Discussion and Analysis Report for the three and six month periods ended August 31, 2026, can be found on the CSE website at https://thecse.com/listings/pudo-inc/ and on SEDAR+ at http://www.sedarplus.com/ .

About PUDO Inc.

PUDO Inc. is North America’s only independent parcel pick-up and drop-off counter network. 

PUDO has created a Network of more than 2,088 storefront partners known as PUDOpoint Counters, strategically located very near to where people live, work and play.

PUDO partners with retailers and logistics providers to offer a last-mile pick-up and returns network for ecommerce shoppers that reduces cost, increases convenience and provides package security to the last-mile of package logistics.  Visit: www.pudopoint.com.

To sign up for the PUDO News Feed please subscribe at https://pudopoint.com/investors/ . 

Information in this press release that is not current or historical factual information may constitute forward-looking information within the meaning of securities laws, such as statements regarding estimated revenues from new contracts, increased parcel volume, activation and implementation of PUDO’s technology and possible future expansions of PUDO’s operations. This information is based on current expectations and assumptions of management, including assumptions concerning PUDO’s ability to integrate its new customers into its network and successfully execute on its new and existing contracts. The use of any of the words “anticipate”, “believe”, “expect”, “plan”, “intend”, “can”, “will”, “should”, and similar expressions are intended to identify forward-looking statements. Since forward-looking statements are based on assumptions and address future events and conditions, by their very nature they involve inherent risks and uncertainties. Risks, uncertainties, and other factors involved with forward-looking information could cause actual events, results, performance, prospects, and opportunities to differ materially from those expressed or implied by such forward-looking information. Although the Company believes that the expectations and assumptions on which the forward-looking statements are based are reasonable, undue reliance should not be placed on the forward-looking statements because the Company can give no assurance that they will prove to be correct. Factors that could cause actual results to differ materially from such forward-looking information include, without limitation, uncertainties with respect to service implementation, the economic results of the relationship on the operations of the Company, changes in general economic, market, or business conditions, and those risks set out in the Company’s public documents filed on SEDAR. This press release, in particular the information in respect of estimated revenues, may contain future-oriented financial information or financial outlook within the meaning of applicable securities laws. Such future-oriented financial information or financial outlook has been prepared for the purpose of providing information about management’s reasonable expectations as to the anticipated results of its proposed business activities. Readers are cautioned that reliance on such information may not be appropriate for other purposes.

The forward-looking statements contained in this press release are made as of the date hereof and the Company undertakes no obligation to update publicly or revise any forward-looking statements or information, whether as a result of new information, future events or otherwise, unless so required by law.

SOURCE PUDO Inc.

Continue Reading

Technology

Flex Announces Date for Second Quarter Fiscal Year 2027 Earnings Call

Published

on

By

AUSTIN, Texas, Oct. 7, 2026 /PRNewswire/ — Flex (NASDAQ: FLEX) will announce its second quarter fiscal year 2027 financial results before the market opens on Wednesday, October 28, 2026. The company will hold a conference call to discuss the results that day at 7:30 AM CT / 8:30 AM ET.

The live webcast presentation will be available on the Flex investor relations website at investors.flex.com. A replay of the webcast, along with supporting materials, will be available on the investor relations website following the conclusion of the event.

About Flex
Flex (Reg. No. 199002645H) is the manufacturing partner of choice that helps leading brands design, build, and manage products that improve the world. With a global footprint spanning 30 countries, Flex delivers advanced manufacturing and supply chain solutions, innovative products and technology, and lifecycle services that support customers from concept to scale. In the AI era, Flex is helping customers accelerate data center deployment by solving power, heat, and scale challenges through cutting-edge power and cooling technology and scalable IT infrastructure solutions.

Media, Investors, & Analysts
Michelle Simmons
Senior Vice President, Global Investor Relations and Public Relations
(669) 242-6332
Michelle.Simmons@flex.com 


View original content to download multimedia:https://www.prnewswire.com/news-releases/flex-announces-date-for-second-quarter-fiscal-year-2027-earnings-call-302900757.html

SOURCE Flex

Continue Reading

Trending