
Technology
Cogeco announces Q4 2026 financial results

Published
8 hours agoon
By
Ongoing positive year-over-year revenue and adjusted EBITDA performance in Canada, along with a re-acceleration of Canadian Internet subscriber growthNew TV streaming solution launched for the U.S.Entering the third year of our transformation program, focused on revenue generation opportunities and cost efficienciesIntroducing fiscal 2027 financial guidelinesIncreasing quarterly dividend by 2% to $1.007 per share, representing our 23rd consecutive year of dividend growth
MONTREAL, Oct. 28, 2026 /CNW/ — Today, Cogeco Inc. (TSX: CGO) (“Cogeco” or the “Corporation”) announced its financial results for the fourth quarter ended August 31, 2026 and is issuing its fiscal 2027 financial guidelines.
“Our Canadian business continued to perform in the quarter, with a re-acceleration of our Internet subscriber growth and year-on-year adjusted EBITDA growth for a fourth consecutive quarter”, said Frédéric Perron, President and CEO. “We are particularly pleased with our wireless and oxio sales, and see promising growth potential in both areas”, continued Mr. Perron.
“In the U.S., we continue to operate in a challenging competitive environment, resulting in elevated customer losses in the quarter. To help offset these headwinds, we are focusing on several initiatives to improve our performance in the U.S., including wireless, our new welo digital brand, a new TV streaming product and new sales channels.
“At Cogeco Media, we are pleased with our strong radio audience engagement which reached 4.6 million listeners per week.
“Building on the good progress made in our transformation program, the third year will focus on revenue generation and cost efficiencies, supported by AI and digital initiatives.”
Consolidated financial highlights
Three months ended August 31
2026
2025
Change
Change in
constant
currency
(1)
(In thousands of Canadian dollars, except % and per share data) (unaudited)
$
$
%
%
Revenue
713,887
731,367
(2.4)
(3.3)
Adjusted EBITDA (1)
342,283
357,084
(4.1)
(5.0)
Profit for the period
81,508
76,197
7.0
Profit for the period attributable to owners of the Corporation
18,003
16,483
9.2
Adjusted profit attributable to owners of the Corporation (1)(2)
19,643
20,491
(4.1)
Cash flows from operating activities
361,300
266,738
35.5
Free cash flow (1)
98,397
101,596
(3.1)
(3.6)
Free cash flow, excluding network expansion projects (1)
125,228
159,414
(21.4)
(21.9)
Acquisition of property, plant and equipment
163,118
159,222
2.4
Net capital expenditures (1)(3)
162,930
155,871
4.5
3.5
Net capital expenditures, excluding network expansion projects (1)
136,099
98,053
38.8
37.3
Diluted earnings per share
1.87
1.71
9.4
Adjusted diluted earnings per share (1)(2)
2.04
2.12
(3.8)
Operating results
For the fourth quarter of fiscal 2026 ended on August 31, 2026:
Revenue decreased by 2.4% to $713.9 million. On a constant currency basis(1), revenue decreased by 3.3% due to a decline in the American telecommunications segment and in the media activities, offset in part by revenue growth in the Canadian telecommunications segment, as explained below:American telecommunications’ revenue decreased by 4.6%, or 6.6% in constant currency, mainly due to a lower subscriber base compared to the previous year, and to a higher proportion of customers subscribing to Internet-only services, as well as a competitive environment.Revenue in the media activities decreased by 18.9%, as the traditional radio advertising market remains challenging.Canadian telecommunications’ revenue increased by 0.6%, mainly resulting from the cumulative effect of high-speed Internet service additions over the past year, offset in part by a decline in video and wireline phone service subscribers, as an increasing proportion of customers subscribe to Internet-only services, as well as a competitive environment.Adjusted EBITDA decreased by 4.1% to $342.3 million. On a constant currency basis, adjusted EBITDA decreased by 5.0%, mainly due to lower revenue in the American telecommunications segment, offset in part by cost reduction initiatives and operating efficiencies across the Corporation as a result of its ongoing three-year transformation program.American telecommunications’ adjusted EBITDA decreased by 7.7%, or 9.6% in constant currency.Canadian telecommunications’ adjusted EBITDA increased by 3.3%(4), or 3.4%(4) in constant currency.Profit for the period amounted to $81.5 million, of which $18.0 million, or $1.87 per diluted share, was attributable to owners of the Corporation compared to $76.2 million, $16.5 million, and $1.71 per diluted share, respectively, in the comparable period of fiscal 2025. The increases in profit for the period and profit attributable to owners of the Corporation resulted mainly from lower depreciation and amortization expense, financial expense, and restructuring costs related to the Corporation’s transformation initiatives, partly offset by lower adjusted EBITDA, higher income tax expense, and non-cash pre-tax impairment charges of $5.2 million in connection with asset write-offs following a change in strategy.Excluding the non-cash impairment charges and certain other elements, adjusted profit attributable to owners of the Corporation(2) was $19.6 million, or $2.04 per diluted share(2), a decrease compared to $20.5 million, or $2.12 per diluted share, last year.Net capital expenditures were $162.9 million, an increase of 4.5% compared to $155.9 million in the same period of the prior year. In constant currency, net capital expenditures(1) were $161.3 million, an increase of 3.5% compared to last year, mainly due to higher capital spending related to customer premise equipment, partly offset by the timing of certain initiatives, both in the Canadian telecommunications segment, while net capital expenditures in the American telecommunications segment remained stable.Net capital expenditures in connection with network expansion projects were $26.8 million, or $26.7 million in constant currency(1), compared to $57.8 million in the same period of the prior year. Excluding network expansion projects, net capital expenditures were $136.1 million, an increase of 38.8% compared to $98.1 million in the same period of the prior year. In constant currency, net capital expenditures, excluding network expansion projects(1) were $134.6 million, an increase of 37.3% compared to last year.Acquisition of property, plant and equipment increased by 2.4% to $163.1 million, mainly resulting from higher capital spending.Free cash flow decreased by 3.1%, or 3.6% in constant currency, and amounted to $98.4 million, or $97.9 million in constant currency(1), mainly due to lower adjusted EBITDA, higher net capital expenditures, and higher current income taxes, partly offset by lower acquisition, integration, restructuring and other costs, mostly due to lower restructuring costs related to the Corporation’s transformation initiatives, lower financial expense, and higher proceeds from disposals of property, plant and equipment. Free cash flow, excluding network expansion projects, decreased by 21.4%, or 21.9% in constant currency, and amounted to $125.2 million, or $124.6 million in constant currency.Cash flows from operating activities increased by 35.5% to $361.3 million, mostly due to higher cash inflows from working capital, primarily due to the timing of payments made to suppliers and the collection of trade and other receivables.At its October 28, 2026 meeting, the Board of Directors of Cogeco declared a quarterly dividend of $1.007 per share, an increase of 2.0% compared to $0.987 per share last year.
Fiscal 2027 financial guidelines
Cogeco is issuing its fiscal 2027 financial guidelines, as presented below. As we enter the third year of our transformation program, we will focus on revenue generation and cost efficiencies, supported by AI and digital initiatives.
On a constant currency basis, the Corporation expects fiscal 2027 revenue to decrease by a low to mid single digit percentage, reflecting a combination of growth in the Canadian customer base, offset by pricing pressures and subscriber losses in the U.S. due to a highly competitive and promotional market. On a constant currency basis, fiscal 2027 adjusted EBITDA is expected to decrease by a mid to high single digit percentage, due to lower revenue, partly offset by transformation-driven cost efficiencies.
We expect a lower level of capital expenditures than the previous year, ranging from $430 to $480 million. The reduction results from operational efficiencies and the near completion of many network expansion and upgrade projects.
On a constant currency basis, free cash flow is expected to be between $505 and $555 million, due to lower adjusted EBITDA, higher financial expense and current income tax, partly offset by lower net capital expenditures.
The following table outlines the Corporation’s fiscal 2027 financial guidelines ranges compared to fiscal 2026 actual results, on a constant currency and consolidated basis:
October 28, 2026
Fiscal 2027
financial guidelines
(constant currency)
(i)
Fiscal 2026 actual
(In millions of Canadian dollars, except %)
$
$
Revenue
Low to mid single digit % decline
(ii)
2,887
Adjusted EBITDA
Mid to high single digit % decline
(ii)
1,398
Net capital expenditures
$430 to $480
564
Free cash flow
$505 to $555
(iii)
553
(i)
Financial guidelines are presented on a constant currency basis and are obtained by translating expected financial results denominated in US dollars at the foreign exchange rates of the prior fiscal year. Fiscal 2027 financial guidelines are based on a USD/CAD constant exchange rate of 1.3865 USD/CAD.
(ii)
Compared to fiscal 2026.
(iii)
On a constant currency basis, current income tax expense is assumed to range from $30 to $60 million, while financial expense is assumed to range from $250 to $300 million.
These financial guidelines, including the various assumptions underlying them, contain forward-looking statements concerning the business outlook for Cogeco, and should be read in conjunction with the “Forward-looking statements” section of this press release.
The Corporation presents its fiscal 2027 financial guidelines on a constant currency basis and believes this presentation enables an improved understanding of the Corporation’s underlying financial performance, undistorted by the effects of changes in foreign currency rates. Measures on a constant currency basis are considered non-IFRS Accounting Standards measures and ratios, and do not have any standardized meaning prescribed by IFRS Accounting Standards and therefore, may not be comparable to similar measures presented by other companies. The financial guidelines exclude the impact from possible business acquisitions and/or disposals, and do not take into consideration unusual adjustments that could result from regulatory environment changes (including changes to Internet wholesale rates), and/or unforeseeable legal matters or non-recurring items. Financial expense assumptions do not take into consideration any potential impact of gains/losses on debt modification and/or extinguishment, including on repurchase of debt, if any, as those would be excluded from our free cash flow definition.
(1)
Adjusted EBITDA and net capital expenditures are total of segments measures. Constant currency basis, adjusted profit attributable to owners of the Corporation, net capital expenditures, excluding network expansion projects, free cash flow and free cash flow, excluding network expansion projects are non-IFRS Accounting Standards measures. Change in constant currency and adjusted diluted earnings per share are non-IFRS Accounting Standards ratios. These indicated terms do not have standardized definitions prescribed by IFRS® Accounting Standards, as issued by the International Accounting Standards Board (“IFRS Accounting Standards”) and therefore, may not be comparable to similar measures presented by other companies. For more information on these financial measures, please consult the “Non-IFRS Accounting Standards and other financial measures” section of this press release.
(2)
Excludes the impact of non-cash impairment charges, acquisition, integration, restructuring and other costs, and gains/losses on debt modification and/or extinguishment, which include gains/losses on repurchase of debt (all net of tax and non-controlling interest).
(3)
Net capital expenditures exclude non-cash acquisitions of right-of-use assets and the purchases, and related borrowing costs, of spectrum licences, and are presented net of government subsidies, including the utilization of those received in advance.
(4)
Following a full-scale launch of its Canadian wireless service offering across the majority of its operating footprint in Québec and Ontario during the first quarter of fiscal 2026, the Corporation changed the presentation of its reportable segments by including the Canadian wireless operations within its Canadian telecommunications segment. Cogeco Mobile’s operations were previously included within “Corporate and eliminations” during the start-up phase. Comparative figures were restated to conform to the current presentation.
Financial highlights
Three months and years ended August 31
2026
2025
Change
Change in
constant
currency
(1)
(2)
2026
2025
Change
Change in
constant
currency
(1)
(2)
(In thousands of Canadian dollars, except % and per share data)
$
$
%
%
$
$
%
%
Operations
Revenue
713,887
731,367
(2.4)
(3.3)
2,886,734
3,008,101
(4.0)
(3.7)
Adjusted EBITDA (2)
342,283
357,084
(4.1)
(5.0)
1,398,139
1,452,901
(3.8)
(3.5)
Acquisition, integration, restructuring and other costs (3)
5,158
17,298
(70.2)
15,456
25,290
(38.9)
Impairment of assets
5,196
(132)
—
2,254,622
2,433
—
Profit (loss) for the period
81,508
76,197
7.0
(1,500,962)
335,165
—
Profit (loss) for the period attributable to owners of the Corporation
18,003
16,483
9.2
(340,494)
84,968
—
Adjusted profit attributable to owners of the Corporation (2)(4)
19,643
20,491
(4.1)
98,956
91,187
8.5
Cash flow
Cash flows from operating activities
361,300
266,738
35.5
1,028,274
1,126,848
(8.7)
Free cash flow (2)
98,397
101,596
(3.1)
(3.6)
552,856
514,387
7.5
7.7
Free cash flow, excluding network expansion projects (2)
125,228
159,414
(21.4)
(21.9)
634,071
622,862
1.8
2.0
Acquisition of property, plant and equipment
163,118
159,222
2.4
566,305
599,294
(5.5)
Net capital expenditures (2)(5)
162,930
155,871
4.5
3.5
563,896
591,398
(4.7)
(4.3)
Net capital expenditures, excluding network expansion projects (2)
136,099
98,053
38.8
37.3
482,681
482,923
(0.1)
0.3
Per share data (6)
Earnings (loss) per share
Basic
1.90
1.74
9.2
(35.92)
8.94
—
Diluted (7)
1.87
1.71
9.4
(35.92)
8.81
—
Adjusted diluted (2)(4)(7)
2.04
2.12
(3.8)
10.26
9.46
8.5
Dividends per share
0.987
0.922
7.0
3.948
3.688
7.0
(1)
Key performance indicators presented on a constant currency basis are obtained by translating financial results from the current periods denominated in US dollars at the foreign exchange rates of the comparable periods of the prior year. For the three-month period and year ended August 31, 2025, the average foreign exchange rates used for translation were 1.3722 USD/CAD and 1.3962 USD/CAD, respectively.
(2)
Adjusted EBITDA and net capital expenditures are total of segments measures. Adjusted profit attributable to owners of the Corporation, free cash flow, free cash flow, excluding network expansion projects and net capital expenditures, excluding network expansion projects are non-IFRS Accounting Standards measures. Change in constant currency and adjusted diluted earnings per share are non-IFRS Accounting Standards ratios. These indicated terms do not have standardized definitions prescribed by IFRS Accounting Standards and therefore, may not be comparable to similar measures presented by other companies. For more information on these financial measures, please consult the “Non-IFRS Accounting Standards and other financial measures” section of this press release.
(3)
For the three-month periods and years ended August 31, 2026 and 2025, acquisition, integration, restructuring and other costs were mainly related to additional restructuring costs incurred in connection with the Corporation’s transformation initiatives, and costs associated with the configuration and customization related to cloud computing and other arrangements. In addition, for the year ended August 31, 2025, these costs were partly offset by a $13.8 million non-cash gain recognized during the first quarter of fiscal 2025 in connection with a sale and leaseback transaction.
(4)
Excludes the impact of non-cash impairment charges, acquisition, integration, restructuring and other costs, and gains/losses on debt modification and/or extinguishment, which include gains/losses on repurchase of debt (all net of tax and non-controlling interest).
(5)
Net capital expenditures exclude non-cash acquisitions of right-of-use assets and the purchases, and related borrowing costs, of spectrum licences, and are presented net of government subsidies, including the utilization of those received in advance.
(6)
Per multiple and subordinate voting share.
(7)
For the year ended August 31, 2026, the weighted average number of diluted multiple and subordinate voting shares used for the calculation of the adjusted diluted earnings per share included 168,561 share-based compensation units (comprising incentive share units and performance share units). As for the calculation of the diluted loss per share, these share-based compensation units were deemed to be anti-dilutive due to the loss incurred during the year and therefore were excluded from the calculation.
As at
August 31, 2026
August 31, 2025
(In thousands of Canadian dollars)
$
$
Financial condition
Cash
89,487
75,577
Total assets
7,590,766
9,786,463
Long-term debt
Current
67,851
45,543
Non-current
4,433,895
4,664,731
Net indebtedness (1)
4,448,081
4,685,722
Equity attributable to owners of the Corporation
491,649
862,951
(1)
Net indebtedness is a capital management measure. For more information on this financial measure, please consult the “Non-IFRS Accounting Standards and other financial measures” section of the Corporation’s MD&A for the year ended August 31, 2026, available on SEDAR+ at www.sedarplus.ca.
Forward-looking statements
Certain statements contained in this press release constitute forward-looking information within the meaning of securities laws. Forward-looking information may relate to Cogeco Inc.’s (“Cogeco” or the “Corporation”) future outlook and anticipated events, business, operations, financial performance, financial condition or results and, in some cases, can be identified by terminology such as “may”; “will”; “should”; “expect”; “plan”; “anticipate”; “believe”; “intend”; “estimate”; “predict”; “potential”; “continue”; “foresee”; “ensure” or other similar expressions concerning matters that are not historical facts. Particularly, statements relating to the Corporation’s financial guidelines, future operating results and economic performance, objectives and strategies are forward-looking statements. These statements are based on certain factors and assumptions including expected growth, results of operations, purchase price allocation, tax rates, weighted average cost of capital, performance and business prospects and opportunities, which Cogeco believes are reasonable as of the current date. Refer in particular to the “Corporate objectives and strategy” section of the Corporation’s fiscal 2026 annual Management’s Discussion and Analysis (“MD&A”), and the “Fiscal 2027 financial guidelines” presented in the current press release for a discussion of certain key economic, market and operational assumptions we have made in preparing forward-looking statements. While management considers these assumptions to be reasonable based on information currently available to the Corporation, they may prove to be incorrect. Forward-looking information is also subject to certain factors, including risks and uncertainties that could cause actual results to differ materially from what Cogeco currently expects. These factors include risks such as general market conditions, competitive risks (including changing competitive and technology ecosystems and disruptive competitive strategies adopted by our competitors), business risks, regulatory risks (including changes in laws or government policies and the impact of regulatory decisions, such as those of the Canadian Radio-television and Telecommunications Commission (“CRTC”) in Canada or of the Federal Communications Commission in the U.S.), tax risks, technology risks (including the evolution of technology, the rapid advancement of artificial intelligence technologies, and the threat of cybersecurity), financial risks (including the ability to execute debt refinancings, increasing interest rates and variations in currency), economic conditions (including inflation, trade tariffs, reduced consumer spending and increasing costs), talent management risks (including the highly competitive market for a limited pool of digitally skilled employees), human-caused and natural threats to the Corporation’s network (including increased frequency of extreme weather events, physical sabotage, and deliberate vandalism such as copper theft with the potential to disrupt operations), infrastructure and systems, sustainability and sustainability reporting risks, ethical behavior risks, ownership risks, litigation risks and public health and safety, many of which are beyond the Corporation’s control. Moreover, the Corporation’s radio operations are significantly exposed to advertising budgets from the retail industry, which can fluctuate due to increased competition and changing economic conditions. For more exhaustive information on these risks and uncertainties, the reader should refer to the “Uncertainties and main risk factors” section of the Corporation’s fiscal 2026 annual MD&A. These factors are not intended to represent a complete list of the factors that could affect Cogeco and future events and results may vary significantly from what management currently foresees. If the market value of our assets or if management’s estimates of forecasted results deteriorate, we may be required to recognize material non-cash charges relating to impairment of assets. The reader should not place undue importance on forward-looking information contained in this press release and the forward-looking statements contained in this press release represent Cogeco’s expectations as of the date of this press release (or as of the date they are otherwise stated to be made) and are subject to change after such date. While management may elect to do so, the Corporation is under no obligation (and expressly disclaims any such obligation) and does not undertake to update or alter this information at any particular time, whether as a result of new information, future events or otherwise, except as required by law.
All amounts are stated in Canadian dollars unless otherwise indicated. This press release should be read in conjunction with the MD&A included in the Corporation’s fiscal 2026 Annual Report, the Corporation’s consolidated financial statements and the notes thereto prepared in accordance with IFRS® Accounting Standards as issued by the International Accounting Standards Board (“IFRS Accounting Standards”) for the year ended August 31, 2026.
Non-IFRS Accounting Standards and other financial measures
This press release includes references to non-IFRS Accounting Standards and other financial measures used by Cogeco. These financial measures are reviewed in assessing the performance of Cogeco and used in the decision-making process with regard to its business units.
Reconciliations between non-IFRS Accounting Standards and other financial measures to the most directly comparable IFRS Accounting Standards measures are provided below. Certain additional disclosures for non-IFRS Accounting Standards and other financial measures used in this press release have been incorporated by reference and can be found in the “Non-IFRS Accounting Standards and other financial measures” section of the Corporation’s MD&A for the three-month period and year ended August 31, 2026, available on SEDAR+ at www.sedarplus.ca. The following non-IFRS Accounting Standards measures are used as a component of Cogeco’s non-IFRS Accounting Standards ratios.
Specified non-IFRS Accounting Standards measures
Used in the component of the following non-IFRS Accounting Standards ratios
Adjusted profit attributable to owners of the Corporation
Adjusted diluted earnings per share
Constant currency basis
Change in constant currency
For the three-month period and year ended August 31, 2026, the average foreign exchange rates used for translation were 1.4015 USD/CAD and 1.3865 USD/CAD, respectively. Financial measures presented on a constant currency basis for the three-month period and year ended August 31, 2026 are translated at the average foreign exchange rate of the comparable periods of the prior year, which were 1.3722 USD/CAD and 1.3962 USD/CAD, respectively.
Constant currency basis and foreign exchange impact reconciliation
Consolidated
Three months ended August 31
2026
2025
Change
(In thousands of Canadian dollars, except percentages)
Actual
Foreign
exchange
impact
In
constant
currency
Actual
Actual
In
constant
currency
$
$
$
$
%
%
Revenue
713,887
(6,728)
707,159
731,367
(2.4)
(3.3)
Operating expenses
371,604
(3,705)
367,899
374,283
(0.7)
(1.7)
Adjusted EBITDA
342,283
(3,023)
339,260
357,084
(4.1)
(5.0)
Free cash flow
98,397
(495)
97,902
101,596
(3.1)
(3.6)
Net capital expenditures
162,930
(1,616)
161,314
155,871
4.5
3.5
Years ended August 31
2026
2025
Change
(In thousands of Canadian dollars, except percentages)
Actual
Foreign
exchange
impact
In
constant
currency
Actual
Actual
In
constant
currency
$
$
$
$
%
%
Revenue
2,886,734
9,093
2,895,827
3,008,101
(4.0)
(3.7)
Operating expenses
1,488,595
5,004
1,493,599
1,555,200
(4.3)
(4.0)
Adjusted EBITDA
1,398,139
4,089
1,402,228
1,452,901
(3.8)
(3.5)
Free cash flow
552,856
1,074
553,930
514,387
7.5
7.7
Net capital expenditures
563,896
1,809
565,705
591,398
(4.7)
(4.3)
Canadian telecommunications segment
Three months ended August 31
2026
2025
Change
(In thousands of Canadian dollars, except percentages)
Actual
Foreign
exchange
impact
In
constant
currency
Actual
(1)
Actual
In
constant
currency
$
$
$
$
%
%
Revenue
375,045
—
375,045
372,931
0.6
0.6
Operating expenses
172,243
(274)
171,969
176,569
(2.5)
(2.6)
Adjusted EBITDA
202,802
274
203,076
196,362
3.3
3.4
Net capital expenditures
94,386
(284)
94,102
87,979
7.3
7.0
(1)
Effective as of the first quarter of fiscal 2026, the Canadian telecommunications segment includes the Canadian wireless operations, which were previously included within “Corporate and eliminations” during the start-up phase. Comparative figures were restated to conform to the current presentation, including $3.8 million of operating expenses for the fourth quarter of fiscal 2025, which were reclassified from “Corporate and eliminations” to the Canadian telecommunications segment.
Years ended August 31
2026
2025
Change
(In thousands of Canadian dollars, except percentages)
Actual
Foreign
exchange
impact
In
constant
currency
Actual
(1)
Actual
In
constant
currency
$
$
$
$
%
%
Revenue
1,502,128
—
1,502,128
1,495,308
0.5
0.5
Operating expenses
700,123
400
700,523
715,494
(2.1)
(2.1)
Adjusted EBITDA
802,005
(400)
801,605
779,814
2.8
2.8
Net capital expenditures
339,715
701
340,416
310,233
9.5
9.7
(1)
Effective as of the first quarter of fiscal 2026, the Canadian telecommunications segment includes the Canadian wireless operations, which were previously included within “Corporate and eliminations” during the start-up phase. Comparative figures were restated to conform to the current presentation, including $10.9 million of operating expenses for fiscal 2025, which were reclassified from “Corporate and eliminations” to the Canadian telecommunications segment.
American telecommunications segment
Three months ended August 31
2026
2025
Change
(In thousands of Canadian dollars, except percentages)
Actual
Foreign
exchange
impact
In
constant
currency
Actual
Actual
In
constant
currency
$
$
$
$
%
%
Revenue
320,445
(6,728)
313,717
335,762
(4.6)
(6.6)
Operating expenses
164,049
(3,427)
160,622
166,327
(1.4)
(3.4)
Adjusted EBITDA
156,396
(3,301)
153,095
169,435
(7.7)
(9.6)
Net capital expenditures
67,304
(1,332)
65,972
66,295
1.5
(0.5)
Years ended August 31
2026
2025
Change
(In thousands of Canadian dollars, except percentages)
Actual
Foreign
exchange
impact
In
constant
currency
Actual
Actual
In
constant
currency
$
$
$
$
%
%
Revenue
1,290,850
9,093
1,299,943
1,415,185
(8.8)
(8.1)
Operating expenses
652,860
4,606
657,466
711,775
(8.3)
(7.6)
Adjusted EBITDA
637,990
4,487
642,477
703,410
(9.3)
(8.7)
Net capital expenditures
221,569
1,108
222,677
278,036
(20.3)
(19.9)
Adjusted profit attributable to owners of the Corporation
Three months ended August 31
Years ended August 31
2026
2025
2026
2025
(In thousands of Canadian dollars)
$
$
$
$
Profit (loss) for the period attributable to owners of the Corporation
18,003
16,483
(340,494)
84,968
Acquisition, integration, restructuring and other costs
5,158
17,298
15,456
25,290
Impairment of assets
5,196
(132)
2,254,622
2,433
Gain on repurchase of debt (1)
(4,289)
—
(7,187)
—
Tax impact for the above items
(1,639)
(4,239)
(387,115)
(8,814)
Non-controlling interest impact for the above items
(2,786)
(8,919)
(1,436,326)
(12,690)
Adjusted profit attributable to owners of the Corporation
19,643
20,491
98,956
91,187
(1)
Included within financial expense.
Free cash flow and free cash flow, excluding network expansion projects reconciliations
Three months ended August 31
Years ended August 31
2026
2025
2026
2025
(In thousands of Canadian dollars)
$
$
$
$
Cash flows from operating activities
361,300
266,738
1,028,274
1,126,848
Changes in other non-cash operating activities
(98,739)
(8,190)
43,399
(1,640)
Income taxes paid
2,931
5,669
63,363
15,451
Current income taxes
(16,152)
(11,861)
(32,391)
(47,743)
Interest paid
74,128
77,297
259,286
277,573
Financial expense
(58,668)
(71,506)
(239,970)
(282,533)
Gain on repurchase of debt (1)
(4,289)
—
(7,187)
—
Amortization of deferred transaction costs and discounts on long-term debt (1)
2,728
2,614
10,820
9,117
Net capital expenditures (2)
(162,930)
(155,871)
(563,896)
(591,398)
Proceeds from disposals of property, plant and equipment, including sale and leaseback transactions
2,920
606
8,514
23,347
Repayment of lease liabilities
(4,832)
(3,900)
(17,356)
(14,635)
Free cash flow
98,397
101,596
552,856
514,387
Net capital expenditures in connection with network expansion projects
26,831
57,818
81,215
108,475
Free cash flow, excluding network expansion projects
125,228
159,414
634,071
622,862
(1)
Included within financial expense.
(2)
Net capital expenditures exclude non-cash acquisitions of right-of-use assets and the purchases, and related borrowing costs, of spectrum licences, and are presented net of government subsidies, including the utilization of those received in advance.
Adjusted EBITDA reconciliation
Three months ended August 31
Years ended August 31
2026
2025
2026
2025
(In thousands of Canadian dollars)
$
$
$
$
Profit (loss) for the period
81,508
76,197
(1,500,962)
335,165
Income taxes
30,764
17,274
(272,969)
87,545
Financial expense
58,668
71,506
239,970
282,533
Impairment of assets
5,196
(132)
2,254,622
2,433
Depreciation and amortization
160,989
174,941
662,022
719,935
Acquisition, integration, restructuring and other costs
5,158
17,298
15,456
25,290
Adjusted EBITDA
342,283
357,084
1,398,139
1,452,901
Net capital expenditures and net capital expenditures, excluding network expansion projects reconciliations
Three months ended August 31
2026
2025
Change
Actual
Foreign
exchange
impact
In
constant
currency
Actual
Actual
In
constant
currency
(In thousands of Canadian dollars, except percentages)
$
$
$
$
%
%
Acquisition of property, plant and equipment
163,118
159,222
2.4
Subsidies received in advance recognized as a reduction of the cost of property, plant and equipment during the period
(188)
(3,351)
(94.4)
Net capital expenditures
162,930
(1,616)
161,314
155,871
4.5
3.5
Net capital expenditures in connection with network expansion projects
26,831
(155)
26,676
57,818
(53.6)
(53.9)
Net capital expenditures, excluding network expansion projects
136,099
(1,461)
134,638
98,053
38.8
37.3
Years ended August 31
2026
2025
Change
Actual
Foreign
exchange
impact
In
constant
currency
Actual
Actual
In
constant
currency
(In thousands of Canadian dollars, except percentages)
$
$
$
$
%
%
Acquisition of property, plant and equipment
566,305
599,294
(5.5)
Subsidies received in advance recognized as a reduction of the cost of property, plant and equipment during the period
(2,409)
(7,896)
(69.5)
Net capital expenditures
563,896
1,809
565,705
591,398
(4.7)
(4.3)
Net capital expenditures in connection with network expansion projects
81,215
111
81,326
108,475
(25.1)
(25.0)
Net capital expenditures, excluding network expansion projects
482,681
1,698
484,379
482,923
(0.1)
0.3
Free cash flow, excluding network expansion projects reconciliations
Three months ended August 31
2026
2025
Change
(In thousands of Canadian dollars, except percentages)
Actual
Foreign
exchange
impact
In
constant
currency
Actual
Actual
In
constant
currency
$
$
$
$
%
%
Free cash flow
98,397
(495)
97,902
101,596
(3.1)
(3.6)
Net capital expenditures in connection with network expansion projects
26,831
(155)
26,676
57,818
(53.6)
(53.9)
Free cash flow, excluding network expansion projects
125,228
(650)
124,578
159,414
(21.4)
(21.9)
Years ended August 31
2026
2025
Change
(In thousands of Canadian dollars, except percentages)
Actual
Foreign
exchange
impact
In
constant
currency
Actual
Actual
In
constant
currency
$
$
$
$
%
%
Free cash flow
552,856
1,074
553,930
514,387
7.5
7.7
Net capital expenditures in connection with network expansion projects
81,215
111
81,326
108,475
(25.1)
(25.0)
Free cash flow, excluding network expansion projects
634,071
1,185
635,256
622,862
1.8
2.0
Additional information
Additional information relating to the Corporation, including its Annual Information Form, is available on SEDAR+ at www.sedarplus.ca and on the Corporation’s website at corpo.cogeco.com.
About Cogeco Inc.
Cogeco Inc. is a North American leader in the telecommunications and media sectors. Through Cogeco Communications Inc., we provide world-class Internet, wireless, video and wireline phone services to 1.6 million residential and business subscribers in Canada and thirteen states in the United States. Through Cogeco Media, we operate 21 radio stations in Canada, primarily in the province of Québec, as well as a news agency. We take pride in our strong presence in the communities we serve and in our commitment to a sustainable future. Both Cogeco Inc.’s and Cogeco Communications Inc.’s subordinate voting shares are listed on the Toronto Stock Exchange (TSX: CGO and CCA).
For information:
Investors
Troy Crandall
Head, Investor Relations
Cogeco Inc.
Tel.: 514 764-4600
troy.crandall@cogeco.com
Media
Isabelle Famery
Manager, External Communications
Cogeco Inc.
Tel.: 514 764-4600
media@cogeco.com
Conference Call:
Thursday, October 29, 2026 at 8:00 a.m. (Eastern Daylight Time)
A live audio webcast of the analyst call will be available on both the Investor Relations and the Events and Presentations pages of Cogeco’s website. Financial analysts will be able to access the live conference call and ask questions. Media representatives may attend as listeners only. A recording of the conference call will be available on Cogeco’s website for a three-month period.
Please use the following dial-in number to access the conference call 5 to 10 minutes before the start of the conference:
Local – Toronto: 1 289-514-5100
Toll Free – North America: 1 800-717-1738
To join this conference call, participants are required to provide the operator with the name of the company hosting the call, that is, Cogeco Inc. or Cogeco Communications Inc.
SOURCE Cogeco Inc.

You may like
Technology
Can AI care for us? CNN’s Innovate explores the new frontier of tech in the care sector
Published
11 minutes agoon
October 29, 2026By

HONG KONG, Oct. 29, 2026 /PRNewswire/ — While artificial intelligence continues to dominate global headlines amid fierce debates over the future of human jobs, a quiet revolution is happening in the United States in the homes of 73-year-old Dee Humphrey and Parkinson’s patient Jerry Feldman — where tech innovations could usher in a new model of care for a sector that often suffers from human staff shortages.
In the upcoming episode of Innovate, CNN travels across the United States to profile the breakthrough AI companions and robots that hold the potential of stepping in to help bridge critical gaps in healthcare, companionship, and physical support — exploring whether technology can truly assist without losing essential human connection and judgment.
The show begins in New York State, where senior citizen Dee Humphrey shares her home with ‘ElliQ’, a lamp-like AI companion that chats, plays games and nudges her to exercise or take her medication. Its creator, Intuition Robotics co-founder Dor Skuler, sees it as a way to support an ageing population. Innovate will seek to answer this question: how can a machine offer companionship without replacing human connection?
The program turns next to Cincinnati Children’s Hospital Medical Center, where nurse Desauna Tabor and her colleagues are helping train ‘Rachel’, an AI telephone assistant they say uncovers families’ needs and frees up time at the bedside. For Hippocratic AI co-founder Munjal Shah, whose mother stopped taking medication without anyone following up, the alternative often isn’t a human calling — it’s no call at all. He believes AI can make abundance in caregiving available “for the first time in human history”, provided it knows when to hand over to a person.
Finally, CNN visits Atlanta, where Jerry Feldman, who lives with Parkinson’s, works with Dr Madeleine Hackney to test ‘ZEST-E’, an exercise robot — and helps researchers understand what users actually need. The show also meets Hello Robot CEO Aaron Edsinger, who wants robots to help when human support isn’t available. For Jerry, that means getting medicine or something to eat when he’s alone and movement is difficult.
The world is changing fast, and emerging technologies are driving the transformation. Artificial intelligence, blockchain, and IoT are just a few of the game-changing innovations that are shaping our lives and revolutionizing how we work, learn, live, and entertain ourselves. CNN’s Innovate series tells the stories behind business ideas, technological developments, and entrepreneurial breakthroughs reshaping our world. Told through a compelling multiplatform approach, Innovate will engage audiences with stories of innovative thinkers from all walks of life who are shaping a better, smarter future for all.
Innovate trailers: https://bit.ly/4iakogb
Innovate images: https://bit.ly/4zNEm6u
Airtimes for Innovate:
Saturday, 31st October at 6:30pm HKT
Sunday, 1st November at 9:30am and 4:30pm HKT
Monday, 2nd November at 2:30am HKT
About CNN International
CNN’s portfolio of news and information services is available in seven different languages across all major TV, digital and mobile platforms, reaching more than 379 million households around the globe. CNN International is the number one international TV news channel according to all major media surveys across Europe, the Middle East and Africa, the Asia Pacific region, and Latin America and has a US presence that includes CNNgo. CNN Digital is a leading network for online news, mobile news and social media. CNN is at the forefront of digital innovation and continues to invest heavily in expanding its digital global footprint, with a suite of award-winning digital properties and a range of strategic content partnerships, commercialised through a strong data-driven understanding of audience behaviours. CNN has won multiple prestigious awards around the world for its journalism. Around 1,000 hours of long-form series, documentaries and specials are produced every year by CNNI’s non-news programming division. CNN has 36 editorial offices and more than 1,100 affiliates worldwide through CNN Newsource. CNN International is a division of the Skydance Corporation.
View original content to download multimedia:https://www.prnewswire.com/apac/news-releases/can-ai-care-for-us-cnns-innovate-explores-the-new-frontier-of-tech-in-the-care-sector-302923161.html
SOURCE CNN International
Technology
Can AI care for us? CNN’s Innovate explores the new frontier of tech in the care sector
Published
11 minutes agoon
October 29, 2026By

HONG KONG, Oct. 29, 2026 /PRNewswire/ — While artificial intelligence continues to dominate global headlines amid fierce debates over the future of human jobs, a quiet revolution is happening in the United States in the homes of 73-year-old Dee Humphrey and Parkinson’s patient Jerry Feldman — where tech innovations could usher in a new model of care for a sector that often suffers from human staff shortages.
In the upcoming episode of Innovate, CNN travels across the United States to profile the breakthrough AI companions and robots that hold the potential of stepping in to help bridge critical gaps in healthcare, companionship, and physical support — exploring whether technology can truly assist without losing essential human connection and judgment.
The show begins in New York State, where senior citizen Dee Humphrey shares her home with ‘ElliQ’, a lamp-like AI companion that chats, plays games and nudges her to exercise or take her medication. Its creator, Intuition Robotics co-founder Dor Skuler, sees it as a way to support an ageing population. Innovate will seek to answer this question: how can a machine offer companionship without replacing human connection?
The program turns next to Cincinnati Children’s Hospital Medical Center, where nurse Desauna Tabor and her colleagues are helping train ‘Rachel’, an AI telephone assistant they say uncovers families’ needs and frees up time at the bedside. For Hippocratic AI co-founder Munjal Shah, whose mother stopped taking medication without anyone following up, the alternative often isn’t a human calling — it’s no call at all. He believes AI can make abundance in caregiving available “for the first time in human history”, provided it knows when to hand over to a person.
Finally, CNN visits Atlanta, where Jerry Feldman, who lives with Parkinson’s, works with Dr Madeleine Hackney to test ‘ZEST-E’, an exercise robot — and helps researchers understand what users actually need. The show also meets Hello Robot CEO Aaron Edsinger, who wants robots to help when human support isn’t available. For Jerry, that means getting medicine or something to eat when he’s alone and movement is difficult.
The world is changing fast, and emerging technologies are driving the transformation. Artificial intelligence, blockchain, and IoT are just a few of the game-changing innovations that are shaping our lives and revolutionizing how we work, learn, live, and entertain ourselves. CNN’s Innovate series tells the stories behind business ideas, technological developments, and entrepreneurial breakthroughs reshaping our world. Told through a compelling multiplatform approach, Innovate will engage audiences with stories of innovative thinkers from all walks of life who are shaping a better, smarter future for all.
Innovate trailers: https://bit.ly/4iakogb
Innovate images: https://bit.ly/4zNEm6u
Airtimes for Innovate:
Saturday, 31st October at 6:30pm HKT
Sunday, 1st November at 9:30am and 4:30pm HKT
Monday, 2nd November at 2:30am HKT
About CNN International
CNN’s portfolio of news and information services is available in seven different languages across all major TV, digital and mobile platforms, reaching more than 379 million households around the globe. CNN International is the number one international TV news channel according to all major media surveys across Europe, the Middle East and Africa, the Asia Pacific region, and Latin America and has a US presence that includes CNNgo. CNN Digital is a leading network for online news, mobile news and social media. CNN is at the forefront of digital innovation and continues to invest heavily in expanding its digital global footprint, with a suite of award-winning digital properties and a range of strategic content partnerships, commercialised through a strong data-driven understanding of audience behaviours. CNN has won multiple prestigious awards around the world for its journalism. Around 1,000 hours of long-form series, documentaries and specials are produced every year by CNNI’s non-news programming division. CNN has 36 editorial offices and more than 1,100 affiliates worldwide through CNN Newsource. CNN International is a division of the Skydance Corporation.
View original content to download multimedia:https://www.prnewswire.com/apac/news-releases/can-ai-care-for-us-cnns-innovate-explores-the-new-frontier-of-tech-in-the-care-sector-302923161.html
SOURCE CNN International
Technology
xTool Officially Launches X1: An Upgradable Multi-Laser Platform Engineered for Speed, Versatility, and Business Growth
Published
11 minutes agoon
October 29, 2026By
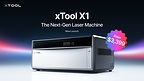
Moving beyond traditional wattage wars, xTool’s new flagship platform combines high-speed Galvo with large-format Gantry motion, introducing modular LaserSwap™ technology and Automated Creation System™ (ACS™) to redefine desktop digital fabrication.
MOUNTAIN VIEW, Calif., Oct. 29, 2026 /PRNewswire/ — xTool, a global pioneer in digital fabrication solutions, today announced the official worldwide availability and immediate shipping of the xTool X1, the industry’s first future-proof, continuously upgradable smart flagship laser engraver and cutter. Built to bridge the gap between industrial-grade capabilities and desktop accessibility, the xTool X1 solves hundreds of complex engineering challenges to deliver an all-in-one productivity engine for small businesses, 3D printing enthusiasts, and woodworking makers alike.
Beyond the Wattage Wars: A Leap in Motion Architecture
For years, the desktop laser industry has been locked in a race toward higher wattage without addressing fundamental workflow constraints. The xTool X1 fundamentally shifts this narrative by proving that the next frontier of laser technology lies in motion architecture rather than simple power upgrades.
By seamlessly integrating a high-speed Flying-Galvo system with a large-format Dragon-Gantry workspace, the X1 eliminates the age-old compromise between engraving speed and working area. Driving two distinct motion systems through a synchronized 4-axis linkage, the X1 achieves ultra-fast galvo processing without sacrificing the broad spatial range required for large-scale production.
To guarantee rock-solid precision under extreme operational speeds, xTool engineered the X1 using a 4,000-ton industrial UniCast high-pressure die-cast aluminum frame. This rigid structural foundation, combined with advanced software feathering algorithms, completely eliminates micro-vibrations and visual seam boundaries, ensuring flawless optical alignment across both flat and 3D surfaces.
“Users see a seamless ‘Place & Go’ experience on the surface, but under the hood, the X1 solves hundreds of optical, algorithmic, and mechanical variables,” said Jessie Liu, President of xTool. “The future of desktop fabrication is not about replacing machines every time your business expands; it’s about system-level upgrades. X1’s true strength isn’t just a single laser beam—it’s the ability to make multiple laser sources work together in perfect harmony.”
LaserSwap™ and Automated ACS™: True System-Level Upgradability
At the heart of the X1 platform is the proprietary LaserSwap™ modular ecosystem. Starting with a high-capacity 55W CO2 module or a hybrid 55W CO2 / 20W Diode setup, users can effortlessly expand their capabilities through quick-connect “backpack” laser modules. The system supports optional 30W Fiber, 60W MOPA, and 5W UV lasers, enabling users to perform deep metal engraving, vibrant color marking, and delicate non-thermal surface processing without buying standalone machines.
Complementing its multi-laser capability, the X1 introduces the Automated Creation System™ (ACS™) to put laser processing on autopilot. Delivering an unprecedented “Place & Go” workflow, ACS™ combines an integrated triple-camera system that pinpoints material positioning with sub-millimeter precision, and an AutoLift Base that automatically adjusts bed height. This hands-off automation eliminates guesswork, manual setup, and tedious focusing, drastically elevating creator productivity.
Unlocking New Workflows Across Communities
The xTool X1 is specifically designed to overcome material limits and unlock new commercial opportunities across diverse creative sectors:
The Ultimate Companion for 3D Printing: While 3D printers excel at complex volumetric geometries, they struggle with structural paneling and fast production. The X1 serves as the perfect companion machine, cutting rigid structural components in wood, acrylic, or leather, while applying high-resolution UV or laser marking directly onto PLA and resin models. A High-ROI Growth Engine for SMBs: Designed for home decor studios, signage makers, and custom gift shops, the X1 operates as an efficient “one-person factory”. Its rapid batch-engraving speeds and multi-material versatility drastically reduce production lead times, allowing small businesses to expand their product SKUs and achieve rapid return on investment. Empowering Woodworking & DIY Makers: For artisanal woodworkers, the X1 seamlessly merges natural materials with precise metal accents. From customized home and garden decor to intricate woodworking projects, the platform handles mixed-material crafting with effortless consistency.
Technical Difficulty: Laser Innovation vs. 3D Printing
Developing the X1 required overcoming engineering hurdles that far surpass conventional digital tools. While 3D printing primarily manages material extrusion and thermal dynamics, multi-laser hybrid platforms demand extreme optical precision, real-time light path alignment, multi-axis motion synchronization, and complex blending algorithms. The X1’s success establishes xTool’s undeniable technical leadership in mastering these industrial-grade challenges for the desktop market.
Pricing and Availability
The xTool X1 is available for purchase starting today on the official xTool online store, featuring limited-time launch pricing across multiple configurations:
X1 Single CO2 (55W CO2): $3,399X1 CO2 + Diode Galvo (55W CO2 + 20W Diode Galvo Module): $3,999X1 CO2 + Diode Galvo + Fiber (Includes 30W Fiber Laser Source): $5,799X1 CO2 + Diode Galvo + UV (Includes 5W UV Laser Source): $6,499X1 CO2 + Diode Galvo + MOPA (Includes 60W MOPA Laser Source): $6,679
To learn more about the xTool X1, explore detailed technical specifications, or place an order, please visit: xtool.com.
About xTool
xTool is a global premium consumer-tech brand dedicated to empowering digital-to-physical creation. As the world’s largest and fastest-growing laser engraver innovator, xTool provides a comprehensive ecosystem of laser-based personal creative tools, material printers, user-friendly software, accessories, and consumables. Through these innovations, xTool empowers creators to turn imagination into meaningful creations that deliver emotional fulfillment, commercial success, and personal achievement. Discover more at xtool.com.
View original content to download multimedia:https://www.prnewswire.com/news-releases/xtool-officially-launches-x1-an-upgradable-multi-laser-platform-engineered-for-speed-versatility-and-business-growth-302923167.html
SOURCE xTool


Can AI care for us? CNN’s Innovate explores the new frontier of tech in the care sector

Can AI care for us? CNN’s Innovate explores the new frontier of tech in the care sector

xTool Officially Launches X1: An Upgradable Multi-Laser Platform Engineered for Speed, Versatility, and Business Growth

Send Rakhi to UK swiftly with UK Gifts Portal

Whiteboard Series with NEAR | Ep: 45 Joel Thorstensson from ceramic.network

Nullmax and Renesas Forge Strategic Partnership to Deliver Competitive ADAS Solutions for the Global Market

Why You Should Build on #NEAR – Co-founder Illia Polosukhin at CV Labs
Whiteboard Series with NEAR | Ep: 45 Joel Thorstensson from ceramic.network

NEAR End of Year Town Hall 2021: The Open Web World, MetaBUILD 2 Hackathon and 2021 recap
Trending
-

 Near Videos3 days ago
NEAR is building a universal liquidity layer.
-

 Technology4 days ago
ST Engineering iDirect and MBSat Partner to Build Next-Generation Sovereign Connectivity Services Across Oman and the Middle East
-

 Technology4 days ago
ST Engineering iDirect and MBSat Partner to Build Next-Generation Sovereign Connectivity Services Across Oman and the Middle East
-

 Technology4 days ago
Beyond GRC: DigitalXForce Pioneers AI-Powered Risk Operations with Global X-ROC™ Rollout
-

 Technology5 days ago
Axon Announces Body 5: Next-Generation Camera Built for the AI Era
-

 Technology3 days ago
Tin Men Capital leads US$7.4M Series A for Vision AI startup Ailytics to expand across APAC, US and Gulf
-

 Technology3 days ago
OASE+ and Elsevier Agree Next-Phase Read and Publish Agreement to Expand Open Access Publishing in Japan
-

 Technology2 days ago
TrueLoyal® Appoints Erica Thompson as Head of Loyalty