TEMPE, Ariz. and PRAGUE, Oct. 28, 2026 /PRNewswire/ — Gen Digital Inc. (NASDAQ: GEN), a global leader dedicated to powering Digital Freedom, released its results for its second quarter fiscal year 2027, which ended October 2, 2026.
“We delivered our sixth consecutive quarter of double-digit bookings growth,” said Vincent Pilette, CEO of Gen. “We reached a record high customer count, alongside strong product engagement and retention. Innovation across our brands and continued investment in our platform are resonating with consumers. We’re building on that momentum to expand how we help people protect and manage their digital and financial lives in an increasingly agentic AI world.”
Q2 Fiscal Year 2027 Financial Highlights
Q2 GAAP Results
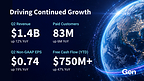
Revenue of $1.369 billion, up 12% Operating income of $507 million, up 16%Diluted EPS of $0.48, up 122%Year-to-date operating cash flow of $760 million, up 45%
Q2 Non-GAAP Results
Bookings of $1.347 billion, up 10%Revenue of $1.369 billion, up 12%Operating income of $686 million, up 10%Diluted EPS of $0.74, up 19%Year-to-date free cash flow of $753 million, up 47%
“Our second quarter results reflect the durability of our business model and continued momentum across both segments,” said Natalie Derse, CFO of Gen. “Customer demand is strong, and we remain disciplined about investment, efficiency and profitable growth. That balance gives us the confidence to invest in our highest potential opportunities and raise full-year guidance again. We remain focused on consistent execution and lasting value for customers and shareholders.”
Non-GAAP Q3 Fiscal Year 2027 Guidance
Q3 FY27 Revenue expected to be in the range of $1.365 billion to $1.390 billionQ3 FY27 EPS expected to be in the range of $0.73 to $0.75
Raises Non-GAAP Fiscal Year 2027 Guidance
FY27 Revenue expected to be in the range of $5.465 billion to $5.515 billion, compared to prior guidance of $5.375 billion to $5.475 billionFY27 EPS expected to be in the range of $2.93 to $2.98, compared to prior guidance of $2.87 to $2.97
Quarterly Cash Dividend
Gen’s Board of Directors has approved a regular quarterly cash dividend of $0.125 per common share to be paid on December 9, 2026, to all shareholders of record as of the close of business on November 16, 2026.
Q2 Fiscal Year 2027 Earnings Call
October 28, 2026
2 p.m. PT / 5 p.m. ET
Webcast & Dial-in instructions at Investor.GenDigital.com. A replay will be posted following the call. For additional details regarding Gen’s results and outlook, please see the Financials section of the Investor Relations website at Investor.GenDigital.com.
About Gen
Gen (NASDAQ: GEN) is a global company dedicated to powering Digital Freedom. Through its trusted brands including Norton, Avast, LifeLock, MoneyLion and Engine, Gen helps people protect and take control of their digital and financial lives. As AI reshapes how people discover, decide and transact, Gen is building the security and trust layer to empower people and their agents to navigate digital life more safely. Gen empowers nearly 500 million users in more than 150 countries through its products and services that span cybersecurity, online privacy, identity protection and financial wellness. Learn more at GenDigital.com.
Forward-Looking Statements
This press release contains statements which may be considered forward-looking within the meaning of the U.S. federal securities laws. In some cases, you can identify these forward-looking statements by the use of terms such as “expect,” “will,” “continue,” or similar expressions, and variations or negatives of these words, but the absence of these words does not mean that a statement is not forward-looking. All statements other than statements of historical fact are statements that could be deemed forward-looking statements, including, but not limited to, the quotes under “Q2 Fiscal Year 2027 Financial Highlights” including expectations relating to achievement of long-term objectives, and the statements under “Non-GAAP Q3 Fiscal Year 2027 Guidance” and “Non-GAAP Fiscal Year 2027 Guidance” including expectations relating to Q3 Fiscal Year 2027 and Fiscal Year 2027 non-GAAP revenue and non-GAAP EPS, and any statements of assumptions underlying any of the foregoing. These statements are subject to known and unknown risks, uncertainties and other factors that may cause our actual results, levels of activity, performance or achievements to differ materially from results expressed or implied in this press release. Such risk factors include, but are not limited to, those related to: the consummation of or anticipated impacts of acquisitions (including our ability to achieve synergies and associated cost savings from any such acquisitions); divestitures, restructurings, stock repurchases, financings, debt repayments and investment activities; the outcome or impact of pending litigation, claims or disputes; difficulties in executing the operating model for the consumer Cyber Safety business; lower than anticipated returns from our investments in direct customer acquisition; difficulties in retaining our existing customers and converting existing non-paying customers to paying customers; difficulties and delays in reducing run rate expenses and monetizing underutilized assets; the successful development of new products and upgrades and the degree to which these new products and upgrades gain market acceptance; our ability to maintain our customer and partner relationships; the anticipated growth of certain market segments; fluctuations and volatility in our stock price; our ability to successfully execute strategic plans; the vulnerability of our solutions, systems, websites and data to intentional disruption by third parties; changes to existing accounting pronouncements or taxation rules or practices; and general business and macroeconomic changes in the U.S. and worldwide, including economic recessions, the impact of inflation, fluctuations in foreign currency exchange rates, changes in interest rates or tax rates, and ongoing and new geopolitical conflicts, and other global macroeconomic factors on our operations and financial performance. Additional information concerning these and other risk factors is contained in the Risk Factors sections of our most recent reports on Form 10-K and Form 10-Q. We encourage you to read those sections carefully. There may also be other factors that have not been anticipated or are not described in our periodic filings, generally because we did not believe them to be significant at the time, which could cause actual results to differ materially from our projections and expectations. All forward-looking statements should be evaluated with the understanding of their inherent uncertainty. We assume no obligation, and do not intend, to update these forward-looking statements as a result of future events or developments.
Use of Non-GAAP Financial Information
We use non-GAAP measures of operating margin, operating income, net income and earnings per share, which are adjusted from results based on GAAP and exclude certain expenses, gains and losses. We also provide the non-GAAP metrics of revenues, and constant currency revenues. These non-GAAP financial measures are provided to enhance the user’s understanding of our past financial performance and our prospects for the future, and to provide more meaningful comparisons of our current results to our historical performance by adjusting items that affect comparability between periods. Our management team uses these non-GAAP financial measures in assessing Gen’s performance, as well as in planning and forecasting future periods. These non-GAAP financial measures are not computed according to GAAP and the methods we use to compute them may differ from the methods used by other companies. Non-GAAP financial measures are supplemental, should not be considered a substitute for financial information presented in accordance with GAAP and should be read only in conjunction with our condensed consolidated financial statements prepared in accordance with GAAP. Readers are encouraged to review the reconciliation of our non-GAAP financial measures to the comparable GAAP results, which is attached to our quarterly earnings release, and which can be found, along with other financial information including the Earnings Presentation, on the investor relations page of our website at Investor.GenDigital.com. No reconciliation of the forecasted range for non-GAAP revenues and EPS guidance is included in this release because most non-GAAP adjustments pertain to events that have not yet occurred. It would be unreasonably burdensome to forecast, therefore we are unable to provide an accurate estimate.
GEN DIGITAL INC.
Condensed Consolidated Balance Sheets
(Unaudited, in millions)
October 2, 2026
April 3, 2026
ASSETS
Current assets:
Cash, cash equivalents and restricted cash
$ 589
$ 411
Accounts receivable, net
398
361
Other current assets
295
295
Assets held for sale
16
14
Total current assets
1,298
1,081
Property and equipment, net
69
71
Intangible assets, net
1,927
2,096
Goodwill
10,930
10,996
Deferred income tax assets
1,143
1,153
Other long-term assets
181
192
Total assets
$ 15,548
$ 15,589
LIABILITIES AND STOCKHOLDERS’ EQUITY (DEFICIT)
Current liabilities:
Accounts payable
$ 82
$ 96
Accrued compensation and benefits
79
115
Current portion of long-term debt
1,080
181
Contract liabilities
1,823
1,904
Other current liabilities
417
414
Total current liabilities
3,481
2,710
Long-term debt
7,036
8,015
Long-term contract liabilities
76
73
Deferred income tax liabilities
178
198
Long-term income taxes payable
1,625
1,588
Other long-term liabilities
411
394
Total liabilities
12,807
12,978
Total stockholders’ equity (deficit)
2,741
2,611
Total liabilities and stockholders’ equity (deficit)
$ 15,548
$ 15,589
GEN DIGITAL INC.
Condensed Consolidated Statements of Operations
(Unaudited, in millions, except per share amounts)
Three Months Ended
Six Months Ended
October 2, 2026
October 3, 2025
October 2, 2026
October 3, 2025
Net revenues
$ 1,369
$ 1,220
$ 2,705
$ 2,477
Cost of revenues
330
266
637
533
Gross profit
1,039
954
2,068
1,944
Operating expenses:
Sales and marketing
298
297
598
594
Research and development
112
100
230
209
General and administrative
66
60
146
134
Amortization of intangible assets
56
55
112
109
Restructuring and other costs
—
4
32
14
Total operating expenses
532
516
1,118
1,060
Operating income (loss)
507
438
950
884
Interest expense
(123)
(146)
(247)
(302)
Other income (expense), net
2
(59)
6
(49)
Income (loss) before income taxes
386
233
709
533
Income tax expense (benefit)
99
99
207
264
Net income (loss)
$ 287
$ 134
$ 502
$ 269
Net income (loss) per share – basic
$ 0.48
$ 0.22
$ 0.84
$ 0.44
Net income (loss) per share – diluted
$ 0.48
$ 0.21
$ 0.83
$ 0.43
Weighted-average shares outstanding:
Basic
596
616
598
617
Diluted
603
624
603
624
GEN DIGITAL INC.
Condensed Consolidated Statements of Cash Flows
(Unaudited, in millions)
Three Months Ended
Six Months Ended
October 2, 2026
October 3, 2025
October 2, 2026
October 3, 2025
OPERATING ACTIVITIES:
Net income (loss)
$ 287
$ 134
$ 502
$ 269
Adjustments:
Amortization and depreciation
122
125
245
248
Stock-based compensation expense
56
56
110
122
Loss on sale of Instacash Advances
69
55
129
91
Deferred income taxes
(16)
(17)
(25)
(6)
Loss on sale of property
—
—
—
1
Non-cash operating lease expense
4
5
8
9
Change in fair value and impairment of non-marketable equity
investments
—
69
—
69
Foreign currency remeasurement loss (gain)
(17)
3
(18)
89
Other
14
11
23
21
Changes in operating assets and liabilities, net of acquisitions:
Accounts receivable, net
(21)
(13)
(34)
(3)
Accounts payable
(15)
(9)
(14)
(57)
Accrued compensation and benefits
4
12
(35)
(9)
Contract liabilities
(24)
(3)
(80)
(72)
Income taxes payable
(35)
(225)
40
(164)
Instacash Advances held for sale, net
(45)
(44)
(131)
(91)
Other assets
8
7
5
65
Other liabilities
(65)
(50)
35
(57)
Net cash provided by (used in) operating activities
326
116
760
525
INVESTING ACTIVITIES:
Purchases of property and equipment
(3)
(9)
(7)
(13)
Payments for acquisitions, net of cash acquired
—
—
—
(876)
Payments for originations of notes receivable
(88)
—
(173)
—
Proceeds from principal repayments of notes receivable
81
—
158
—
Proceeds from sale of non-marketable equity investments
—
4
—
4
Proceeds from the sale of property
—
—
—
9
Other
—
(2)
(3)
(4)
Net cash provided by (used in) investing activities
(10)
(7)
(25)
(880)
FINANCING ACTIVITIES:
Repayments of debt
(45)
(169)
(90)
(360)
Proceeds from issuance of debt, net of issuance costs (1)
—
—
—
741
Net proceeds from sales of common stock under employee
stock incentive plans
7
7
7
7
Tax payments related to vesting of stock units
(3)
(3)
(44)
(47)
Dividends and dividend equivalents paid
(76)
(77)
(157)
(159)
Repurchases of common stock
(171)
—
(271)
(134)
Other
(1)
—
(1)
—
Net cash provided by (used in) financing activities
(289)
(242)
(556)
48
Effect of exchange rate fluctuations on cash, cash equivalents
and restricted cash
(2)
6
(1)
2
Change in cash, cash equivalents and restricted cash
25
(127)
178
(305)
Beginning cash, cash equivalents and restricted cash
564
828
411
1,006
Ending cash, cash equivalents and restricted cash
$ 589
$ 701
$ 589
$ 701
_____________________
(1)
Issuance costs paid for issuance of debt for the six months ended October 3, 2025 were $9 million.
GEN DIGITAL INC.
Reconciliation of Selected GAAP Measures to Non-GAAP Measures (1) (2)
(Unaudited, in millions, except per share amounts)
Three Months Ended
October 2, 2026
October 3, 2025
Operating income (loss)
$ 507
$ 438
Stock-based compensation
56
55
Amortization of intangible assets
118
121
Restructuring and other costs
—
4
Acquisition and integration costs
3
2
Litigation costs
2
2
Other
—
1
Operating income (loss) (Non-GAAP)
$ 686
$ 623
Operating margin
37.0 %
35.9 %
Operating margin (Non-GAAP)
50.1 %
51.1 %
Net income (loss)
$ 287
$ 134
Adjustments to net income (loss):
Stock-based compensation
56
55
Amortization of intangible assets
118
121
Restructuring and other costs
—
4
Acquisition and integration costs
3
2
Litigation costs
2
2
Other
—
3
Non-cash interest expense
5
7
Change in fair value and impairment of non-marketable equity investments
—
69
Total adjustments to GAAP income (loss) before income taxes
184
263
Adjustment to GAAP provision for income taxes
(27)
(10)
Total adjustment to income (loss), net of taxes
157
253
Net income (loss) (Non-GAAP)
$ 444
$ 387
Diluted net income (loss) per share
$ 0.48
$ 0.21
Adjustments to diluted net income (loss) per share:
Stock-based compensation
0.09
0.09
Amortization of intangible assets
0.20
0.19
Restructuring and other costs
—
0.01
Acquisition and integration costs
0.00
0.00
Litigation costs
0.00
0.00
Other
—
0.00
Non-cash interest expense
0.01
0.01
Change in fair value and impairment of non-marketable equity investments
—
0.11
Total adjustments to GAAP income (loss) before income taxes
0.31
0.42
Adjustment to GAAP provision for income taxes
(0.04)
(0.02)
Total adjustment to income (loss), net of taxes
0.26
0.41
Diluted net income (loss) per share (Non-GAAP)
$ 0.74
$ 0.62
Diluted weighted-average shares outstanding
603
624
Diluted weighted-average shares outstanding (Non-GAAP)
603
624
Six Months Ended
October 2, 2026
October 3, 2025
Net cash provided by (used in) operating activities
$ 760
$ 525
Adjustments to net cash provided by (used in) operating activities:
Purchases of property and equipment
(7)
(13)
Free cash flow (Non-GAAP)
$ 753
$ 512
__________________________
(1)
This presentation includes non-GAAP measures. Non-GAAP financial measures are supplemental and should not be considered a substitute for financial information presented in accordance with GAAP. For a detailed explanation of these non-GAAP measures, see Appendix A.
(2)
Amounts may not add due to rounding.
GEN DIGITAL INC.
Performance Metrics
(Unaudited, in millions)
Performance Metrics
Three Months Ended
October 2, 2026
October 3, 2025
Cyber Safety Platform
$ 858
$ 814
Trust-Based Solutions
511
406
Total net revenues
$ 1,369
$ 1,220
Direct revenues
$ 1,074
$ 1,010
Partner revenues
295
210
Total net revenues
$ 1,369
$ 1,220
Total bookings
$ 1,347
$ 1,222
As of
October 2, 2026
October 3, 2025
Total paid customers
83
77
GEN DIGITAL INC.
Appendix A
Explanation of Non-GAAP Measures and Other Items
Objective of non-GAAP measures: We believe our presentation of non-GAAP financial measures, when taken together with corresponding GAAP financial measures, provides meaningful supplemental information regarding the Company’s operating performance for the reasons discussed below. Our management team uses these non-GAAP financial measures in assessing our performance, as well as in planning and forecasting future periods. Due to the importance of these measures in managing the business, we use non-GAAP measures in the evaluation of management’s compensation. These non-GAAP financial measures are not computed according to GAAP and the methods we use to compute them may differ from the methods used by other companies. Non-GAAP financial measures are supplemental and should not be considered a substitute for financial information presented in accordance with GAAP and should be read only in conjunction with our consolidated financial statements prepared in accordance with GAAP.
Stock-based compensation: This consists of expenses for employee restricted stock units, performance-based awards, stock options and our employee stock purchase plan, determined in accordance with GAAP. We evaluate our performance both with and without these measures because stock-based compensation is a non-cash expense and can vary significantly over time based on the timing, size, nature and design of the awards granted, and is influenced in part by certain factors that are generally beyond our control, such as the volatility of the market value of our common stock. In addition, for comparability purposes, we believe it is useful to provide a non-GAAP financial measure that excludes stock-based compensation to facilitate the comparison of our results to those of other companies in our industry.
Amortization of intangible assets: Amortization of intangible assets consists of amortization of acquisition-related intangible assets such as developed technology, customer relationships and trade names acquired in connection with business combinations. We record charges relating to the amortization of these intangibles within both cost of revenues and operating expenses in our GAAP financial statements. Under purchase accounting, we are required to allocate a portion of the purchase price to intangible assets acquired and amortize this amount over the estimated useful lives of the acquired intangible assets. However, the purchase price allocated to these assets is not necessarily reflective of the cost we would incur to internally develop the intangible asset. Further, amortization charges for our acquired intangible assets are inconsistent in size and are significantly impacted by the timing and valuation of our acquisitions. We eliminate these charges from our non-GAAP operating results to facilitate an evaluation of our current operating performance and provide better comparability to our past operating performance.
Restructuring and other costs: Restructuring charges are costs associated with a formal restructuring plan and are primarily related to employee severance and benefit arrangements, contract termination costs, and assets write-offs, as well as other exit and disposal costs. Included in other exit and disposal costs are costs to exit and consolidate facilities in connection with restructuring events. We exclude restructuring and other costs from our non-GAAP results as we believe that these costs are incremental to core activities that arise in the ordinary course of our business and do not reflect our current operating performance, and that excluding these charges facilitates a more meaningful evaluation of our current operating performance and comparisons to our past operating performance.
Acquisition-related and integration costs: These represent the transaction and business integration costs related to significant acquisitions that are charged to operating expense in our GAAP financial statements. These costs include incremental expenses incurred to affect these business combinations such as advisory, legal, accounting, valuation, and other professional or consulting fees. We exclude these costs from our non-GAAP results as they have no direct correlation to the operation of our business, and because we believe that the non-GAAP financial measures excluding these costs provide meaningful supplemental information regarding the spending trends of our business. In addition, these costs vary, depending on the size and complexity of the acquisitions, and are not indicative of costs of future acquisitions.
Litigation costs: We may periodically incur charges or benefits related to litigation settlements, legal contingency accruals and third-party legal costs related to certain legal matters. We exclude these charges and benefits when associated with a significant matter because we do not believe they are reflective of ongoing business and operating results.
Non-cash interest expense and amortization of debt issuance costs: In accordance with GAAP, we separately account for the value of the conversion feature on our convertible notes as a debt discount that reflects our assumed non-convertible debt borrowing rates. We amortize the discount and debt issuance costs over the term of the related debt. We exclude the difference between the imputed interest expense, which includes the amortization of the conversion feature and of the issuance costs, and the coupon interest payments. We extinguished our remaining convertible debt on August 15, 2022. During fiscal 2023, we also started amortizing the debt issuance costs associated with our senior credit facilities, which were secured upon close of the acquisition of Avast. We believe that excluding these costs provides meaningful supplemental information regarding the cash cost of our debt instruments and enhances investors’ ability to view the Company’s results from management’s perspective.
Gain (loss) on extinguishment of debt: We record gains or losses on extinguishment of debt. Gains or losses represent the difference between the fair value of the exchange consideration and the carrying value of the liability component of the debt at the date of extinguishment. We exclude the gain or loss on debt extinguishment in our non-GAAP results because they are not reflective of our ongoing business.
Change in fair value and impairment of non-marketable equity investments: We record gains or losses, unrealized and realized, on equity investments in privately-held companies. We exclude the net gains or losses because we do not believe they are reflective of our ongoing business.
Gain (loss) on sale of properties and nonfinancial assets: We periodically recognize gains or losses from the disposition of land, buildings and nonfinancial assets. We exclude such gains or losses because they are not reflective of our ongoing business and operating results.
Income tax effects and adjustments: We use a non-GAAP tax rate that excludes (1) the discrete impacts of changes in tax legislation, (2) most other significant discrete items, (3) unrealized gains or losses from remeasurement of foreign currency denominated deferred tax items and uncertain tax benefits, and (4) the income tax effects of the non-GAAP adjustment to our operating results described above. We believe making these adjustments facilitates a better evaluation of our current operating performance and comparisons to past operating results. Our tax rate is subject to change for a variety of reasons, such as significant changes in the geographic earnings mix due to acquisition and divestiture activities or fundamental tax law changes in major jurisdictions where we operate.
Diluted GAAP and non-GAAP weighted-average shares outstanding: Diluted GAAP and non-GAAP weighted-average shares outstanding are generally the same, except in periods when there is a GAAP loss from continuing operations. In accordance with GAAP, we do not present dilution for GAAP in periods in which there is a loss from continuing operations. However, if there is non-GAAP net income, we present dilution for non-GAAP weighted-average shares outstanding in an amount equal to the dilution that would have been presented had there been GAAP income from continuing operations for the period.
Bookings: Bookings are defined as customer orders received that are expected to generate net revenues in the future. We present the operational metric of bookings because it reflects customers’ demand for our products and services and to assist readers in analyzing our performance in future periods.
Free cash flow: Free cash flow is defined as cash flows from operating activities less purchases of property and equipment. Free cash flow is not a measure of financial condition under GAAP and does not reflect our future contractual commitments and the total increase or decrease of our cash balance for a given period, and thus should not be considered as an alternative to cash flows from operating activities or as a measure of liquidity.
(Unlevered) Free cash flow: Free cash flow is defined as cash flows from operating activities less purchases of property and equipment. Unlevered free cash flow excludes cash interest expense payments, net of payments received through interest rate swap hedges. Free cash flow is not a measure of financial condition under GAAP and does not reflect our future contractual commitments and the total increase or decrease of our cash balance for a given period, and thus should not be considered as an alternative to cash flows from operating activities or as a measure of liquidity.
Cyber Safety Platform: Includes our security and privacy products, as well as our cyber safety comprehensive suites which deliver technology solutions and superior threat protection to help people navigate the digital world, securely, privately and confidently.
Trust-Based Solutions: Trust-Based Solutions includes our identity, reputation, and financial wellness products, which provide innovative solutions and insights that empower consumers to grow and manage their identity, reputation and finances confidently.
Direct revenue: Direct revenue reflects subscriptions sold directly through e-commerce or mobile channels, and revenue generated from financial transactions directly made through Gen properties or marketplaces.
Partner revenue: Partner revenue reflects partner-sourced and channel revenue via retailers, employee benefits, telcos, publishers, and strategic partnerships, including revenue generated from product usage or products sold through our financial marketplace.
Paid customers: We define paid customers as active users of our products and solutions, including subscribers with an active paid subscription to our products at the end of the reported period. Paid customers also includes product users with a unique account and at least one revenue-generating transaction in the relevant active period of each respective product category, whether through our first-party personal finance products, transacting through our financial marketplaces, or generating revenue through product usage. We exclude users on free trials and those who have not actively transacted in the relevant period of each respective product category. In order to properly reflect Gen’s customer cohorts that contribute to revenue given the dynamic nature of consumers and our product portfolio, our methodology is subject to change from time to time. The methodologies used to measure these metrics require judgment and we regularly review our metrics to improve their accuracy. However, our ability to recalculate our historical metrics may be impacted by data limitations or other factors that require us to apply different methodologies for such adjustments. We generally do not intend to update previously disclosed metrics for any such inaccuracies or adjustments that are deemed not material.
View original content to download multimedia:https://www.prnewswire.com/news-releases/gen-delivers-another-double-digit-growth-quarter-in-q2-fy27-and-raises-fy27-outlook-302922610.html
SOURCE Gen Digital Inc.









 Coin Market4 days ago

 Coin Market4 days ago

 Technology4 days ago

 Technology4 days ago

 Technology4 days ago

 Technology4 days ago
