Connect with us

Technology

General Dynamics Reports Third-Quarter 2026 Financial Results

Published

on

Revenue $14.6 billion, up 12.9% versus prior yearDiluted EPS $4.49, up 15.7% versus prior year$1.7 billion cash from operating activities, 139% of net earnings6.8-to-1 book-to-bill, $220 billion backlog

RESTON, Va., Oct. 30, 2026 /PRNewswire/ — General Dynamics (NYSE: GD) today reported third-quarter 2026 operating earnings of $1.5 billion, and $4.49 per diluted share (EPS), on revenue of $14.6 billion. Compared with the year-ago quarter, revenue increased 12.9%, operating earnings increased 14.7%, and diluted EPS increased 15.7%. Operating margin of 10.5% was a 20-basis-point expansion from the year-ago quarter.

“Our business had exceptional third quarter results, with revenue growth across all four segments, robust bookings and solid operational performance,” said Phebe Novakovic, chairman and chief executive officer. “With the consistent growth in our backlog and our significant investment in our businesses over the last decade, we are poised to drive continued performance in the years to come.”

Cash and Capital Deployment

Cash provided by operating activities in the quarter totaled $1.7 billion, or 139% of net earnings. During the quarter, the company paid $429 million in dividends, invested $481 million in capital expenditures, and reduced total debt by $500 million. The company ended the quarter with $7 billion in total debt and $4.4 billion in cash and equivalents on hand.

Orders and Backlog

Orders received in the quarter totaled $93.8 billion in the defense segments, driven by large orders in the Marine Systems segment for Virginia- and Columbia-class submarines, and $5 billion in the Aerospace segment, for a total of $98.8 billion. Book-to-bill ratio, defined as orders divided by revenue, was 8.5-to-1 for the quarter for the defense segments, 1.4-to-1 for the Aerospace segment, and 6.8-to-1 on a company-wide basis.

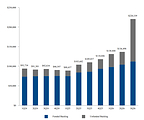
Backlog at the end of the quarter was $220.3 billion. Estimated potential contract value, representing management’s estimate of additional value in unfunded indefinite delivery, indefinite quantity (IDIQ) contracts and unexercised options, was $50.4 billion. Total estimated contract value, the sum of backlog plus estimated potential contract value, was $270.7 billion.

About General Dynamics

Headquartered in Reston, Virginia, General Dynamics is a global aerospace and defense company that offers a broad portfolio of products and services in business aviation; ship construction and repair; land combat vehicles, weapon systems and munitions; and technology products and services. General Dynamics employs more than 120,000 people worldwide and generated $52.6 billion in revenue in 2025. More information is available at www.gd.com.

WEBCAST INFORMATION: General Dynamics’ financial results conference call will be held on Friday, October 30, 2026, at 9:00 a.m. EDT.  A link to the live webcast will be available at www.gd.com and will be available for replay following the call. Corresponding presentation slides will be available for download prior to the call.

This press release may contain forward-looking statements (FLS), including statements about the company’s future operational and financial performance, which are based on management’s expectations, estimates, projections and assumptions. Words such as “expects,” “anticipates,” “plans,” “believes,” “forecasts,” “scheduled,” “outlook,” “estimates,” “should” and variations of these words and similar expressions are intended to identify FLS. In making FLS, we rely on assumptions and analyses based on our experience and perception of historical trends; current conditions and expected future developments; and other factors, estimates and judgments we consider reasonable and appropriate based on information available to us at the time. FLS are made pursuant to the safe harbor provisions of the Private Securities Litigation Reform Act of 1995, as amended. FLS are not guarantees of future performance and involve factors, risks and uncertainties that are difficult to predict. Actual future results and trends may differ materially from what is forecast in the FLS. All FLS speak only as of the date they were made. We do not undertake any obligation to update or publicly release revisions to FLS to reflect events, circumstances or changes in expectations after the date of this press release. Additional information regarding these factors is contained in the company’s filings with the SEC, and these factors may be revised or supplemented in future SEC filings. In addition, this press release may contain some financial measures not prepared in accordance with U.S. generally accepted accounting principles (GAAP). While we believe these non-GAAP metrics provide useful information for investors, there are limitations associated with their use, and our calculations of these metrics may not be comparable to similarly titled measures of other companies. Non-GAAP metrics should not be considered in isolation from, or as a substitute for, GAAP measures. Reconciliations to comparable GAAP measures and other information relating to our non-GAAP measures are included in other filings with the SEC, which are available at investorrelations.gd.com.

EXHIBIT A

CONSOLIDATED STATEMENT OF EARNINGS – (UNAUDITED)

DOLLARS IN MILLIONS, EXCEPT PER SHARE AMOUNTS

Three Months Ended

Variance

October 4, 2026

September 28, 2025

$

%

Revenue

$                     14,566

$                     12,907

$     1,659

12.9 %

Operating costs and expenses

(13,039)

(11,576)

(1,463)

Operating earnings

1,527

1,331

196

14.7 %

Other, net

4

15

(11)

Interest, net

(45)

(74)

29

Earnings before income tax

1,486

1,272

214

16.8 %

Provision for income tax, net

(257)

(213)

(44)

Net earnings

$                       1,229

$                       1,059

$        170

16.1 %

Earnings per share—basic

$                         4.55

$                         3.93

$       0.62

15.8 %

Basic weighted average shares outstanding

270.2

269.2

Earnings per share—diluted

$                         4.49

$                         3.88

$       0.61

15.7 %

Diluted weighted average shares outstanding     

273.8

272.6


EXHIBIT B

CONSOLIDATED STATEMENT OF EARNINGS – (UNAUDITED)

DOLLARS IN MILLIONS, EXCEPT PER SHARE AMOUNTS

Nine Months Ended

Variance

October 4, 2026

September 28, 2025

$

%

Revenue

$                     42,141

$                     38,171

$     3,970

10.4 %

Operating costs and expenses

(37,734)

(34,267)

(3,467)

Operating earnings

4,407

3,904

503

12.9 %

Other, net

18

51

(33)

Interest, net

(163)

(251)

88

Earnings before income tax

4,262

3,704

558

15.1 %

Provision for income tax, net

(748)

(637)

(111)

Net earnings

$                       3,514

$                       3,067

$        447

14.6 %

Earnings per share—basic

$                       13.01

$                       11.41

$       1.60

14.0 %

Basic weighted average shares outstanding

270.2

268.8

Earnings per share—diluted

$                       12.83

$                       11.29

$       1.54

13.6 %

Diluted weighted average shares outstanding      

273.8

271.8


EXHIBIT C

REVENUE AND OPERATING EARNINGS BY SEGMENT – (UNAUDITED)

DOLLARS IN MILLIONS

Three Months Ended

Variance

October 4, 2026

September 28, 2025

$

%

Revenue:

Aerospace

$                  3,536

$                   3,234

$            302

9.3 %

Marine Systems

4,960

4,096

864

21.1 %

Combat Systems

2,386

2,252

134

6.0 %

Technologies

3,684

3,325

359

10.8 %

Total

$                14,566

$                 12,907

$         1,659

12.9 %

Operating earnings:                                                

Aerospace

$                     513

$                      430

$              83

19.3 %

Marine Systems

391

291

100

34.4 %

Combat Systems

330

335

(5)

(1.5) %

Technologies

346

327

19

5.8 %

Corporate

(53)

(52)

(1)

(1.9) %

Total

$                  1,527

$                   1,331

$            196

14.7 %

Operating margin:

Aerospace

14.5 %

13.3 %

Marine Systems

7.9 %

7.1 %

Combat Systems

13.8 %

14.9 %

Technologies

9.4 %

9.8 %

Total

10.5 %

10.3 %


EXHIBIT D

REVENUE AND OPERATING EARNINGS BY SEGMENT – (UNAUDITED)

DOLLARS IN MILLIONS

Nine Months Ended

Variance

October 4, 2026

September 28, 2025

$

%

Revenue:

Aerospace

$                10,340

$                   9,322

$         1,018

10.9 %

Marine Systems

13,963

11,905

2,058

17.3 %

Combat Systems

6,959

6,711

248

3.7 %

Technologies

10,879

10,233

646

6.3 %

Total

$                42,141

$                 38,171

$         3,970

10.4 %

Operating earnings:                                                

Aerospace

$                  1,516

$                   1,265

$            251

19.8 %

Marine Systems

1,049

832

217

26.1 %

Combat Systems

958

950

8

0.8 %

Technologies

1,024

987

37

3.7 %

Corporate

(140)

(130)

(10)

(7.7) %

Total

$                  4,407

$                   3,904

$            503

12.9 %

Operating margin:

Aerospace

14.7 %

13.6 %

Marine Systems

7.5 %

7.0 %

Combat Systems

13.8 %

14.2 %

Technologies

9.4 %

9.6 %

Total

10.5 %

10.2 %


EXHIBIT E

CONSOLIDATED BALANCE SHEET

DOLLARS IN MILLIONS

(Unaudited)

October 4, 2026

December 31, 2025

ASSETS

Current assets:

Cash and equivalents

$                        4,388

$                        2,333

Accounts receivable

2,529

2,406

Unbilled receivables

8,906

8,380

Inventories

9,124

9,232

Other current assets

1,926

1,897

Total current assets

26,873

24,248

Noncurrent assets:

Property, plant and equipment, net

7,853

7,525

Intangible assets, net

1,231

1,375

Goodwill

20,849

21,009

Other assets

3,399

3,092

Total noncurrent assets

33,332

33,001

Total assets

$                      60,205

$                      57,249

LIABILITIES AND SHAREHOLDERS’ EQUITY

Current liabilities:

Short-term debt and current portion of long-term debt                                                    

$                           756

$                        1,006

Accounts payable

3,166

2,678

Customer advances and deposits

11,083

9,824

Other current liabilities

3,821

3,288

Total current liabilities

18,826

16,796

Noncurrent liabilities:

Long-term debt

6,260

7,007

Other liabilities

7,827

7,824

Total noncurrent liabilities

14,087

14,831

Shareholders’ equity:

Common stock

482

482

Surplus

4,646

4,403

Retained earnings

46,299

44,080

Treasury stock

(23,403)

(22,860)

Accumulated other comprehensive loss

(732)

(483)

Total shareholders’ equity

27,292

25,622

Total liabilities and shareholders’ equity

$                      60,205

$                      57,249


EXHIBIT F

CONSOLIDATED STATEMENT OF CASH FLOWS – (UNAUDITED)

DOLLARS IN MILLIONS

Nine Months Ended

October 4, 2026

September 28, 2025

Cash flows from operating activities—continuing operations:

Net earnings

$                      3,514

$                      3,067

Adjustments to reconcile net earnings to net cash from operating activities:                 

Depreciation of property, plant and equipment

525

490

Amortization of intangible and finance lease right-of-use assets

173

182

Equity-based compensation expense

169

146

Deferred income tax provision

335

151

(Increase) decrease in assets, net of effects of business acquisitions:

Accounts receivable

(123)

(314)

Unbilled receivables

(480)

(415)

Inventories

108

(131)

Increase (decrease) in liabilities, net of effects of business acquisitions:

Accounts payable

488

119

Customer advances and deposits

1,232

45

Other, net

(196)

219

Net cash provided by operating activities

5,745

3,559

Cash flows from investing activities:

Capital expenditures

(918)

(552)

Other, net

18

130

Net cash used by investing activities

(900)

(422)

Cash flows from financing activities:

Dividends paid

(1,263)

(1,188)

Repayment of fixed-rate notes

(1,000)

(1,500)

Purchases of common stock

(604)

(600)

Proceeds from fixed-rate notes

—

747

Other, net

87

235

Net cash used by financing activities

(2,780)

(2,306)

Net cash used by discontinued operations

(10)

(8)

Net increase in cash and equivalents

2,055

823

Cash and equivalents at beginning of period

2,333

1,697

Cash and equivalents at end of period

$                      4,388

$                      2,520


EXHIBIT G

ADDITIONAL FINANCIAL INFORMATION – (UNAUDITED)

DOLLARS IN MILLIONS, EXCEPT PER SHARE AMOUNTS

Non-GAAP Financial Measures:

Third Quarter

Nine Months

2026

2025

2026

2025

Free cash flow:

Net cash provided by operating activities    

$                       1,710

$                  2,109

$                    5,745

$                    3,559

Capital expenditures

(481)

(212)

(918)

(552)

Free cash flow (a)

$                       1,229

$                  1,897

$                    4,827

$                    3,007

October 4, 2026

December 31, 2025

Net debt:

Total debt

$                       7,016

$                  8,013

Less cash and equivalents

4,388

2,333

Net debt (b)

$                       2,628

$                  5,680

Supplemental Aerospace Data:

Third Quarter

Nine Months

2026

2025

2026

2025

Gulfstream Aircraft Deliveries (units):

Large-cabin aircraft

35

33

101

95

Mid-cabin aircraft

5

6

18

18

Total

40

39

119

113

Aerospace Book-to-Bill:

Orders (c)

$                       4,970

$                  4,053

$                  14,091

$                  10,417

Revenue

3,536

3,234

10,340

9,322

Book-to-Bill Ratio

1.4x

1.3x

1.4x

1.1x

(a)

We define free cash flow as net cash from operating activities less capital expenditures. We believe free cash flow is a useful measure

for investors because it portrays our ability to generate cash from our businesses for purposes such as repaying debt, funding business 

acquisitions, paying dividends and repurchasing our common stock to cover dilution. We use free cash flow to assess the quality of our

earnings and as a key performance measure in evaluating management.

(b)

We define net debt as short- and long-term debt (total debt) less cash and equivalents. We believe net debt is a useful measure for

investors because it reflects the borrowings that support our operations and capital deployment strategy. We use net debt as an

important indicator of liquidity and financial position.

(c)

Excludes customer defaults, liquidated damages, cancellations, foreign exchange fluctuations and other backlog adjustments.


EXHIBIT H

BACKLOG – (UNAUDITED)

DOLLARS IN MILLIONS

Funded

Unfunded

Total

Backlog

Estimated

Potential

Contract Value*

Total

Estimated

Contract Value

Third Quarter 2026:

Aerospace

$            24,460

$                 925

$            25,385

$                     1,374

$               26,759

Marine Systems

47,289

99,576

146,865

7,644

154,509

Combat Systems

26,983

1,701

28,684

9,588

38,272

Technologies

13,064

6,341

19,405

31,724

51,129

Total

$          111,796

$          108,543

$          220,339

$                   50,330

$             270,669

Second Quarter 2026:                        

Aerospace

$            22,992

$                 985

$            23,977

$                     1,170

$               25,147

Marine Systems

42,356

22,826

65,182

7,442

72,624

Combat Systems

27,507

1,843

29,350

10,847

40,197

Technologies

11,256

6,733

17,989

30,945

48,934

Total

$          104,111

$            32,387

$          136,498

$                   50,404

$             186,902

Third Quarter 2025:

Aerospace

$            19,476

$              1,131

$            20,607

$                     1,147

$               21,754

Marine Systems

38,757

14,854

53,611

14,839

68,450

Combat Systems

17,232

1,470

18,702

9,553

28,255

Technologies

10,269

6,668

16,937

32,341

49,278

Total

$            85,734

$            24,123

$          109,857

$                   57,880

$             167,737

*

The estimated potential contract value includes work awarded on unfunded indefinite delivery, indefinite quantity (IDIQ) contracts and

unexercised options associated with existing firm contracts, including options and other agreements with existing customers to purchase

new aircraft and aircraft services. We recognize options in backlog when the customer exercises the option and establishes a firm order.

For IDIQ contracts, we evaluate the amount of funding we expect to receive and include this amount in our estimated potential contract

value. The actual amount of funding received in the future may be higher or lower than our estimate of potential contract value.


EXHIBIT H-1

BACKLOG – (UNAUDITED)

DOLLARS IN MILLIONS

https://mmx.prnewswire.com/media/MS2023592/ExhibitH1.jpg?id=OA3047375

View original content to download multimedia:https://www.prnewswire.com/news-releases/general-dynamics-reports-third-quarter-2026-financial-results-302924010.html

SOURCE General Dynamics

Continue Reading

Technology

STARMUS VIII — THE SEARCH FOR TRUTH

Published

on

By

From Nobel Prize Laureates and NASA Astronauts to Music Legends: STARMUS VIII Unites the World’s Greatest Minds in a Historic Celebration of Science, Music and Humanity

Tenerife & La Palma, Canary Islands, Spain | 17–22 October 2026

CANARY ISLANDS, Spain, Oct. 30, 2026 /PRNewswire/ — From the iconic sound of Sir Brian May’s legendary Red Special guitar and the extraordinary voices of Andrea Bocelli and Sarah Brightman to the groundbreaking discoveries of Nobel Prize-winning scientists, from NASA’s Artemis II astronauts preparing for humanity’s return to the Moon to historic tributes to Stephen Hawking and Jane Goodall, STARMUS VIII — The Search for Truth brought together an extraordinary constellation of scientific minds, legendary musicians, explorers and visionary thinkers for six unforgettable days in the Canary Islands.

Experience the full interactive Multichannel News Release here: https://www.multivu.com/starmus-foundation/9430551-en-starmus-viii-the-search-for-truth-festival-2026

Held across Tenerife and La Palma from 17 to 22 October 2026, the eighth edition of STARMUS transformed the islands into a global stage for scientific discovery, artistic excellence and some of the most important conversations shaping humanity’s future.

Founded by astrophysicist Dr. Garik Israelian and legendary Queen guitarist and astrophysicist Sir Brian May, STARMUS once again demonstrated its unique ability to bridge science, music and society, bringing complex scientific ideas to audiences through extraordinary encounters, performances and shared experiences.

This year’s festival marked two defining milestones: the 10th anniversary of the Stephen Hawking Medal for Science Communication and the inauguration of the Jane Goodall Earth Medal, establishing a powerful connection between humanity’s ambition to explore the universe and its responsibility to protect the planet we call home.

Media Contacts:

US: Dan DuPont, dupont0708@gmail.com, +1 202 380 7558

UK/EU: Nicole Ettinger, nicole@ettingerpr.com, +44 7515 394107

Spain: Carlos Esteban, cesteban@llys.global, +34 699 55 2854


View original content:https://www.prnewswire.com/news-releases/starmus-viii–the-search-for-truth-302924867.html

SOURCE Starmus Foundation

Continue Reading

Technology

Membrane Chromatography Market worth $0.63 billion by 2031 – Exclusive Report by MarketsandMarkets™

Published

on

By

DELRAY BEACH, Fla., Oct. 30, 2026 /PRNewswire/ — According to MarketsandMarkets™, the Membrane Chromatography Market is projected to reach USD 0.63 billion by 2031 from USD 0.37 billion in 2026, at a CAGR of 11.3% during the forecast period.

Browse 417 market data Tables and 51 Figures spread through 343 Pages and in-depth TOC on ‘Membrane Chromatography Market – Global Forecast to 2031’

Membrane Chromatography Market Size & Forecast:

Market Size Available for Years: 2026–20312026 Market Size: USD 0.37 billion2031 Projected Market Size: USD 0.63 billionCAGR (2026–2031): 11.3%

Membrane Chromatography Market Trends & Insights:

By region, North America accounted for the largest share of ~37.4% of the market in 2025.By product, the capsules, cassettes, and cartridges segment is projected to register the highest CAGR of 12.0% in the membrane chromatography market during the forecast period.By technique, the ion exchange membrane chromatography segment accounted for the largest share of 58.1% of the membrane chromatography market in 2025.

Download PDF Brochure: https://www.marketsandmarkets.com/pdfdownloadNew.asp?id=151487196

The membrane chromatography market is expected to grow steadily as pharmaceutical and biotechnology companies increase investments in biologics, biosimilars, vaccines, cell & gene therapies, and other advanced therapeutic modalities. Growing production of monoclonal antibodies, recombinant proteins, viral vectors, plasmid DNA, and mRNA is increasing demand for membrane chromatography products, including capsules, cassettes & cartridges, membrane discs & sheets, syringe filters, filter plates, spin columns, and other consumables & accessories. Rising adoption of single-use downstream processing, flow-through purification, affinity capture, and high-throughput polishing is improving process flexibility, throughput, and manufacturing efficiency. Advances in membrane materials, surface functionalization, and high-capacity affinity membranes are further enhancing selectivity, binding capacity, and purification performance. These factors are supporting adoption across pharmaceutical & biopharmaceutical companies, CROs & CDMOs, and academic & research institutes.

The market is increasingly shifting toward high-throughput, single-use, and application-specific membrane chromatography solutions that can support complex biologics and advanced therapeutic modalities. Although conventional resin-based chromatography remains widely adopted, demand is increasing for advanced membrane formats, improved ligand chemistries, higher binding capacities, and intensified flow-through and bind-elute purification approaches that can reduce processing time and improve downstream productivity. Suppliers are expanding product portfolios and developing specialized membrane chemistries to support monoclonal antibodies, viral vectors, plasmid DNA, mRNA, and other biomolecules with challenging purification requirements. At the same time, manufacturers are addressing challenges related to membrane fouling, scalability, selectivity, pressure handling, and process consistency through advanced membrane materials and optimized purification workflows. The growing outsourcing of bioprocess development and manufacturing further supports specialized membrane chromatography providers that can deliver scalable, high-throughput purification solutions with shorter turnaround times and consistent performance.

The flow-through membrane chromatography segment is expected to register the highest growth rate in the membrane chromatography market during the forecast period.

The membrane chromatography market is segmented by operation mode into flow-through membrane chromatography and bind-elute membrane chromatography. During the forecast period, flow-through membrane chromatography is projected to grow faster, supported by rising demand for high-throughput impurity removal, polishing, and process intensification in biopharmaceutical manufacturing. Flow-through processing enables rapid processing, lower pressure drops, reduced buffer consumption, and easier integration with single-use and continuous downstream workflows. However, bind-elute membrane chromatography remains an important operating mode because it supports selective capture and purification of target biomolecules across biologics and advanced therapy manufacturing applications.

Inquiry Before Buying: https://www.marketsandmarkets.com/Enquiry_Before_BuyingNew.asp?id=151487196

North America accounted for the largest regional share of the global membrane chromatography market in 2025.

The membrane chromatography market is segmented into North America, Europe, Asia Pacific, Latin America, the Middle East, and Africa. In 2025, North America accounted for the largest share of the global market, driven by a well-established pharmaceutical and biotechnology industry, strong biopharmaceutical R&D activity, significant biologics manufacturing capacity, and widespread adoption of advanced downstream purification technologies. The region also benefits from major membrane chromatography product providers, pharmaceutical & biopharmaceutical companies, CROs & CDMOs, and research institutions. Continued development and commercialization of monoclonal antibodies, vaccines, viral vectors, and other advanced therapeutics, along with increasing adoption of single-use and high-throughput purification solutions, further support the region’s leading market position.

Key Players

Leading players in the Membrane Chromatography companies include Danaher Corporation (US), Sartorius AG (Germany), Merck KGaA (Germany), Thermo Fisher Scientific Inc. (US), Agilent Technologies, Inc. (US), Donaldson Company, Inc. (US), GVS S.p.A. (Italy), i3 Membrane GmbH (Germany), Restek Corporation (US), Shimadzu Corporation (Japan), W. L. Gore & Associates, Inc. (US), MACHEREY-NAGEL GmbH & Co. KG (Germany), and MICROSOLV (US), among others.

Get 10% Free Customization on this Report: https://www.marketsandmarkets.com/requestCustomizationNew.asp?id=151487196

Investment & Funding Context

The membrane chromatography market is seeing increased investment as companies and research organizations focus on developing high-capacity membranes, scaling up manufacturing, advancing continuous downstream processing, and commercializing single-use purification technologies.

In June 2026, MembraneWorks, Inc. received USD 350,000 through the North Carolina Biotechnology Center’s Small Business Research Loan program to develop high-capacity nonwoven membrane chromatography devices for biopharmaceutical purification. The funding supports further development and commercialization of membrane-based downstream purification technologies.

In June 2025, a North Carolina State University research team received funding under the Gates Foundation-supported Grand Challenges initiative to develop a low-cost, all-membrane chromatography process to purify the antimalarial monoclonal antibody MAM01. The project focuses on single-use membranes, membrane-coupled ligands, scalable device configurations, integration into single-use cassettes, and development of an affordable, scalable biomanufacturing platform. These developments indicate continued funding toward membrane chromatography commercialization, high-capacity membrane devices, single-use purification, process intensification, and scalable biologics manufacturing.

Revenue Shift Context

The membrane chromatography market is gradually shifting from conventional resin-based chromatography and standalone filtration toward a broader mix of single-use membrane adsorbers, high-capacity affinity membranes, flow-through purification solutions, and application-specific consumables. Traditional products such as capsules, cassettes & cartridges, syringe filters, filter plates, spin columns, and membrane discs & sheets remain important revenue pools; however, customers increasingly seek integrated downstream solutions supporting monoclonal antibodies, viral vectors, plasmid DNA, mRNA, and other advanced therapeutic modalities.

Rising demand for single-use and high-throughput purification is further increasing consumption of specialized membrane formats and functionalized chemistries. At the same time, growing outsourcing by pharmaceutical & biopharmaceutical companies to CROs & CDMOs is expanding revenue opportunities for scalable purification platforms and related consumables. Over the forecast period, revenue growth is therefore expected to increasingly favor recurring membrane consumables, affinity membrane chromatography, advanced membrane materials, and integrated flow-through downstream processing workflows.

Mergers & Acquisitions

Mergers & acquisitions in the membrane chromatography market are increasingly focused on expanding downstream purification capabilities, strengthening membrane and filtration portfolios, and improving access to biopharmaceutical manufacturing customers. Buyers are prioritizing technologies that complement single-use processing, membrane-based separations, and integrated upstream-to-downstream workflows.

MEMBRANE CHROMATOGRAPHY MARKET: MERGERS & ACQUISITIONS, JANUARY 2025–SEPTEMBER 2026

Month & Year

Deal Type

Company
1

Company
2

Description

September 2025

Acquisition

Thermo Fisher Scientific Inc. (US)

Solventum Corporation – Purification & Filtration Business (US)

Thermo Fisher Scientific completed the acquisition of Solventum’s Purification & Filtration business for approximately USD 4.0 billion. The acquired business includes bioprocessing filtration and membrane technologies supporting upstream and downstream biopharmaceutical manufacturing. The portfolio includes Polisher ST Membrane Adsorber, a single-use anion exchange membrane chromatography solution for flow-through polishing and removal of host cell proteins, DNA, viruses, and other impurities. The acquisition strengthens Thermo Fisher’s membrane-based purification and broader downstream bioprocessing capabilities.

Company Revenue Share Details

The top four players collectively account for approximately 73–77% of the global membrane chromatography market, indicating a consolidated landscape. The market comprises a mix of diversified life science companies and specialized membrane chromatography product manufacturers. Leading players include Danaher Corporation (US), Sartorius AG (Germany), Merck KGaA (Germany), Thermo Fisher Scientific Inc. (US), i3 Membrane GmbH (Germany), Agilent Technologies, Inc. (US), Donaldson Company, Inc. (US), GVS S.p.A. (Italy), Restek Corporation (US), Shimadzu Corporation (Japan), W. L. Gore & Associates, Inc. (US), MACHEREY-NAGEL GmbH & Co. KG (Germany), MICROSOLV (US), among others. Their portfolio spans membrane adsorbers, capsules, cassettes & cartridges, syringe filters, filter plates, spin columns, membrane discs & sheets, and other consumables, along with ion exchange, affinity, and hydrophobic interaction membrane chromatography solutions. The coexistence of large, diversified companies and specialized membrane technology providers creates significant scope for continued competition and consolidation, particularly as companies expand single-use purification portfolios, high-capacity affinity membrane technologies, advanced membrane materials, and geographic reach.

Browse Adjacent Market: Biotechnology Market Research Reports &Consulting

See More Latest Biotechnology Reports:

Life Science Instrumentation Market by Technology (Spectroscopy, Chromatography, NGS, PCR, Microscopy, Centrifuge, Liquid Handling), Application (Diagnostic, Research), End User (Pharma-Biopharma, Food, Hospital, Academia, CRO) – Global Forecast to 2031

Chromatography Columns Market by Column Type (Ion Exchange, Size Exclusion, Reverse and Normal Phases, HPLC, Affinity, Chiral), Capacity (1-100 ml, 100-1000 ml, >1 liter), End User (Pharma & Biotech, CRO, CDMO) – Global Forecast to 2031

About MarketsandMarkets™  

MarketsandMarkets™ has been recognized as one of America’s Best Management Consulting Firms by Forbes, as per their recent report.

MarketsandMarkets™ is a blue ocean alternative in growth consulting and program management, leveraging a man-machine offering to drive supernormal growth for progressive organizations in the B2B space. With the widest lens on emerging technologies, we are proficient in co-creating supernormal growth for clients across the globe.

Today, 80% of Fortune 2000 companies rely on MarketsandMarkets, and 90 of the top 100 companies in each sector trust us to accelerate their revenue growth. With a global clientele of over 13,000 organizations, we help businesses thrive in a disruptive ecosystem.

The B2B economy is witnessing the emergence of $25 trillion in new revenue streams that are replacing existing ones within this decade. We work with clients on growth programs, helping them monetize this $25 trillion opportunity through our service lines – TAM Expansion, Go-to-Market (GTM) Strategy to Execution, Market Share Gain, Account Enablement, and Thought Leadership Marketing.

Built on the ‘GIVE Growth’ principle, we collaborate with several Forbes Global 2000 B2B companies to keep them future-ready. Our insights and strategies are powered by industry experts, cutting-edge AI, and our Market Intelligence Cloud, KnowledgeStore™, which integrates research and provides ecosystem-wide visibility into revenue shifts.

MarketsandMarkets™ SalesPlay is an AI-driven Revenue Intelligence Co-Pilot designed to help revenue teams prioritize the right accounts, identify critical changes early, and surface opportunities ahead of demand, so pipeline builds naturally and deals close with greater consistency.

To find out more, visit www.MarketsandMarkets™.com or follow us on Twitter, LinkedIn and Facebook.

Contact:
Mr. Rohan Salgarkar
MarketsandMarkets™ INC.
1615 South Congress Ave.
Suite 103, Delray Beach, FL 33445
USA: +1-888-600-6441
Email: sales@marketsandmarkets.com
Visit Our Website: https://www.marketsandmarkets.com/
Research Insight: https://www.marketsandmarkets.com/ResearchInsight/membrane-chromatography-market.asp
Content Source: https://www.marketsandmarkets.com/PressReleases/membrane-chromatography.asp


View original content to download multimedia:https://www.prnewswire.co.uk/news-releases/membrane-chromatography-market-worth-0-63-billion-by-2031—exclusive-report-by-marketsandmarkets-302924841.html

Continue Reading

Technology

In HelloNation, Assisted Living Experts Rusty and Kelly Ackerman Explain Why Amenities Matter More Than Families Expect

Published

on

By

The article examines how amenities shape daily routines, independence, and social connection in senior living communities.

TRAVERSE CITY, Mich., Oct. 30, 2026 /PRNewswire/ — Why do senior living amenities have a greater impact on daily life than many families initially expect? HelloNation has released an article that explains how these features influence comfort, independence, and social connection in meaningful ways.

The article features insights from Assisted Living Experts Rusty and Kelly Ackerman of French Manor Assisted Living in Traverse City, Michigan, and highlights how senior living amenities play a central role in shaping everyday experiences within a community.

The HelloNation article explains that while families often focus on apartments and care services, senior living amenities are deeply connected to how residents spend their time. These amenities are not simply added features but part of the daily routine that supports both independence and engagement.

Dining options are one of the most impactful elements discussed. The article notes that meals are a daily experience that influence routine, health, and social connection. Asking about variety and flexibility helps families understand how dining options support both independence and comfort over time.

The article also explains that flexible dining options allow residents to make choices about when and what they eat. This ability to choose supports independence and reinforces a sense of control, which is especially important during transitions into a new living environment.

Activity spaces are another essential component of senior living amenities. The article describes how these spaces support hobbies, group events, and informal gatherings. Well-used activity spaces encourage residents to remain engaged and provide natural opportunities for social connection throughout the day.

In addition, activity spaces help foster spontaneous interaction. Residents may gather for conversation or shared interests, which strengthens community bonds. The article emphasizes that accessible and active spaces contribute directly to both engagement and independence.

Outdoor areas also play a significant role in daily life. The article explains that access to outdoor areas allows residents to enjoy fresh air, walk safely, and experience a change of environment. These outdoor areas help create a balanced routine and support emotional well-being.

The article further notes that time spent outdoors can improve mood and reduce stress. When outdoor areas are designed with safety and accessibility in mind, they support both independence and overall comfort.

Wellness programs are another key aspect of senior living amenities. The article describes how these programs provide structure through fitness and health-focused activities. Consistent wellness programs help residents maintain strength, confidence, and long-term well-being.

Wellness programs also encourage social connection by bringing residents together in shared activities. Participation in these programs helps build relationships while supporting physical health, reinforcing a sense of purpose within the community.

The article highlights that social connection is often shaped by how effectively senior living amenities are used. Dining options, activity spaces, outdoor areas, and wellness programs all create opportunities for interaction that help residents feel connected rather than isolated.

Senior living amenities also support independence in practical ways. Easy access to these features allows residents to make choices throughout the day, reinforcing confidence and autonomy over time.

Overall, the HelloNation article emphasizes that senior living amenities play a direct role in shaping comfort, independence, and social connection. Families are encouraged to look beyond appearance and ask how these amenities function on a daily basis to better understand the full living experience.

For families evaluating options, the article provides a clear perspective on how senior living amenities contribute to quality of life in ways that may not be immediately visible during a tour.

Why Amenities Matter More Than Families Expect features insights from Rusty and Kelly Ackerman, Assisted Living Experts of Traverse City, Michigan, in HelloNation.

About HelloNation
HelloNation is America’s Good News Network, a premier media platform built on the idea that good news travels faster when real people tell real stories. Through its community-focused publications and innovative “edvertising” approach, HelloNation delivers content that informs, inspires, and spotlights the leaders making a meaningful impact in their communities.

View original content to download multimedia:https://www.prnewswire.com/news-releases/in-hellonation-assisted-living-experts-rusty-and-kelly-ackerman-explain-why-amenities-matter-more-than-families-expect-302925027.html

SOURCE HelloNation

Continue Reading

Trending