Connect with us

Technology

Max Stock Limited Reports Third Quarter 2026 Financial Results

Published

on

Third Quarter Revenue Increased 17.9% to ILS 470.4 million; Comparable Store Sales Increased 11.2%; Gross Margin Increased 380 Basis Points; Adjusted EBITDA Increased 45.7%; GAAP Net income (100%) Increased 77.6% to ILS 79.8 million; Net Cash Increased 87.5% to ILS 163.7 million

CAESAREA, Israel, Nov. 17, 2026 /PRNewswire/ — Max Stock Limited (TASE: MAXO) (the “Company”) today reported financial results for the third quarter and nine months ended September 30, 2026.

Third Quarter 2026 Summary

Revenue increased 17.9% to ILS 470.4 million.Comparable store sales increased 11.2%.Gross margin increased 380 basis points to 48.1%.Net income (100%) increased 77.6% to ILS 79.8 million.Adjusted EPS1 (attributable to shareholders) increased 84.0% to ILS 0.54.Adjusted EBITDA2 increased 45.7% to ILS 101.0 million.

First Nine Months 2026 Summary 

Revenue increased 16.4% to ILS 1.25 billion.Comparable store sales increased 11.7%.Gross margin increased 350 basis points to 47.0%.Net income (100%) increased 58.8% to ILS 165.6 million.Adjusted EPS1 (attributable to shareholders) increased 62.8% to ILS 1.10.Adjusted EBITDA2 increased 46.1% to ILS 253.9 million.

“We are very pleased with our record third-quarter performance, which marked our 13th consecutive quarter of positive comparable store sales and demonstrated an acceleration into double-digit growth.” said Ori Max, Founder and Chief Executive Officer. “Consistent gains in customer traffic and average basket size were driven by our ongoing investments in expanding and enhancing the quality of our product assortment and maintaining our unbeatable value proposition. Combined with favorable foreign currency exchange, our strong top-line momentum translated into outsized gains we posted in gross margin, adjusted EBITDA, net income and our net cash level. Alongside our continued store rollout, the recent agreement to establish a new 45,000-square-meter logistics center in Ofakim lays the infrastructure for our next phase of long-term growth and shareholder value creation.”

Third Quarter Results (2026 compared with 2025)

Revenue increased 17.9% to ILS 470.4 million in the third quarter 2026 as compared with revenue of ILS 399.1 million in the third quarter 2025. The increase over the same period last year was largely attributable to an 11.2% increase in comparable store sales combined with the opening of new branches. The increase in comparable store sales was driven by an increase in traffic and an increase in average basket size, reflecting a favorable product mix and growth in sales of items characterized by a higher average price. These results also benefited from the Jewish New Year holidays falling almost entirely in Q3 2026, whereas in 2025 the holidays were split between Q3 and Q4.

Notably, for the four-month period from July 1, 2026 through October 31, 2026, which captures the full holiday season in both years, comparable store sales increased 11.0% compared to the prior-year period.

Gross profit increased 27.8% to ILS 226.2 million in the third quarter 2026 from ILS 177.0 million in the third quarter 2025. Gross margin was 48.1% as compared to 44.3% in the prior year period. The 380-basis point improvement in gross margin was primarily attributable to the strengthening of the ILS vs. the USD.

Selling, general and administrative expenses were ILS 128.8 million in the third quarter 2026 compared to ILS 107.0 million in the third quarter 2025. The increase in operating expenses was primarily driven by an increase in payroll expenses (resulting from higher revenue this quarter and the opening of new branches), alongside higher municipal taxes and increased depreciation of right-of-use assets in the period. As a percent of sales, selling, general and administrative expenses increased 60 basis points, from 26.8% in the third quarter 2025 to 27.4% in the third quarter 2026.

Financing income, net, totaled approximately ILS 1.7 million in the third quarter of 2026 compared to financing expenses, net, of ILS 11.8 million in the third quarter of 2025. The change in net financing income was largely attributable to an income of ILS 10.8 million from hedging transactions compared to an ILS 4.6 million loss from hedging transactions in the year ago period.

As of September 30, 2026, the Company holds forward hedging transactions to purchase US dollars at exchange rates ranging from ILS 2.80 to ILS 3.43. As of the reporting date, these forward hedging transactions are for the purchase of approximately $17.3 million USD in 2026, approximately $51.3 million USD in 2027, and approximately $31.3 million USD in 2028.

Starting in early June 2026, the US dollar appreciated against the ILS, leading to the recognition of financing income from the revaluation of forward hedging transactions in Q3 2026, based on the reporting-date exchange rate of 3.063. The dollar’s appreciation continued following the reporting date, with the representative exchange rate standing at 3.223 as of November 16, 2026.

GAAP net income (100%) increased 77.6% to ILS 79.8 million in the third quarter of 2026, as compared with GAAP net income (100%) of ILS 44.9 million in the third quarter of 2025.

Adjusted EPS attributable to shareholders increased 84.0% to ILS 0.54 per share, in the third quarter of 2026, as compared with adjusted EPS attributable to shareholders of ILS 0.29 per share, in the third quarter of 2025.

Adjusted EBITDA increased 45.7% to ILS 101.0 million in the third quarter of 2026 from ILS 69.3 million in the third quarter of 2025. Adjusted EBITDA margin increased to 21.5% in the third quarter of 2026 compared with 17.4% in the third quarter of 2025.

First Nine Months Results (2026 compared with 2025)

Revenue for the first nine months of 2026 increased 16.4% to ILS 1.25 billion, compared with revenue of ILS 1.07 billion in the first nine months of 2025. The increase in revenue was driven by an 11.7% gain in comparable store sales and the contribution from new branches. The increase in comparable store sales was fueled by an increase in average basket size, increased store traffic and higher seasonal sales. The increase in average basket size reflected a favorable product mix and growth in sales of items characterized by a higher average price.

Comparable store sales increased 11.7% in the first nine months of 2026, and 11.5% for the ten-month period from January through October 2026.

Gross profit increased 25.7% to ILS 587.7 million in the first nine months of 2026 from ILS 467.6 million a year ago. Gross margin was ~47.0% as compared to ~43.5% in the prior year period. The 350-basis point improvement in gross margin year-over-year was primarily attributable to the strengthening of the ILS vs. the USD alongside lower shipping costs, and improved terms of trade. In addition, logistics expenses in the first nine months of 2025 reflected increased costs resulting from the transition and ramp-up period for the operation of the new distribution center, which had not yet reached full capacity.

Selling, general and administrative expenses increased to ILS 336.2 million in the first nine months of 2026 from ILS 293.1 million in the first nine months of 2025. The increase in operating expenses was driven by an increase in payroll expenses, higher municipal taxes and increased depreciation of right-of-use assets in the period, resulting from higher revenue in the current year period and branch expansion. As a percentage of sales, selling, general and administrative expenses improved 40 basis points and were 26.9% in the first nine months of 2026 compared with 27.3% in the first nine months of 2025, primarily reflecting operating leverage. 

Financing expenses, net, totaled approximately ILS 41.5 million in the first nine months of 2026 compared to ILS 34.0 million in the first nine months of 2025. The increase in net financing expenses was largely attributable to a loss of approximately ILS 20.8 million in the first nine months of 2026, related to revaluation of future dollar hedging transactions resulting from the USD’s depreciation against the NIS, compared to a loss of ILS 15.5 million in the first nine months of 2025.

GAAP net income (100%) in the first nine months of 2026 increased 58.8% to ILS 165.6 million, as compared with GAAP net income (100%) of ILS 104.3 million in the first nine months of 2025.

Adjusted EPS1 (attributable to shareholders) increased 62.8% to ILS 1.10 in the first nine months of 2026 as compared with adjusted EPS1 (attributable to shareholders) of ILS 0.67 per share, in the first nine months of 2025.

Adjusted EBITDA2 increased 46.1% to ILS 253.9 million in the first nine months of 2026, from ILS 173.7 million in the first nine months of 2025. Adjusted EBITDA margin increased 410 basis points to 20.3% compared with 16.2% in the first nine months of 2025.

Balance Sheet and Cash Flow Highlights

The Company’s cash and cash equivalents balance at September 30, 2026 was ILS 192.7 million compared with ILS 161.8 million at December 31, 2025 and ILS 120.7 million at September 30, 2025. The Company ended the third quarter of 2026 with total debt of ILS 29.0 million compared with total debt of ILS 32.7 million at December 31, 2025 and ILS 33.4 million at September 30, 2025.

Inventories at September 30, 2026 were ILS 224.8 million compared with ILS 210.2 million at December 31, 2025 and ILS 191.2 million at September 30, 2025.

Cash flows provided by operating activities in the first nine months of 2026 totaled ILS 239.1 million, compared with ILS 231.9 million in the first nine months of 2025. In the third quarter of 2026, cash flows provided by operating activities increased to ILS 131.2 million from ILS 99.2 million in the third quarter of 2025, primarily driven by the increase in net income.   During the first nine months of 2026, the Company distributed total dividends of ILS 130.0 million to its shareholders, consisting of approximately ILS 80.0 million (ILS 0.57 per share) paid in April 2026 and approximately ILS 50.0 million (ILS 0.36 per share) paid in September 2026.

Conference Call Information

The Company will host a conference call on November 17, 2026 at 8:00 a.m. Eastern Standard Time to discuss third quarter 2026 results (LINK). The conference call will also be accessible at https://ir.maxstock.co.il/en/event-en/.There will be a slide presentation that accompanies the call. The slides will be accessible at   https://ir.maxstock.co.il/en/presentation-en/. An archived webcast of the conference call will be available at https://ir.maxstock.co.il/en/presentation-en/.

Note: Totals may be slightly impacted by minor rounding differences.

1. As used throughout this release, adjusted Net Income (attributable to shareholders) defined as Net Income + Share-based payment, multiplied by the portion attributable to shareholders. Adjusted EPS (attributable to shareholders) is then divided by the number of basic shares.
2. As used throughout this release, adjusted EBITDA Pre IFRS 16 defined as Net Income + Income Tax Expenses + Net Interest Expenses + D&A + Other Expenses – the impact of IFRS 16 + Share-based payment.

About Max Stock

Max Stock is Israel’s leading extreme value retailer, currently present in 65 locations throughout Israel. We offer a broad assortment of quality products for customers’ everyday needs at affordable prices, helping customers “Dream Big, Pay Small”. For more information, please visit https://ir.maxstock.co.il    

Forward-Looking Statements

It should be emphasized that this report includes forward-looking information as defined under the Securities Law, 5728-1968. Forward-looking information is uncertain information regarding the future, including forecasts, projections, estimates or other information which refer to a future event or matter, the eventuation of which is uncertain and/or not within the Company’s control. The forward-looking information included in this report is based on the current information held by the Company or its current assessments, as of the publication date of this report.

Company Contacts:

Talia Sessler,
Chief Corporate Development and IR Officer
talia@maxstock.co.il

View original content:https://www.prnewswire.com/news-releases/max-stock-limited-reports-third-quarter-2026-financial-results-302941507.html

SOURCE Max Stock Limited

Continue Reading

Technology

Nozomi Networks Lands Co-Development Project with Lockheed Martin to Strengthen Cybersecurity for Government and Defense Environments

Published

on

By

Lockheed Martin is providing offset funding and technical expertise to support Nozomi Networks in developing advanced cybersecurity and automated security configuration assessment capabilities for diverse, distributed environments, starting with DISA STIG compliance.

SAN FRANCISCO and MENDRISIO, Switzerland, Nov. 17, 2026 /PRNewswire/ — Nozomi Networks Inc., the leader in AI-powered operational technology (OT), Internet of Things (IoT), and cyber physical security (CPS), today announced a strategic collaboration with Lockheed Martin (NYSE: LMT) to accelerate and simplify how global government and defense organizations secure their environments and demonstrate configuration compliance across defense networks.

As an offset project tied to the F-35 sale to Switzerland, Nozomi Networks developers, supported by Lockheed Martin cyber experts, are building significant new capabilities within the Nozomi Networks platform. These enhancements will enable the safe automation of security configuration assessments (SCAs) across diverse, distributed environments while simplifying configuration compliance and reporting tasks. The collaboration will enable government and defense industrial base organizations globally to:

Automate configuration compliance assessments and reporting against established benchmarks such as Defense Information Systems Agency (DISA) Security Technical Implementation Guides (STIGs)Safely extend automated configuration compliance checks to OT and cyber-physical systems that cannot tolerate traditional, IT-centric assessment techniquesMerge configuration compliance reporting tasks with advanced asset identification, threat detection, and risk analysis capabilitiesProduce repeatable, auditable evidence of configuration compliance to support DoD Risk Management Framework (RMF) and authorization activities

The first of these capabilities is automated SCA, initially mapped to DISA STIGs. Existing STIG assessment workflows were designed for laptops, servers, and enterprise infrastructure and are less effective for engineering workstations, facility systems, and other operational assets that may not tolerate traditional assessment techniques. As a result, many defense organizations still rely on spreadsheets and manual validation to demonstrate compliance, an approach that cannot scale as frameworks such as the DoD Control Systems Security Requirements Guide (SRG) extend cybersecurity requirements to industrial control and cyber-physical systems.

Using Nozomi Arc sensors, organizations can safely collect host-level configuration data to evaluate endpoints against DISA STIG benchmarks, also supported by passive monitoring of network communications. Assessment results are consolidated and centrally managed, either on premises in the Nozomi Networks Central Management Console (CMC) or in the cloud through Vantage or Vantage for Government. Security teams can track compliance posture and changes over time, review pass/fail findings and supporting evidence, investigate rule-level findings and remediation guidance, and view configuration posture alongside asset inventory, vulnerability, and risk data.

DISA STIGs are only the beginning. Nozomi Networks plans to add safe active polling to collect configuration data from assets where endpoint sensors can’t be deployed and to extend the platform to additional security frameworks and benchmarks across OT, IoT, and IT environments.

“This work with Lockheed Martin is a testament to our joint commitment to bringing the power of AI to improve how our public-sector customers secure their systems,” said Nozomi Networks CEO Andrea Carcano. “With automated DISA STIG assessments, defense organizations can now validate configuration compliance across diverse environments safely and at scale, without the spreadsheets and manual processes that have held them back. We are proud to take this important, industry-leading step with Lockheed Martin to deploy the most advanced AI tools to support government agencies while adhering to the highest standards of cybersecurity governance.”

About Nozomi Networks
Nozomi Networks protects the world’s critical infrastructure from cyber threats. Our platform uniquely combines network and endpoint visibility, threat detection, and AI-powered analysis for faster, more effective incident response. Customers rely on us to minimize risk and complexity while maximizing operational resilience. www.nozominetworks.com 

View original content to download multimedia:https://www.prnewswire.com/news-releases/nozomi-networks-lands-co-development-project-with-lockheed-martin-to-strengthen-cybersecurity-for-government-and-defense-environments-302939296.html

SOURCE Nozomi Networks

Continue Reading

Technology

Europe records the world’s highest deepfake fraud rate as AI agents and cross-border networks rise

Published

on

By

Fraud attempts have fallen 28% worldwide but attacks are more complex in every region, Sumsub finds in its annual Identity Fraud Report

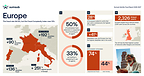
LONDON, Nov. 17, 2026 /PRNewswire/ — Sumsub, the first AI-powered trust infrastructure, has released its annual Identity Fraud Report 2026-2027, revealing that Europe now has the highest detected deepfake rate in the world at a rise of 41%, the sharpest increase of any region.

Globally, fraud is falling in volume but becoming harder to stop as fraudsters band together to create complex, AI-assisted schemes that easily outpace modern detection standards. The report finds that global fraud rates fell by 28% in 2026, but deepfake fraud rates nonetheless increased by 31% worldwide.

This has led Sumsub to the creation of the Fraud Complexity Index* (FCI), which scores each confirmed case on the tooling, coordination and number of techniques behind it. In its first year, the index finds that fraud complexity rose from 2.1 to 2.2 globally, indicating that fraud is concentrating, combining more techniques, automation and people. This is most evident in Europe, where fraud fell 8% while complexity rose by 13%.

Key findings

While global fraud may be falling in volume, it is becoming harder to detect, more coordinated and further reaching.

Nearly three in four (74%) European consumers experienced fraud in the past year. Of those, 44% lost money, and 38% of those recovered nothing.65% of European businesses reported confirmed or suspected fraud.Over half (53%) of businesses worldwide detected or suspected fraud involving an AI agent, yet only 37% could verify who authorised an agent to act.A third of global businesses hit by fraud say at least a quarter of their cases were linked to a wider fraud network, but only 21% use network analysis to detect these links.The UK hosts Europe’s third-highest number of organised fraud networks, despite UK fraud rates falling 40%, pointing to fewer but more coordinated groupsOver a quarter (28%) of Europeans asked to verify their age online used a workaround, the highest of any region. Over one in ten (13%) were wrongly rejected, and a further 13% abandoned the check.Fraud rate freefall may give platforms a false sense of security: Complex fraud is rising in online media (30%), e-commerce (19%) and crypto (16%). 

Fraud networks are spreading across borders

Globally, around one in 50 people who pass verification are later linked to a detected fraud network, as accounts are sold, taken over or opened on a fraudster’s behalf. Fraud networks are groups of orchestrated accounts linked by shared devices, identities, payment details, and documents. They buy, hack or coercively take accounts from legitimate people to pass checks without any apparent wrongdoing.

Europe’s largest detected network linked 2,326 such users across 28 countries. The UK recorded the third-highest number of detected networks in the region, after Bulgaria and Ukraine. The UK’s Fraud Strategy states more than two-thirds of fraud cases have an international element, making it difficult for businesses or regulators to detect them or understand the size of the operation.

Fraudsters dismiss underused AI defences with AI fakes

AI-generated deepfake fraud increased in over three quarters of markets analysed, with Italy seeing the sharpest rise at a 251% increase. The relationship between overall fraud volume and deepfakes was clearest in regions where fraud fell: Switzerland (fraud down 30%, deepfakes up 192%) and Portugal (down 18%, up 136%).

European defences haven’t kept pace. European businesses name AI-generated documents – which now make up 5% of all confirmed fraud – as the main reason fraud is harder to detect with current automated processes, yet document checks still remain their most common control. 

Just 26% of European businesses use biometric or liveness verification, less than a quarter use device intelligence (23%), and only 16% use network analysis. Under one in five run fraud data, tools and casework in a single system (19%), so the signals that would expose a complex fraud attempt remain siloed.

AI agents: cautious adoption yet wide exposure

Despite over half of European businesses reporting they detected or suspected fraud involving an AI agent this year, just 27% of European businesses verify who authorises an agent, and most worryingly, only 10% can suspend or revoke its access.

Globally, 49% of all agentic fraud incidents involved a legitimate agent manipulated by malicious instructions, and in 30% the agent made a purchase, payment or transfer.

Europe is slower than most to adopt with only 27% using agents internally this year, but such agents give fraudsters express access to the most sensitive and volatile business systems. Fewer than one in four businesses worldwide log what their agents do, so most wouldn’t know of such an incident before it’s too late.

This summer saw several high-profile incidents of AI models going beyond their intended limits. Meta saw its agentic account recovery process for Instagram hacked, affecting up to 20,000 accounts, shortly after an OpenAI model broke out of its test environment to hack the AI platform Hugging Face. Without intervention, we should expect to see cases like this accelerate as agentic processes become more common in the workplace.

Age checks remain unpopular and unprepared for upcoming regulation

62% of parents and guardians surveyed say a child in their care experienced online harm in the past 12 months, most often because of impersonation (28%). 

Support for age checks is lowest in Europe (68%), compared to 74% of global respondents, and only 9% of consumers worldwide said a check made a service feel safer. After a failed or intrusive check, 17% of consumers switched to another service, and 13% went looking for one without checks.

In the UK, the Online Safety Act has required highly effective age checks since July 2025, and this will soon apply broadly across Europe following the EU KIDS Act.

Regulators are looking for ways to make checks less intrusive. The EU’s European Digital Identity Framework states that members must offer a European Digital Identity Wallet by 24 December 2026. Wallets let a user prove they are over 18 without handing over their full identity; Sumsub found that 31% of consumers would adopt it for this reason. But with only 27% of European consumers having used a government digital ID wallet, and most member states not expected to meet the December deadline, platforms can’t afford to rely on any single solution to meet demand.

“What gives me confidence about Europe is that the direction of travel is becoming much clearer,” said Jacob Thompson, VP of Sales at Sumsub. “Regulation is still complex, but we’re moving toward more harmonised rules around payments, identity and financial crime, rather than every market solving the same problem differently. Fraudsters will obviously keep adapting, but over time that should make it easier for businesses to build controls that work consistently across borders instead of patching together a different approach country by country.”

To read the full Identity Fraud Report 2026-2027, visit: https://sumsub.com/identity-fraud-report-2026/

About Sumsub

Sumsub is the first AI-powered trust infrastructure for compliance operations at scale. By bringing together identity and business verification, fraud prevention, ongoing monitoring, and risk management in a single layer, Sumsub enables companies to streamline operations, adapt to evolving regulations, enter new markets, and grow securely.

Recognised as a Leader by Gartner, Forrester, and IDC, Sumsub combines seamless integration with advanced fraud prevention to deliver industry-leading performance. Sumsub also invests in responsible AI innovation through its AI Academic Program, forming alliances with top academia and institutions globally to enhance the world’s resilience against AI-powered fraud.

Methodology

Sumsub’s Identity Fraud Report 2026-2027 compares internal identity verification and user activity data from 2025 and 2026. In some cases, it includes data from 2021 to 2024 to show longer-term trends. It covers 5.8 million fraud samples and includes only jurisdictions with more than 15,000 verification attempts in the reporting period. The data has been aggregated and anonymised, and all graphs and infographics are based on the data of consenting customers.

Sumsub conducted its Fraud Exposure Survey in August 2026. It gathered responses from more than 1,400 fraud and risk professionals and more than 1,500 consumers in 21 markets across North America, Latin America, Europe, Asia, Africa and the Middle East.

*About the Fraud Complexity Index (FCI): The Fraud Complexity Index measures the technical and operational complexity of the average fraud case. Each recorded case is scored according to the types of distinct techniques used, from traditional forgery to fake liveness simulation. Attacks using more tooling, automation and coordination score higher, as do cases involving combinations of distinct techniques.

View original content to download multimedia:https://www.prnewswire.co.uk/news-releases/europe-records-the-worlds-highest-deepfake-fraud-rate-as-ai-agents-and-cross-border-networks-rise-302941828.html

Continue Reading

Technology

More Than Half of Organizations Using AI Agents Run Them Across Multiple Platforms, Nudge Security Research Finds

Published

on

By

Second edition of “AI Adoption in Practice” report shows AI risk now lives on the Workforce Edge, where employees choose, connect, and use technology, as agents and AI integrations reach company data outside traditional security controls

AUSTIN, Texas, Nov. 17, 2026 /PRNewswire/ — Nudge Security, the leading innovator in SaaS and AI security governance, today announced its research report, AI Adoption in Practice 2026: Beyond the Approved List, which provides insights into what AI adoption in the workforce looks like in practice. Based on anonymized and aggregated telemetry from Nudge Security customer environments, the report found that AI agents are already running inside the business platforms employees use every day, and that AI tools connect directly to company data in ways traditional security controls don’t see.

“The platforms your teams use every day are becoming agent platforms, whether or not anyone decided they should be. The project tracker, the CRM, the chat tool: each one now lets an employee build something that acts on their behalf, with their access, continuously. The question for security teams is no longer whether that’s allowed. It’s whether they know it’s happening,” says Nudge Security Cofounder and CTO Jaime Blasco. “We expect this to get harder, not easier. Every platform your teams use is adding agent-building features, and each one makes it simpler to hand an agent a person’s access. That means the gap between what an organization’s identity provider knows about and what’s actually acting on its data is going to keep widening.”

Key findings include:

Many agents run on employees’ identities. Among organizations using AI agents, half run seven or more, and more than 4 in 10 run more than 10. They’re spread across business platforms like project management, CRM, and automation tools. Agents built inside these platforms often act through the employee who created them, with that person’s access to company data.AI connects directly to the most sensitive systems. 74% of organizations have at least one Anthropic integration and 67% have an OpenAI integration. These reach email, code, chat, and documents, and they move data without passing any inspection point.Core AI models are treated like a commodity. At least 91% of organizations have both OpenAI and Anthropic. Anthropic’s adoption rose from 77.8% in January to 94.5%.AI adoption extends well beyond the big two. Twelve different AI tools now each appear in more than half of organizations, up from five in January. Counting every AI tool in each environment, half of organizations have had 27 or more show up as of October 2026.AI in the browser sees what employees see. Among organizations with at least one AI browser extension, 67% have Grammarly and 65% have Claude. Both can read the content of the pages employees open.Company data flows into AI as part of everyday work. 18% of observed prompts include pasted content or an uploaded file, compared with 17% in the first report. Prompts are also reaching more AI tools: OpenAI still receives more than half of all observed prompts, but its share fell from 67% to 55% as more prompts go to other tools.

The report is based on anonymized and aggregated telemetry collected across Nudge Security customer environments. Rather than relying on surveys or self-reported usage, it reflects direct observation of AI tools, integrations, browser extensions, agents, and how employees interact with AI. Adoption, integration, and browser extension data is as of September 2026, and agent data is as of October 2026. The dataset includes organizations in Nudge Security’s first report, AI Adoption in Practice: What Enterprise Usage Data Reveals About Risk and Governance, as well as customers who have joined since.

What Security Leaders Can Do Now
Visibility alone will not reduce AI risk, so the report recommends focusing on where exposure is actually growing.

First, inventory agents where they are built in the business platforms teams already use, and identify who created each one and whose access it runs on.Second, treat OAuth grants as a first-class risk by reviewing which AI tools employees have connected to, what each grant can read, and revoking any that are no longer needed.Third, stop relying on the approved list as the main control and shift attention from which tools are present to what they are connected to.Fourth, review AI browser extensions that can read page content and set clear expectations for which are appropriate for sensitive work.Fifth and final, bring the workforce into the decision. Employees often know why they connected a tool, so ask, guide, and reserve the strictest response for the decisions that carry the most risk.

Download the full report: https://www.nudgesecurity.com/content/ai-adoption-in-practice-nov-2026.

About Nudge Security
Nudge Security is the AI and SaaS security platform for the Workforce Edge. Every day, employees sign up for apps, connect AI tools, and grant access to company data on their own. Together, those decisions create the Workforce Edge: an attack surface security teams own, even when they can’t see it. Nudge finds those apps, accounts, and connections from the first signup and prioritizes them by risk, with AI agents taking repetitive review work off the team’s plate. Then it goes straight to the employee behind the decision—to ask why, guide the next step, or fix the issue—and steps in directly when the risk is real. Security and IT teams govern the workforce’s technology without blocking productivity. Nudge Security was founded in 2021 by Russell Spitler and Jaime Blasco and is backed by Ballistic Ventures, Forgepoint Capital, Cerberus Ventures, and Squadra Ventures.

Media Contact:
Danielle Ostrovsky
Hi-Touch PR
Ostrovsky@Hi-TouchPR.com

View original content to download multimedia:https://www.prnewswire.com/news-releases/more-than-half-of-organizations-using-ai-agents-run-them-across-multiple-platforms-nudge-security-research-finds-302940529.html

SOURCE Nudge Security

Continue Reading

Trending