
Technology
Autohome Inc. Announces Unaudited Second Quarter and Interim 2024 Financial Results

Published
2 years agoon
By

BEIJING, July 31, 2024 /PRNewswire/ — Autohome Inc. (NYSE: ATHM; HKEX: 2518) (“Autohome” or the “Company”), the leading online destination for automobile consumers in China, today announced its unaudited financial results for the three months and six months ended June 30, 2024.
Second Quarter 2024 Highlights[1]
Net revenues in the second quarter of 2024 were RMB1,872.6 million (US$257.7 million), compared to RMB1,833.0 million in the corresponding period of 2023.Net income attributable to Autohome in the second quarter of 2024 was RMB524.8 million (US$72.2 million), compared to RMB504.7 million in the corresponding period of 2023, while net income attributable to ordinary shareholders in the second quarter of 2024 was RMB509.7 million (US$70.1 million), compared to RMB491.2 million in the corresponding period of 2023.Adjusted net income attributable to Autohome (Non-GAAP)[2] in the second quarter of 2024 was RMB572.4 million (US$78.8 million), compared to RMB569.5 million in the corresponding period of 2023.
Mr. Tao Wu, Chief Executive Officer of Autohome, stated, “We are pleased to deliver another solid quarter, highlighted by sustained growth in net revenues, a substantial increase in user traffic, and remarkable progress made in our innovative business initiatives. On content, our diverse and high-quality offerings, bolstered by our strong IP content matrix, has worked to consistently expand our user base and enhance user engagement. According to QuestMobile, our number of average mobile daily active users grew by 8.3% year-over-year, reaching 67.91 million in June, underscoring our leading position in the automotive media vertical. For our innovative businesses, we launched our Satellite Plan in May, a strategic initiative to establish satellite stores in lower-tier cities adjacent to flagship Autohome Space stores. This initiative will accelerate our network expansion, facilitating deeper penetration into broader geographical markets. Looking ahead, we remain committed to exploring new business areas and leveraging Ping An’s resources to enhance our long-term industry competitiveness.”
Mr. Craig Yan Zeng, Chief Financial Officer of Autohome, added, “Our focus on innovative businesses has led to robust growth in our data products and new energy vehicle (“NEV”) business, with double-digit year-over-year increases in quarterly revenues. We have maintained a healthy balance sheet while driving the development of our businesses and fulfilling our commitment to provide stable shareholder returns. Moving forward, we will continue to focus on areas of emerging growth while maintaining stringent cost controls to ensure long-term shareholder value.”
Unaudited Second Quarter 2024 Financial Results
Net Revenues
Net revenues in the second quarter of 2024 were RMB1,872.6 million (US$257.7 million), compared to RMB1,833.0 million in the corresponding period of 2023.
Media services revenues were RMB432.9 million (US$59.6 million) in the second quarter of 2024, compared to RMB532.0 million in the corresponding period of 2023.Leads generation services revenues were RMB820.3 million (US$112.9 million) in the second quarter of 2024, compared to RMB759.6 million in the corresponding period of 2023.Online marketplace and others revenues were RMB619.4 million (US$85.2 million) in the second quarter of 2024, compared to RMB541.4 million in the corresponding period of 2023.
Cost of Revenues
Cost of revenues was RMB346.1 million (US$47.6 million) in the second quarter of 2024, compared to RMB330.2 million in the corresponding period of 2023. Share-based compensation expense included in cost of revenues in the second quarter of 2024 was RMB1.9 million (US$0.3 million), compared to RMB1.8 million in the corresponding period of 2023.
Operating Expenses
Operating expenses were RMB1,185.3 million (US$163.1 million) in the second quarter of 2024, compared to RMB1,228.1 million in the corresponding period of 2023.
Sales and marketing expenses were RMB752.5 million (US$103.6 million) in the second quarter of 2024, compared to RMB824.1 million in the corresponding period of 2023, due primarily to a decrease in marketing and promotional expenses. Share-based compensation expenses included in sales and marketing expenses in the second quarter of 2024 were RMB10.1 million (US$1.4 million), compared to RMB12.3 million in the corresponding period of 2023.General and administrative expenses were RMB117.6 million (US$16.2 million) in the second quarter of 2024, compared to RMB91.0 million in the corresponding period of 2023. Share-based compensation expenses included in general and administrative expenses in the second quarter of 2024 were RMB10.4 million (US$1.4 million), compared to RMB8.9 million in the corresponding period of 2023.Product development expenses were RMB315.2 million (US$43.4 million) in the second quarter of 2024, compared to RMB313.0 million in the corresponding period of 2023. Share-based compensation expenses included in product development expenses in the second quarter of 2024 were RMB18.8 million (US$2.6 million), compared to RMB18.7 million in the corresponding period of 2023.
Operating Profit
Operating profit was RMB412.4 million (US$56.7 million) in the second quarter of 2024, compared to RMB341.5 million in the corresponding period of 2023.
Income Tax Expense
Income tax expense was RMB102.2 million (US$14.1 million) in the second quarter of 2024, compared to RMB35.8 million in the corresponding period of 2023. The increase in income tax expense was primarily attributable to a withholding tax related to the declared cash dividend plan for 2024 and beyond, and the tax filing adjustments of the previous year.
Net Income Attributable to Autohome
Net income attributable to Autohome was RMB524.8 million (US$72.2 million) in the second quarter of 2024, compared to RMB504.7 million in the corresponding period of 2023.
Net Income Attributable to Ordinary Shareholders and Earnings per Share/ADS
Net income attributable to ordinary shareholders was RMB509.7 million (US$70.1 million) in the second quarter of 2024, compared to RMB491.2 million in the corresponding period of 2023. Basic and diluted earnings per share (“EPS”) were RMB1.05 (US$0.14) and RMB1.05 (US$0.14), respectively, in the second quarter of 2024, compared to basic and diluted EPS of RMB1.00 and RMB1.00, respectively, in the corresponding period of 2023. Basic and diluted earnings per ADS were RMB4.20 (US$0.58) and RMB4.19 (US$0.58), respectively, in the second quarter of 2024, compared to basic and diluted earnings per ADS of RMB3.99 and RMB3.98, respectively, in the corresponding period of 2023.
Adjusted Net Income Attributable to Autohome (Non-GAAP) and Non-GAAP EPS/ADS
Adjusted net income attributable to Autohome (Non-GAAP) was RMB572.4 million (US$78.8 million) in the second quarter of 2024, compared to RMB569.5 million in the corresponding period of 2023. Non-GAAP basic and diluted EPS were RMB1.18 (US$0.16) and RMB1.18 (US$0.16), respectively, in the second quarter of 2024, compared to non-GAAP basic and diluted EPS of RMB1.16 and RMB1.15, respectively, in the corresponding period of 2023. Non-GAAP basic and diluted earnings per ADS were RMB4.72 (US$0.65) and RMB4.71 (US$0.65), respectively, in the second quarter of 2024, compared to non-GAAP basic and diluted earnings per ADS of RMB4.62 and RMB4.61, respectively, in the corresponding period of 2023.
Balance Sheet and Cash Flow
As of June 30, 2024, the Company had cash and cash equivalents and short-term investments of RMB23.47 billion (US$3.23 billion). Net cash provided by operating activities in the second quarter of 2024 was RMB452.0 million (US$62.2 million).
Employees
The Company had 5,078 employees as of June 30, 2024, including 1,755 employees from TTP Car, Inc.
Conference Call Information
The Company will host an earnings conference call at 8:00 a.m. U.S. Eastern Time on Wednesday, July 31, 2024 (8:00 p.m. Beijing Time on the same day).
Please register in advance of the conference call using the registration link provided below. Upon registering, each participant will receive a set of participant dial-in numbers and a personal PIN, which will be used to join the conference call.
Registration Link: https://register.vevent.com/register/BIfd7c475745884d119c4c12c24ed8f0f5
Please use the conference access information to join the call 10 minutes before the call is scheduled to begin.
Additionally, a live and archived webcast of the conference call will be available at https://ir.autohome.com.cn and a replay of the webcast will be available following the session.
About Autohome
Autohome Inc. (NYSE: ATHM; HKEX: 2518) is the leading online destination for automobile consumers in China. Its mission is to relentlessly reduce auto industry decision-making and transaction costs driven by advanced technology. Autohome provides occupationally generated content, professionally generated content, user-generated content, and AI-generated content, a comprehensive automobile library, and extensive automobile listing information to automobile consumers, covering the entire car purchase and ownership cycle. The ability to reach a large and engaged user base of automobile consumers has made Autohome a preferred platform for automakers and dealers to conduct their advertising campaigns. Further, the Company’s dealer subscription and advertising services allow dealers to market their inventory and services through Autohome’s platform, extending the reach of their physical showrooms to potentially millions of internet users in China and generating sales leads for them. The Company offers sales leads, data analysis, and marketing services to assist automakers and dealers with improving their efficiency and facilitating transactions. Further, through its websites and mobile applications, it also provides other value-added services, including auto financing, auto insurance, used car transactions, and aftermarket services. For further information, please visit https://www.autohome.com.cn/.
Safe Harbor Statement
This press release contains statements that may constitute “forward-looking” statements pursuant to the “safe harbor” provisions of the U.S. Private Securities Litigation Reform Act of 1995. These forward-looking statements can be identified by terminology such as “will”, “expects”, “anticipates”, “future”, “intends”, “plans”, “believes”, “estimates” and similar statements. Among other things, Autohome’s business outlook, Autohome’s strategic and operational plans and quotations from management in this announcement contain forward-looking statements. Autohome may also make written or oral forward-looking statements in its periodic reports to the Securities and Exchange Commission (“SEC”), in announcements made on the website of The Stock Exchange of Hong Kong Limited (the “Hong Kong Stock Exchange”), in its annual report to shareholders, in press releases and other written materials and in oral statements made by its officers, directors or employees to third parties. Statements that are not historical facts, including statements about Autohome’s beliefs and expectations, are forward-looking statements. Forward-looking statements involve inherent risks and uncertainties. A number of factors could cause actual results to differ materially from those contained in any forward-looking statement, including but not limited to the following: Autohome’s goals and strategies; Autohome’s future business development, results of operations and financial condition; the expected growth of the online automobile advertising market in China; Autohome’s ability to attract and retain users and advertisers and further enhance its brand recognition; Autohome’s expectations regarding demand for and market acceptance of its products and services; competition in the online automobile advertising industry; relevant government policies and regulatory environment of China; fluctuations in general economic and business conditions in China and assumptions underlying or related to any of the foregoing. Further information regarding these and other risks is included in Autohome’s filings with the SEC and announcements on the website of the Hong Kong Stock Exchange. All information provided in this press release is as of the date of this press release, and Autohome does not undertake any obligation to update any forward-looking statement, except as required under applicable law.
Use of Non-GAAP Financial Measures
To supplement net income presented in accordance with U.S. GAAP, we use Adjusted Net Income attributable to Autohome, Non-GAAP basic and diluted EPS and earnings per ADS, Adjusted net margin and Adjusted EBITDA as non-GAAP financial measures. We define Adjusted Net Income attributable to Autohome as net income attributable to Autohome excluding share-based compensation expenses, amortization of intangible assets resulting from business acquisition, investment loss relating to non-operating impact of a write-down of the initial investment in a financial product, and loss/(gain) pickup of equity method investments, with all the reconciliation items adjusted for related income tax effects. We define non-GAAP basic and diluted EPS as Adjusted Net Income attributable to Autohome divided by the basic and diluted weighted average number of ordinary shares. We define non-GAAP basic and diluted earnings per ADS as Adjusted Net Income attributable to Autohome divided by the basic and diluted weighted average number of ADSs. We define Adjusted net margin as Adjusted Net Income attributable to Autohome divided by total net revenues. We define Adjusted EBITDA as net income attributable to Autohome before income tax expense, depreciation expenses of property and equipment, amortization expenses of intangible assets and share-based compensation expenses. We present these non-GAAP financial measures because they are used by our management to evaluate our operating performance, in addition to net income prepared in accordance with U.S. GAAP. We believe these non-GAAP financial measures are important to help investors understand our operating and financial performance, compare business trends among different reporting periods on a consistent basis and assess our core operating results, as they exclude certain non-cash charges or items that are non-operating in nature. The use of the above non-GAAP financial measures has certain limitations as they excluded certain items that have been and will continue to be incurred in the future, but such items should be considered in the overall evaluation of our results. These non-GAAP financial measures should be considered in addition to financial measures prepared in accordance with GAAP, but should not be considered a substitute for, or superior to, financial measures prepared in accordance with GAAP. For more information on these non-GAAP financial measures, please see the table captioned “Unaudited Reconciliation of non-GAAP and GAAP Results” set forth at the end of this press release.
For investor and media inquiries, please contact:
Autohome Inc.
Investor Relations
Sterling Song
Investor Relations Director
Tel: +86-10-5985-7483
E-mail: ir@autohome.com.cn
Christensen China Limited
Suri Cheng
Tel: +86-185-0060-8364
E-mail: suri.cheng@christensencomms.com
AUTOHOME INC.
UNAUDITED CONDENSED CONSOLIDATED STATEMENTS OF OPERATIONS DATA
(Amount in thousands, except per share / per ADS data)
For three months ended June 30,
For six months ended June 30,
2023
2024
2023
2024
RMB
RMB
US$
RMB
RMB
US$
Net revenues:
Media services
532,005
432,858
59,563
893,473
760,289
104,619
Leads generation services
759,635
820,271
112,873
1,440,269
1,546,694
212,832
Online marketplace and others
541,394
619,425
85,236
1,032,921
1,174,636
161,635
Total net revenues
1,833,034
1,872,554
257,672
3,366,663
3,481,619
479,086
Cost of revenues
(330,227)
(346,102)
(47,625)
(670,441)
(646,994)
(89,029)
Gross profit
1,502,807
1,526,452
210,047
2,696,222
2,834,625
390,057
Operating expenses:
Sales and marketing expenses
(824,081)
(752,543)
(103,553)
(1,347,197)
(1,393,819)
(191,796)
General and administrative
expenses
(90,979)
(117,564)
(16,177)
(240,135)
(267,109)
(36,755)
Product development expenses
(313,010)
(315,230)
(43,377)
(637,376)
(651,297)
(89,621)
Total operating expenses
(1,228,070)
(1,185,337)
(163,107)
(2,224,708)
(2,312,225)
(318,172)
Other operating income, net
66,772
71,279
9,808
133,160
166,072
22,852
Operating profit
341,509
412,394
56,748
604,674
688,472
94,737
Interest and investment income,
net
202,813
189,053
26,015
427,828
409,027
56,284
(Loss)/income from equity method
investments
(1,690)
4,640
638
(33,125)
(44,493)
(6,122)
Income before income taxes
542,632
606,087
83,401
999,377
1,053,006
144,899
Income tax expense
(35,796)
(102,165)
(14,058)
(90,477)
(170,566)
(23,471)
Net income
506,836
503,922
69,343
908,900
882,440
121,428
Net (income)/loss attributable to
noncontrolling interests
(2,102)
20,839
2,868
1,336
36,820
5,067
Net income attributable to
Autohome
504,734
524,761
72,211
910,236
919,260
126,495
Accretion of mezzanine equity
(38,686)
(42,687)
(5,874)
(75,185)
(84,358)
(11,608)
Accretion attributable to
noncontrolling interests
25,164
27,599
3,798
48,913
54,547
7,506
Net income attributable to
ordinary shareholders
491,212
509,673
70,135
883,964
889,449
122,393
Earnings per share attributable to
ordinary shareholders
Basic
1.00
1.05
0.14
1.79
1.84
0.25
Diluted
1.00
1.05
0.14
1.79
1.83
0.25
Earnings per ADS attributable
to ordinary shareholders (one
ADS equals for four ordinary
shares)
Basic
3.99
4.20
0.58
7.17
7.34
1.01
Diluted
3.98
4.19
0.58
7.15
7.32
1.01
Weighted average shares used to compute
earnings per share attributable to ordinary
shareholders:
Basic
492,534,428
484,860,625
484,860,625
492,927,049
484,569,763
484,569,763
Diluted
493,624,704
486,591,693
486,591,693
494,261,429
486,029,303
486,029,303
AUTOHOME INC.
UNAUDITED RECONCILIATIONS OF NON-GAAP AND GAAP RESULTS
(Amount in thousands, except per share / per ADS data)
For three months ended June 30,
For six months ended June 30,
2023
2024
2023
2024
RMB
RMB
US$
RMB
RMB
US$
Net income attributable to
Autohome
504,734
524,761
72,211
910,236
919,260
126,495
Plus: income tax expense
37,136
103,505
14,243
93,157
173,247
23,840
Plus: depreciation of property and
equipment
42,259
31,750
4,369
90,197
65,284
8,983
Plus: amortization of intangible
assets
10,798
9,650
1,328
21,638
19,300
2,656
EBITDA
594,927
669,666
92,151
1,115,228
1,177,091
161,974
Plus: share-based compensation
expenses
41,628
41,188
5,668
87,813
89,495
12,315
Adjusted EBITDA
636,555
710,854
97,819
1,203,041
1,266,586
174,289
Net income attributable to
Autohome
504,734
524,761
72,211
910,236
919,260
126,495
Plus: amortization of intangible assets
resulting from business acquisition
10,722
9,583
1,319
21,444
19,166
2,637
Plus: share-based compensation
expenses
41,628
41,188
5,668
87,813
89,495
12,315
Plus: investment loss arising from one of
financial products[3]
14,532
2,906
400
8,719
2,906
400
Plus: loss/(gain) on equity method
investments, net
1,690
(4,640)
(638)
33,125
44,493
6,122
Plus: tax effects of the adjustments
(3,840)
(1,360)
(187)
(8,360)
(8,954)
(1,232)
Adjusted net income attributable
to Autohome
569,466
572,438
78,773
1,052,977
1,066,366
146,737
Net income attributable to
Autohome
504,734
524,761
72,211
910,236
919,260
126,495
Net margin
27.5 %
28.0 %
28.0 %
27.0 %
26.4 %
26.4 %
Adjusted net income attributable
to Autohome
569,466
572,438
78,773
1,052,977
1,066,366
146,737
Adjusted net margin
31.1 %
30.6 %
30.6 %
31.3 %
30.6 %
30.6 %
Non-GAAP earnings per share
Basic
1.16
1.18
0.16
2.14
2.20
0.30
Diluted
1.15
1.18
0.16
2.13
2.19
0.30
Non-GAAP earnings per ADS
(one ADS equals for four ordinary
shares)
Basic
4.62
4.72
0.65
8.54
8.80
1.21
Diluted
4.61
4.71
0.65
8.52
8.78
1.21
Weighted average shares used to
compute non-GAAP earnings
per share:
Basic
492,534,428
484,860,625
484,860,625
492,927,049
484,569,763
484,569,763
Diluted
493,624,704
486,591,693
486,591,693
494,261,429
486,029,303
486,029,303
AUTOHOME INC.
UNAUDITED CONDENSED CONSOLIDATED BALANCE SHEET
(Amount in thousands, except as noted)
As of
December 31,
As of June 30,
2023
2024
RMB
RMB
US$
ASSETS
Current assets
Cash and cash equivalents
4,996,353
3,881,952
534,174
Restricted cash
126,794
107,964
14,856
Short-term investments
18,552,354
19,593,011
2,696,088
Accounts receivable, net
1,472,489
1,350,567
185,844
Amounts due from related parties, current
16,439
30,233
4,160
Prepaid expenses and other current assets
360,559
423,411
58,263
Total current assets
25,524,988
25,387,138
3,493,385
Non-current assets
Restricted cash, non-current
5,000
5,000
688
Property and equipment, net
200,860
194,067
26,705
Goodwill and intangible assets, net
4,143,968
4,106,799
565,114
Long-term investments
448,341
403,848
55,571
Deferred tax assets
295,598
295,598
40,676
Amounts due from related parties, non-current
16,048
13,839
1,904
Other non-current assets
200,928
157,102
21,619
Total non-current assets
5,310,743
5,176,253
712,277
Total assets
30,835,731
30,563,391
4,205,662
LIABILITIES AND EQUITY
Current liabilities
Accrued expenses and other payables
2,932,227
2,227,929
306,573
Advance from customers
105,379
102,623
14,121
Deferred revenue
801,581
1,156,160
159,093
Income tax payable
227,260
338,306
46,552
Amounts due to related parties
24,572
31,878
4,387
Dividends payable
984,332
493,881
67,960
Total current liabilities
5,075,351
4,350,777
598,686
Non-current liabilities
Other liabilities
89,187
58,622
8,067
Deferred tax liabilities
497,955
472,481
65,016
Total non-current liabilities
587,142
531,103
73,083
Total liabilities
5,662,493
4,881,880
671,769
MEZZANINE EQUITY
Convertible redeemable noncontrolling interests
1,758,933
1,843,291
253,645
EQUITY
Total Autohome shareholders’ equity
23,928,187
24,443,437
3,363,529
Noncontrolling interests
(513,882)
(605,217)
(83,281)
Total equity
23,414,305
23,838,220
3,280,248
Total liabilities, mezzanine equity and equity
30,835,731
30,563,391
4,205,662
UNAUDITED RECONCILIATION BETWEEN U.S. GAAP AND IFRS
The unaudited condensed consolidated statements of income for the six month ended June 30, 2024 and the unaudited condensed consolidated balance sheets as of June 30, 2024 (collectively, the “Unaudited Interim Financial Statements”) of Autohome Inc., its subsidiaries,the variable interest entities, and the subsidiaries of the variable interest entities (collectively, the “Company”) are prepared in accordance with the accounting principles generally accepted in the United States of America (the “U.S. GAAP”), and the differences between U.S. GAAP and the International Financial Reporting Standards (the “IFRS”) issued by the International Accounting Standards Board (together, the “Reconciliation Statement”) have been disclosed in the Appendix — Unaudited Reconciliation Between U.S. GAAP and IFRS attached herein.
PricewaterhouseCoopers, the auditor of the Company in Hong Kong, has performed a limited assurance engagement on the Reconciliation Statement in accordance with International Standards on Assurance Engagements 3000 (Revised) “Assurance Engagements Other Than Audits or Reviews of Historical Financial Information” issued by the International Auditing and Assurance Standards Board.
Appendix
The Unaudited Interim Financial Statements of the Company are prepared in accordance with U.S. GAAP, which differ in certain respects from IFRS. The effects of material differences between the Unaudited Interim Financial Statements prepared under U.S. GAAP and IFRS are as follows:
Reconciliation of unaudited condensed consolidated statements of income:
For six months ended June 30,
2023
2024
RMB
RMB
Reconciliation of net income in the consolidated statements of income
(in thousands)
Net income as reported under U.S. GAAP
908,900
882,440
IFRS adjustments:
Preferred shares (Note a)
(64,555)
126,264
Leases (Note b)
(521)
(285)
Share-based compensations (Note c)
(36,304)
(16,419)
Net income as reported under IFRS
807,520
992,000
Reconciliation of unaudited condensed consolidated balance sheets:
As of
December 31,
As of
June 30,
2023
2024
RMB
RMB
Reconciliation of total equity in the consolidated balance sheets
(in thousands)
Total equity as reported under U.S. GAAP
23,414,305
23,838,220
IFRS adjustments:
Preferred shares (Note a)
1,182,018
1,409,285
Leases (Note b)
(9,536)
(9,821)
Total equity as reported under IFRS
24,586,787
25,237,684
Notes:
Basis of Preparation
The Directors of the Company are responsible for preparation of the Reconciliation Statement in accordance with the relevant requirements of the Hong Kong Listing Rules. The Reconciliation Statement was prepared based on the Company’s unaudited interim condensed consolidated financial information for the six months ended June 30, 2024 prepared under U.S. GAAP, with adjustments made (if any) thereto in arriving at the unaudited financial information of the Company prepared under IFRS. The adjustments reflect the differences between the Company’s accounting policies under U.S. GAAP and IFRS.
(a) Preferred Shares
Under U.S. GAAP, the preferred shares of the Company are accounted for as mezzanine equity, which is subsequently accreted to the amount which equals to redemption value of each series of preferred shares.
Under IFRS, the preferred shares, which are redeemable at the option of the holder, represent a financial liability. And the financial liability is measured at fair value and changes in the fair value are reflected in the consolidated statements of comprehensive income. The amount of change in the fair value of the financial liability that is attributable to changes in the credit risk of the liability shall be presented in the consolidated balance sheets as accumulated other comprehensive income; the remaining amount of change in the fair value of the liability shall be presented in the consolidated statements of comprehensive income.
Accordingly, the reconciliation includes a fair value profit change of RMB64.56 million (negative) and RMB126.26 million recognized in the consolidated statements of comprehensive income for each of the six months ended June 30, 2023 and 2024, respectively. The reconciliation also includes the difference between mezzanine equity under U.S. GAAP and financial liabilities under IFRS of RMB1,182.02 million and RMB1,409.29 million as at December 31, 2023 and June 30, 2024, respectively.
(b) Leases
For operating leases under U.S. GAAP, the subsequent measurement of the lease liability is based on the present value of the remaining lease payments using the discount rate determined at lease commencement, while the right-of-use asset is remeasured at the amount of the lease liability, adjusted for the remaining balance of any lease incentives received, cumulative prepaid or accrued rents, unamortized initial direct costs and any impairment. This treatment under U.S. GAAP results in straight line expense being incurred over the lease term, as opposed to IFRS which generally yields a “front-loaded” expense with more expense recognized in earlier years of the lease.
Accordingly, the reconciliation includes an expenses difference recognized in the consolidated statements of comprehensive income of RMB0.52 million and RMB0.29 million for each of the six months ended June 30, 2023 and 2024, respectively. The reconciliation also includes a difference in total equity of RMB9.54 million and RMB9.82 million as at December 31, 2023 and June 30, 2024, respectively.
(c) Share-based Compensation
Under U.S. GAAP, the Company has elected to recognize compensation expense using the straight-line method for all share-based awards granted with service conditions that have a graded vesting schedule. For awards with performance condition and multiple service dates, if the performance conditions are all set at inception and independent for each year, each tranche is accounted for as a separate award with its own requisite service period. Compensation cost is recognized over the respective requisite service period separately for each separately-vesting tranche as though each tranche of the award is, in substance, a separate award.
Under IFRS, the accelerated method is required to recognize compensation expense for all employee equity awards granted with graded vesting.
Accordingly, the reconciliation includes an expense recognition difference in the consolidated statements of comprehensive income of RMB36.30 million and RMB16.42 million for each of the six months ended June 30, 2023 and 2024, respectively.
[1] The reporting currency of the Company is Renminbi (“RMB”). For readers’ convenience, certain amounts throughout the release are presented in US dollars (“US$”). Unless otherwise noted, all conversions from RMB to US$ are translated at the noon buying rate of US$1.00 to RMB7.2672 on June 28, 2024 in the City of New York for cable transfers of RMB as certified for customs purposes by the Federal Reserve Bank of New York. No representation is made that the RMB amounts could have been, or could be, converted into US$ at such rate.
[2] For more information on this and other non-GAAP financial measures, please see the section captioned “Use of Non-GAAP Financial Measures” and the tables captioned “Unaudited Reconciliations of Non-GAAP and GAAP Results” set forth at the end of this release.
[3] It represented the loss of an investment with fair value below its initial investment, which was recognized at “interest and investment income, net”. The impact was considered to be not directly related to the Company’s operating activities.
View original content:https://www.prnewswire.com/news-releases/autohome-inc-announces-unaudited-second-quarter-and-interim-2024-financial-results-302210891.html
SOURCE Autohome Inc.

You may like
Technology
Truth-seeking: the Turning Point in Zunyi
Published
20 minutes agoon
October 19, 2026By

BEIJING, Oct. 18, 2026 /PRNewswire/ — An interview from China.org.cn with Wang Xiaohui and David Ferguson on the Long March:
Wang Xiaohui:
When you march toward your ideals but encounter repeated setbacks and failures, do you have the courage to pause, reflect on the path taken, and chart a new way forward?
David Ferguson:
If I continually encountered setbacks on the road to my ideals, I would stop and reflect seriously on whether my methods need adjusted or my direction needs corrected. This is a matter of being honest with oneself and honest about one’s shortcomings. Granted, this requires as much courage as setting out in the first place — because what you have to confront is not only the judgment of others, but your own ingrained reluctance to accept that you might have got it wrong.
Wang Xiaohui:
The waters of the Xiangjiang River ran crimson in the winter of 1934.
To cover the Red Army’s main force as they crossed the river, Chen Shuxiang, then Commander of the 34th Division of the Fifth Army Corps, led his troops to fight against vastly superior enemy forces until they ran out of ammunition and supplies. Severely wounded, Chen was captured alive. On the way to the enemy camp to be paraded for merit, Chen seized a moment of the enemy’s unawareness, tore his own intestines through his abdominal wound, and died a heroic death. He was only 29 years old.
The Battle of Xiangjiang River was the deadliest campaign for the Red Army since the start of the Long March. In less than two months, their troop strength plummeted from over 86,000 to just over 30,000.
At that critical moment, doubts and discontent among officers and soldiers with the military leadership peaked.
During the fights against the previous four Kuomintang (KMT) “encirclement” campaigns, the Red Army adopted Mao Zedong’s strategy of “luring the enemy in deep.” With flexible tactics in mobile warfare, the Red Army worked miracles of defeating superior enemies time and again. Yet, the tide turned completely during the KMT’s fifth “encirclement.”
At that time, the CPC was a branch of the Communist International (Comintern). After 1927, the Comintern instructed the CPC to adopt an urban-centered path in its revolution, for it was how Russia’s October Revolution had achieved victory. Affected by this directive, during the Fifth Counter-Campaign against “Encirclement and Suppression”, Bo Gu and Otto Braun, who held actual command of the Red Army, insisted on launching offensive operations to seize major cities.
Otto Braun also mechanically applied European conventional warfare tactics, forcing the Red Army into rigid positional and fortress battles. In the Battle of Guangchang, the poorly equipped Red Army fought head-on against enemy tanks and artillery on open terrain, resulting in more than 5,000 casualties, about one-fourth of all participating troops.
Successive military defeats forced the Red Army to launch a strategic shift. However, Bo Gu and Otto Braun insisted that everything be evacuated, including heavy equipment: printing presses, currency-making machines, and arms-manufacturing facilities… When crossing the Xiangjiang River, troops were slowed down by these cumbersome supplies, and numerous soldiers even laid down their lives for protecting these assets. Chen Shuxiang and his 34th Division wrote the gravest footnote to this bloody sacrifice.
By the banks of the Xiangjiang River, the spark of hope in the eyes of the Red Army soldiers was nearly quenched by the cold water. Could the rigid foreign doctrines truly guide the Red Army and China’s revolution? What path lay ahead?
History often unfolds in paradoxes: when all hope seems lost, a historical turning point is quietly emerging.
After the Battle of Xiangjiang River, Mao firmly opposed the original plan drafted by Bo Gu and Otto Braun to march towards Hunan. Instead, he proposed to advance to Guizhou where enemy defenses were weak. There, the Red Army broke through the natural barrier of the Wujiang River, and captured Zunyi. On Jan. 15, 1935, the CPC Central Committee convened an enlarged Political Bureau meeting in an old mansion, later known to the world as the Zunyi Conference.
Inside the modest living room on the second floor, a charcoal brazier expelled the winter chill. The CPC leadership sat around a long table to review why the Red Army had fallen into passive positions since 1933. Bo Gu attributed the defeats solely to the enemy’s overwhelming strength, while other leading officials like Zhou Enlai and Zhang Wentian pinpointed flawed military command as the fundamental cause.
Mao Zedong also made a pivotal speech.
As a revolutionary forged in rural base-area practice, Mao always sought truth from real combat experience. Citing victories from the previous four counter-“encirclement” campaigns, he rebutted Bo Gu’s opinions and criticized the flawed strategies of passive defense and abandoning mobile warfare tactics. In plain, incisive language, he pointed out that “the soldiers also needed to march, eat and sleep,” and that Braun’s rigid commands were completely divorced from the realities of China’s revolutionary warfare.
Throughout the whole meeting, Bo Gu remained dejected; Braun sat near the door and lit one cigarette after another. Never had these “true Bolsheviks” faced such rigorous criticism before.
The intensive confrontation lasted three days. In the end, Mao Zedong was elected to the leadership of the Red Army and the CPC Central Committee, putting an end to the wrong guidance. This marked a life-and-death turning point in the history of the Communist Party of China.
The Zunyi Conference freed the CPC from the Comintern’s intervention, enabling the Party to independently master the destiny of China’s revolution. From then on, the Red Army turned peril into safety, and China’s revolution emerged from despair toward new life.
David Ferguson:
When faced with major setbacks, the Communist Party of China was not crushed; instead, it demonstrated the courage to confront and correct its own mistakes, thereby turning adversity into opportunity. For any ruling party, this kind of courage is exceptionally rare.
Throughout history, guided by the principle of seeking truth from facts, the Party has always corrected errors, updated systems and adjusted course. By doing so, it has guaranteed social progress. This is precisely the secret to success that has made the Party resilient and invincible.
Wang Xiaohui:
No grand undertaking advances without setbacks. Faced with obstacles and defeats, the CPC demonstrated extraordinary courage and wisdom. They sought truth from facts, corrected wrong courses, and led the revolution towards triumph.
The Zunyi Conference Spirit, embodied in firm conviction, adherence to truth, independence and self-reliance, solidarity and unity, was forged amid blood and fire. It has shaped the unique spiritual character of the CPC. In the years that followed, these timeless values continued to evolve and sustain the Party in the face of trials and challenges, endowing it with enduring vitality.
China Mosaic
http://www.china.org.cn/video/node_7230027.htm
Faith: The Spark Born by the Yudu Riverside
http://www.china.org.cn/2026-10/17/content_118737624.shtml
View original content to download multimedia:https://www.prnewswire.com/news-releases/truth-seeking-the-turning-point-in-zunyi-302912139.html
SOURCE China.org.cn
Technology
Truth-seeking: the Turning Point in Zunyi
Published
20 minutes agoon
October 19, 2026By

BEIJING, Oct. 18, 2026 /PRNewswire/ — An interview from China.org.cn with Wang Xiaohui and David Ferguson on the Long March:
Wang Xiaohui:
When you march toward your ideals but encounter repeated setbacks and failures, do you have the courage to pause, reflect on the path taken, and chart a new way forward?
David Ferguson:
If I continually encountered setbacks on the road to my ideals, I would stop and reflect seriously on whether my methods need adjusted or my direction needs corrected. This is a matter of being honest with oneself and honest about one’s shortcomings. Granted, this requires as much courage as setting out in the first place — because what you have to confront is not only the judgment of others, but your own ingrained reluctance to accept that you might have got it wrong.
Wang Xiaohui:
The waters of the Xiangjiang River ran crimson in the winter of 1934.
To cover the Red Army’s main force as they crossed the river, Chen Shuxiang, then Commander of the 34th Division of the Fifth Army Corps, led his troops to fight against vastly superior enemy forces until they ran out of ammunition and supplies. Severely wounded, Chen was captured alive. On the way to the enemy camp to be paraded for merit, Chen seized a moment of the enemy’s unawareness, tore his own intestines through his abdominal wound, and died a heroic death. He was only 29 years old.
The Battle of Xiangjiang River was the deadliest campaign for the Red Army since the start of the Long March. In less than two months, their troop strength plummeted from over 86,000 to just over 30,000.
At that critical moment, doubts and discontent among officers and soldiers with the military leadership peaked.
During the fights against the previous four Kuomintang (KMT) “encirclement” campaigns, the Red Army adopted Mao Zedong’s strategy of “luring the enemy in deep.” With flexible tactics in mobile warfare, the Red Army worked miracles of defeating superior enemies time and again. Yet, the tide turned completely during the KMT’s fifth “encirclement.”
At that time, the CPC was a branch of the Communist International (Comintern). After 1927, the Comintern instructed the CPC to adopt an urban-centered path in its revolution, for it was how Russia’s October Revolution had achieved victory. Affected by this directive, during the Fifth Counter-Campaign against “Encirclement and Suppression”, Bo Gu and Otto Braun, who held actual command of the Red Army, insisted on launching offensive operations to seize major cities.
Otto Braun also mechanically applied European conventional warfare tactics, forcing the Red Army into rigid positional and fortress battles. In the Battle of Guangchang, the poorly equipped Red Army fought head-on against enemy tanks and artillery on open terrain, resulting in more than 5,000 casualties, about one-fourth of all participating troops.
Successive military defeats forced the Red Army to launch a strategic shift. However, Bo Gu and Otto Braun insisted that everything be evacuated, including heavy equipment: printing presses, currency-making machines, and arms-manufacturing facilities… When crossing the Xiangjiang River, troops were slowed down by these cumbersome supplies, and numerous soldiers even laid down their lives for protecting these assets. Chen Shuxiang and his 34th Division wrote the gravest footnote to this bloody sacrifice.
By the banks of the Xiangjiang River, the spark of hope in the eyes of the Red Army soldiers was nearly quenched by the cold water. Could the rigid foreign doctrines truly guide the Red Army and China’s revolution? What path lay ahead?
History often unfolds in paradoxes: when all hope seems lost, a historical turning point is quietly emerging.
After the Battle of Xiangjiang River, Mao firmly opposed the original plan drafted by Bo Gu and Otto Braun to march towards Hunan. Instead, he proposed to advance to Guizhou where enemy defenses were weak. There, the Red Army broke through the natural barrier of the Wujiang River, and captured Zunyi. On Jan. 15, 1935, the CPC Central Committee convened an enlarged Political Bureau meeting in an old mansion, later known to the world as the Zunyi Conference.
Inside the modest living room on the second floor, a charcoal brazier expelled the winter chill. The CPC leadership sat around a long table to review why the Red Army had fallen into passive positions since 1933. Bo Gu attributed the defeats solely to the enemy’s overwhelming strength, while other leading officials like Zhou Enlai and Zhang Wentian pinpointed flawed military command as the fundamental cause.
Mao Zedong also made a pivotal speech.
As a revolutionary forged in rural base-area practice, Mao always sought truth from real combat experience. Citing victories from the previous four counter-“encirclement” campaigns, he rebutted Bo Gu’s opinions and criticized the flawed strategies of passive defense and abandoning mobile warfare tactics. In plain, incisive language, he pointed out that “the soldiers also needed to march, eat and sleep,” and that Braun’s rigid commands were completely divorced from the realities of China’s revolutionary warfare.
Throughout the whole meeting, Bo Gu remained dejected; Braun sat near the door and lit one cigarette after another. Never had these “true Bolsheviks” faced such rigorous criticism before.
The intensive confrontation lasted three days. In the end, Mao Zedong was elected to the leadership of the Red Army and the CPC Central Committee, putting an end to the wrong guidance. This marked a life-and-death turning point in the history of the Communist Party of China.
The Zunyi Conference freed the CPC from the Comintern’s intervention, enabling the Party to independently master the destiny of China’s revolution. From then on, the Red Army turned peril into safety, and China’s revolution emerged from despair toward new life.
David Ferguson:
When faced with major setbacks, the Communist Party of China was not crushed; instead, it demonstrated the courage to confront and correct its own mistakes, thereby turning adversity into opportunity. For any ruling party, this kind of courage is exceptionally rare.
Throughout history, guided by the principle of seeking truth from facts, the Party has always corrected errors, updated systems and adjusted course. By doing so, it has guaranteed social progress. This is precisely the secret to success that has made the Party resilient and invincible.
Wang Xiaohui:
No grand undertaking advances without setbacks. Faced with obstacles and defeats, the CPC demonstrated extraordinary courage and wisdom. They sought truth from facts, corrected wrong courses, and led the revolution towards triumph.
The Zunyi Conference Spirit, embodied in firm conviction, adherence to truth, independence and self-reliance, solidarity and unity, was forged amid blood and fire. It has shaped the unique spiritual character of the CPC. In the years that followed, these timeless values continued to evolve and sustain the Party in the face of trials and challenges, endowing it with enduring vitality.
China Mosaic
http://www.china.org.cn/video/node_7230027.htm
Faith: The Spark Born by the Yudu Riverside
http://www.china.org.cn/2026-10/17/content_118737624.shtml
View original content to download multimedia:https://www.prnewswire.com/news-releases/truth-seeking-the-turning-point-in-zunyi-302912139.html
SOURCE China.org.cn
Technology
GMIF2026: AI Inference Powers the “Token Factory” and Drives System-Level Rethinking of Memory & Storage
Published
20 minutes agoon
October 19, 2026By
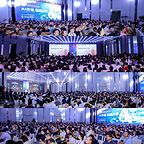
SHENZHEN, China, Oct. 18, 2026 /PRNewswire/ — The 5th GMIF Innovation Summit (Global Memory Innovation Forum 2026, GMIF2026) recently concluded at the Renaissance Shenzhen Bay Hotel. Co-hosted by the Shenzhen Memory Industry Association (SMIA) and the School of Integrated Circuits at Peking University, the summit was themed “The Future Built on AI Memory and Storage.” Now in its fifth edition, GMIF has grown from a regional industry gathering into a benchmark for the global semiconductor memory ecosystem, with diversified programs including keynote sessions, an investment forum, product exhibitions, a global livestream, and a golf friendship match, all centered on the value of memory and storage in the token economy and the AI inference era.
In the opening remarks by Rixin Sun, President of Shenzhen Memory Industry Association (SMIA), GMIF’s growth over five consecutive editions was traced from its early days to today. As a platform for global exchange, GMIF is built around the memory value chain, linking wafer IDMs and players in controllers, modules, packaging and testing, equipment and materials, and end applications to promote technical exchange, supply-demand matching, and ecosystem cooperation.
President Sun noted that as AI evolves from generative to agentic, inference efficiency, data scheduling, and system coordination have become shared priorities. Collaboration across the value chain is no longer a traditional supply-demand relationship, but a deeper partnership built around workload requirements, joint product definition, and scenario validation. Looking ahead, GMIF will pursue a more specialized and differentiated format, connecting memory companies with AI compute and end-application players worldwide.
Capital Meets Technology: Memory & Storage Moves to the Center of AI Infrastructure
As AI shifts from model training to large-scale commercial inference, the token is becoming a new unit of value. Inference demands low latency, high concurrency, and sustained throughput, which places memory and storage bandwidth, capacity, and energy efficiency among the variables that shape overall system efficiency and cost.
Daniel Yen of Morgan Stanley projected that global data center capital expenditure will stay strong in the coming years, with more than half of cloud data center capex expected to go to memory & storage (excluding HBM) by 2027. Yen identified six innovation paths to overcome the “memory wall” challenge: process migration, design changes, advanced packaging, memory peripherals, PIM/CIM, and new materials.
Prof. Yimao Cai, Dean of the School of Integrated Circuits at Peking University, pointed out that HBM remains central to high-end AI compute, but yield, cost, and thermal constraints limit broader adoption. NAND-based high-bandwidth technologies such as HBF have become a major research focus because of their cost advantage, and hybrid multi-media architectures could balance performance, capacity, and cost for deploying models with hundreds of billions of parameters.
Kevin Yoon, CVP & CTO of Samsung Memory China at Samsung Electronics, described how agents are generating massive KV cache demand and driving rapid iteration of tiered storage, citing Samsung’s work on Z-NAND, PCIe Gen6 SSDs, and ultra-high-capacity data center SSDs. Maya Zhang, Senior Director of Product Marketing from Sandisk, called this the first year of the “inference boom.” As inference reaches commercial scale, AI data centers are shifting from cost centers to value and capacity centers, and the evaluation framework is moving from TCO to TVO. NAND is becoming a strategic core component of AI, and the SSD is becoming a “token battery” that greatly improves the economics of the industry through token reuse.
Solidigm and Arm focused on the evolution of system-level design. Benny Ni, GAR Sales VP at Solidigm, noted high-capacity QLC SSDs are being adopted faster, and that memory offloading has moved from an alternative to a core design paradigm for data centers, while liquid cooling has become a prerequisite for unlocking high-end storage performance. John Xavier Lionel, Head of Global Storage Business at Arm, shared competition in the AI era is shifting from simply chasing higher TOPS to building a more efficient system balance among compute, memory, storage, and data movement. Arm’s cloud-edge-device continuum framework balances power, capacity, bandwidth, latency, security, and cost constraints at each tier, so that “the right AI workload runs in the right place.”
Moving from the cloud to the edge, Stanley Huang, AVP of Silicon Motion, stressed that devices are the ultimate carrier of AI experiences and that intelligent storage directly determines real-world device performance. Its PerformaShape technology allocates resources flexibly across different agents and greatly improves read/write consistency.
Sam Sun, Chairman of BIWIN, explained that large-scale AI inference is extending memory demand from data centers to the edge and endpoints, where differing needs in capacity, performance, power, size, and reliability are pushing storage from general-purpose specifications toward deep matching with specific scenarios and platforms. Drawing on full-stack capabilities from media selection and controller and firmware development to advanced packaging, testing, and volume delivery, BIWIN works closely with customers, platforms, and chip makers to tailor products to each use case, shortening development and validation cycles and improving system space, energy efficiency, and performance.
Token Factories Move Enterprise AI from Pilot to Production
As the token becomes the core unit of value, producing tokens efficiently and at low cost has become a shared challenge for enterprise AI adoption worldwide, and the “token factory” is emerging as a new industry paradigm. Tao Zhou, General Manager of the Server Division of Lenovo ISG China, said 80% of enterprises have deployed at least one type of agent, yet fewer than 40% of projects can scale and deliver positive ROI. Lenovo has built a full-stack “token factory” paradigm spanning data governance, compute optimization, and security management to address this.
A solid token factory depends on underlying storage media and architecture. Numbers Law’s PMD (Parallel Magnetic Drive) technology and NEXWISE‘s “KuberCloud” token factory solution contributed to full-stack capability from hardware to compute scheduling and model operations. Infplane, Maxio, and Genstoraige lowered the deployment threshold for large on-device models through AI SSD tiered offloading and memory expansion.
Real-world applications are also deepening. SYNCORE has achieved vehicle-cloud embodied intelligence across the whole vehicle. Dify, with its private agent architecture, and Paratera, with its MaaS compute service platform, are moving AI from basic compute supply toward deeper industry intelligence services, accelerating the industrialization of AI.
40 Companies Showcase the Core of the AI Memory & Storage Chain
The concurrent exhibition brought together 40 companies across the full value chain, from memory chips and controllers to compute servers, AIDC services, packaging and testing equipment, and system applications, presenting the latest advances in AI memory and storage from around the world.
Memory IDMs and controller makers led with new products. SanDisk featured its iNAND AT EU752 automotive UFS 4.1, SN861 enterprise NVMe SSD, and BiCS8 QLC NAND. Silicon Motion introduced the SM8466 PCIe Gen6 16-channel controller and the SM2524XT controller for edge SSDs. Maxio, YEESTOR, and other Chinese controller makers showed flagship PCIe Gen4/Gen5 and UFS controllers with enhanced LDPC, a sign that China’s controller portfolio is taking shape and benchmarking itself against leading international standards.
Compute and token factory solutions were another highlight. Lenovo exhibited its WenTian series of AI training-and-inference integrated servers. NEXWISE presented its full-stack token factory hardware and software, with heterogeneous compute management and token-based billing. Paratera showed its intelligent compute cloud and supercomputing cloud services, and Numbers Law demonstrated its PMD (Parallel Magnetic Drive) technology, aimed at sharply raising HDD IOPS and throughput. Infplane, Genstoraige, and Quanxing introduced KV cache offload and memory-fusion AI SSD solutions that use storage to share the compute load and significantly cut deployment costs.
Module makers and full-scenario solution providers brought a wide range of products. BIWIN exhibited enterprise SSDs, CXL products, wide-temperature industrial storage, and embedded products spanning AI cloud, edge, and device. KingSpec, POWEV, Topdisk, Barycn, Jielong Storage, HIKSEMI, and others presented industrial-grade, automotive-grade, server, and embedded product families, demonstrating strong volume production and reliable delivery.
Equipment, testing, and materials suppliers rounded out the floor. Attach Point, MICROVIEW, and Maxwell Technologies showed die attach and bonding equipment for 2.5D/3D advanced packaging. OKN Technology, Acroview Technology, Hongjingwei, and Tytantest introduced test and burn-in systems covering SSD, DRAM, and NAND that can accurately reproduce high-load AI I/O scenarios. Hemei Jingyi and Silergy brought storage IC package substrates and dedicated power management ICs. From advanced packaging equipment to test validation to core components, this supporting ecosystem lays the manufacturing foundation for volume production of AI memory and storage and for Chinese suppliers expanding overseas.
GMIF2026 Annual Awards Unveiled: Global Memory & Storage Leaders Build an Open, Collaborative Ecosystem
To recognize companies that have made outstanding contributions to the memory and storage value chain, the summit established the GMIF2026 Annual Awards, which cover memory, compute, packaging and testing equipment, test systems, and end applications across AI infrastructure, and were judged on technological innovation, industry contribution, market service, and real-world results.
Honorees, including Samsung Semiconductor, SanDisk, Solidigm, CXMT, Arm, Lenovo, Dify, Silicon Motion, Infplane, Genstoraige, Numbers Law, Paratera, SYNCORE, NEXWISE, Maxio Technology, BIWIN, Topdisk, KingSpec, POWEV, Quanxing Technology, OKN Technology, Attach Point, COMIX, Barycn, LKAUTO, Maxwell Technologies, Hemei Jingyi, Silergy, Heyan Technology, ExTripod Electronics, UNIMOS, GBAT, and Tytantest, were recognized for standout achievements in technology breakthroughs, product deployment, ecosystem building, and the industry chain.
Global Livestream and Golf Friendship Match Extend the Boundaries of Industry Cooperation
To join the global ecosystem and expand international cooperation, the summit featured a special Global Livestream by Memory Brands on LinkedIn, Facebook, and YouTube. Eight brands presented online: BIWIN, Silicon Motion, Quanxing Technology, OKN Technology, KingSpec, Maxwell Technologies, ExTripod Electronics, and Silergy. They gave overseas audiences a direct look at China’s latest advances in memory chips, advanced packaging, test systems, and other core AI infrastructure components, connecting technology standards, supply chain resources, and market demand across regions.
The momentum carried into the next day. The GMIF2026 “BIWIN Cup” golf friendship match, exclusively sponsored by BIWIN, brought senior executives from across the global memory value chain to the course. After a day of intensive discussion at the main forum, the setting was more relaxed, but the conversations among technology, capital, and markets carried on, helping speed practical cooperation across borders and sectors.
Conclusion
Across the GMIF program, one message stood out: global AI competition is moving beyond the “single-point era” of peak GPU performance into a “system-level era” that integrates storage, compute, networking, and software. In the token economy, memory and storage is shedding its auxiliary role and becoming the strategic foundation of AI inference.
This edition of GMIF brought together capital outlook, frontier technology, product innovation, real-world practice, and ecosystem collaboration, and, with the awards, livestream, and networking events, carried the conversation from ideas to product showcases, overseas exposure, and business deals. Going forward, GMIF will stay focused on the industry’s frontier issues and connect key players across the global memory value chain, promoting joint standards, technology development, and market expansion to open a new chapter for the AI memory and storage industry.
About GMIF
Global Memory Innovation Forum (GMIF) is a premier annual gathering that connects the global memory and storage community. Featuring diverse activities including keynote speeches, roundtable dialogues, supply-demand match-making, product showcases, industry rankings, awards programs, and global livestreaming, GMIF brings together key enterprises across the memory and storage chain, technical experts, terminal companies and investment institutions to exchange insights, build partnerships, and create business opportunities. Learn more about GMIF, please visit https://www.gmif.com.cn/. Follow us on LinkedIn, YouTube and Facebook.
Media Contact:
Carina Gu, wenjing.gu@gmif.com.cn
View original content to download multimedia:https://www.prnewswire.com/news-releases/gmif2026-ai-inference-powers-the-token-factory-and-drives-system-level-rethinking-of-memory–storage-302912123.html
SOURCE Shenzhen Memory Industry Association (SMIA)

Truth-seeking: the Turning Point in Zunyi
Truth-seeking: the Turning Point in Zunyi

GMIF2026: AI Inference Powers the “Token Factory” and Drives System-Level Rethinking of Memory & Storage

Send Rakhi to UK swiftly with UK Gifts Portal

Whiteboard Series with NEAR | Ep: 45 Joel Thorstensson from ceramic.network

Nullmax and Renesas Forge Strategic Partnership to Deliver Competitive ADAS Solutions for the Global Market

Why You Should Build on #NEAR – Co-founder Illia Polosukhin at CV Labs
Whiteboard Series with NEAR | Ep: 45 Joel Thorstensson from ceramic.network

NEAR End of Year Town Hall 2021: The Open Web World, MetaBUILD 2 Hackathon and 2021 recap
Trending
-

 Coin Market5 days ago
‘Bunker mode’ won’t protect your crypto, critics say
-

 Technology5 days ago
Solidion Technology Reaffirms Commitment to Address Growing Energy Storage Needs of AI Data Centers
-

 Technology5 days ago
TVU Networks to Showcase Connected Live Video Ecosystem at Broadcast India Show 2026
-

 Technology5 days ago
PEGATRON Brings AI Infrastructure from Design to Deployment at OCP Global Summit 2026
-

 Coin Market4 days ago
Organizations join forces to fight Illinois crypto tax, after 6-month pause
-

 Technology5 days ago
SUS ENVIRONMENT Draws International Attention for Transforming Waste-to-Energy Plants into Sustainable Urban Assets
-

 Coin Market5 days ago
Can crypto users trust the supply chain behind hardware wallets?
-

 Technology5 days ago
A $2.1 Trillion Wellness Industry Never Built a Daily Practice for Black Children. So This Atlanta Family Did.