Connect with us

Technology

The Infrared Thermometers Market is projected to grow by USD 1.05 Billion (2024-2028), driven by rising contagious and chronic diseases, with AI driving market transformation – Technavio

Published

on

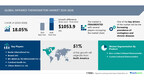
NEW YORK, Oct. 9, 2024 /PRNewswire/ — Report with the AI impact on market trends – The Global Infrared Thermometers Market size is estimated to grow by USD 1.05 billion from 2024-2028, according to Technavio. The market is estimated to grow at a CAGR of over 18.05%  during the forecast period. Increasing prevalence of contagious and chronic diseases is driving market growth, with a trend towards increasing demand from airports for passengers screening  However, high cost of infrared thermometers  poses a challenge.Key market players include Baxter International Inc., Bioseb SAS, BPL MEDICAL TECHNOLOGIES Pvt. Ltd., Cardinal Health Inc., Citizen Watch Co. Ltd., Contec Medical Systems Co. Ltd., Exergen Corp., Fluke Corp., Geratherm Medical AG, Helen of Troy Ltd., HORIBA Ltd., Microlife Corp., OMRON Corp., Optris GmbH, Paul Hartmann AG, PCE Holding GmbH, PositiveID Corp., Radiant, Thermo Fisher Scientific Inc., Vesync Co. Ltd, and Vive Health.

AI-Powered Market Evolution Insights. Our comprehensive market report ready with the latest trends, growth opportunities, and strategic analysis- View your snapshot now

Forecast period

2024-2028

Base Year

2023

Historic Data

2017 – 2021

Segment Covered

Product (Non-contact infrared thermometers and Contact infrared thermometers), Type (Handled thermometer and Fixed-mount thermometer), and Geography (North America, Europe, Asia, and Rest of World (ROW))

Region Covered

North America, Europe, Asia, and Rest of World (ROW)

Key companies profiled

Baxter International Inc., Bioseb SAS, BPL MEDICAL TECHNOLOGIES Pvt. Ltd., Cardinal Health Inc., Citizen Watch Co. Ltd., Contec Medical Systems Co. Ltd., Exergen Corp., Fluke Corp., Geratherm Medical AG, Helen of Troy Ltd., HORIBA Ltd., Microlife Corp., OMRON Corp., Optris GmbH, Paul Hartmann AG, PCE Holding GmbH, PositiveID Corp., Radiant, Thermo Fisher Scientific Inc., Vesync Co. Ltd, and Vive Health

Key Market Trends Fueling Growth

The airline industry is experiencing significant growth due to increasing air passenger traffic. However, this growth brings challenges, including the need to maintain security protocols and minimize capacity constraints. The ongoing COVID-19 pandemic has added a new dimension to airport operations, necessitating stringent hygiene measures. Infrared thermometers have become essential tools in detecting fever, a symptom of COVID-19, among passengers. Airline companies worldwide are implementing their use at checkpoints to prevent disease transmission. This trend is expected to continue, increasing the demand for infrared thermometers in the airport sector during the forecast period. 

The Infrared Thermometers market is witnessing significant growth due to the rising prevalence of infectious diseases such as Malaria and Dengue. Non-contact thermometers are increasingly popular as they offer the convenience of measuring temperature without physical contact. The market caters to various measurement points including ear and forehead, and offers multifunction options for temperature monitoring in healthcare applications. Distribution channels include hospital pharmacies, retail pharmacies, online stores, and medical, veterinary, and dairy protein-based product sectors. With the increasing focus on health safety concerns, the market is expanding into sectors like environmental monitoring, climate change, water bodies, and advanced technologies. Price-sensitive markets and health safety concerns are driving the demand for eco-friendly and energy-efficient products. Smart technologies and digital services are also gaining traction in the eCommerce sector and telemedicine. The market serves various industries including hospitals, clinics, medical facilities, automobile sector, and marine life. Trends like temperature monitoring for fever detection, population health, acute diseases, and healthcare applications continue to fuel market growth. Despite these opportunities, challenges like eye damage from infrared radiation and mercury thermometers’ environmental impact remain concerns. 

Insights on how AI is driving innovation, efficiency, and market growth- Request Sample!

Market Challenges

The global infrared thermometers market is experiencing steady growth, yet its expansion is being hindered by the high cost of these devices, particularly in price-sensitive markets such as developing and emerging economies. Infrared thermometers are preferred by industrial users due to their accuracy and wide temperature measurement range. However, their high price point, which ranges from USD300 to USD1,100, limits their adoption in developing countries. In contrast, liquid-filled thermometers, priced between USD1 and USD15, are widely used in healthcare settings in these markets. The price difference between the two types of thermometers is significant, making infrared thermometers a less viable option for budget-conscious consumers. This price disparity may negatively impact the growth of the infrared thermometers market during the forecast period.The Infrared Thermometers market is experiencing significant growth due to increasing demand for non-contact temperature measurement solutions in various sectors. Ear and forehead thermometers remain popular in healthcare applications, particularly for fever detection in hospitals, clinics, and medical facilities. However, challenges exist in acute disease outbreaks, where temperature monitoring becomes crucial. Beyond healthcare, infrared thermometers find applications in environmental monitoring, energy efficiency, automobile sector, and even crowd screening. Advanced technologies like smart sensors and eco-friendly digital services are driving market expansion. Price-sensitive markets require cost-effective solutions, while health safety concerns necessitate eye damage protection and adherence to regulations. Infrared thermometers are used for temperature measurement in various industries, including land temperature monitoring for climate change studies, water bodies, and even industrial processes like bearing cap temperatures, motor winding temperatures, and process piping temperatures. However, challenges persist in accuracy issues, especially when compared to mercury thermometers. Vibration instruments and other non-infrared temperature measuring devices also pose competition. Market growth is further influenced by trends like telemedicine, eCommerce sector, and marine life temperature monitoring.

Insights into how AI is reshaping industries and driving growth- Download a Sample Report

Segment Overview 

This infrared thermometers market report extensively covers market segmentation by

Product 1.1 Non-contact infrared thermometers1.2 Contact infrared thermometersType 2.1 Handled thermometer2.2 Fixed-mount thermometerGeography 3.1 North America3.2 Europe3.3 Asia3.4 Rest of World (ROW)

1.1 Non-contact infrared thermometers-  The non-contact segment of the global infrared thermometers market is currently leading, projected to expand significantly during the forecast period. These thermometers, which analyze temperature through electromagnetic radiation without physical contact, are widely used in various sectors. In industries such as process, electrical, food and beverage, agriculture, and mechanical, non-contact infrared thermometers are preferred for their ability to provide fast spot temperature analysis and suitability for applications where contact thermometers are not easily applicable. In the healthcare sector, the demand for non-contact infrared thermometers is particularly high due to their contactless feature, which is crucial in preventing the transmission of contagious diseases like COVID-19, Ebola, and influenza. Additionally, non-contact infrared thermometers are used in the production of glass syringes and sterilization of glass bottles. The increasing prevalence of contagious diseases and the need for temperature checks to combat their spread are driving the growth of the global infrared thermometers market.

Download complimentary Sample Report to gain insights into AI’s impact on market dynamics, emerging trends, and future opportunities- including forecast (2024-2028) and historic data (2017 – 2021) 

Research Analysis

The Infrared Thermometers market is witnessing significant growth due to the increasing prevalence of infectious diseases such as malaria and dengue. These thermometers, which use advanced infrared technology to measure body temperature without physical contact, have gained popularity in various sectors. They are widely used in medical and veterinary applications, as well as for measuring the temperature of dairy protein-based products and water bodies. Infrared Thermometers come in various forms, including ear, forehead, and multifunction models. Distribution channels include hospital pharmacies, retail pharmacies, and online stores. The market is driven by factors such as energy efficiency, automobile sector demands, price-sensitive markets, and health safety concerns. However, there are concerns about eye damage from prolonged use and the need for smart technologies and eco-friendly products to mitigate these risks. Advanced technologies like energy efficiency and smart features are also key trends in the market.

Market Research Overview

The Infrared Thermometers market encompasses a wide range of applications, primarily in the healthcare sector for measuring body temperature in the diagnosis and monitoring of infectious diseases such as malaria and dengue. These non-contact thermometers can be used at measurement points on the ear or forehead, offering convenience and hygiene benefits. The market also caters to multifunction thermometers for various temperature monitoring needs. Distribution channels include hospital pharmacies, retail pharmacies, online stores, medical, veterinary, and dairy protein-based product industries. In healthcare applications, hospitals, clinics, and medical facilities utilize infrared thermometers for fever detection and patient care. The market extends to environmental monitoring, measuring land temperature, climate change, water bodies, and advanced technologies for energy efficiency and automobile sectors. Price-sensitive markets, health safety concerns, and eco-friendly products influence market growth. However, potential issues like accuracy and eye damage from prolonged use necessitate the development of smart technologies and digital services in the eCommerce sector and telemedicine. The market also caters to temperature monitoring in various industries, including marine life, sensors, mercury thermometers, vibration instruments, bearing cap temperatures, motor winding temperatures, and process piping temperatures. Crowd screening is another application, ensuring health safety at large events.

Table of Contents:

1 Executive Summary
2 Market Landscape
3 Market Sizing
4 Historic Market Size
5 Five Forces Analysis
6 Market Segmentation

ProductNon-contact Infrared ThermometersContact Infrared ThermometersTypeHandled ThermometerFixed-mount ThermometerGeographyNorth AmericaEuropeAsiaRest Of World (ROW)

7 Customer Landscape
8 Geographic Landscape
9 Drivers, Challenges, and Trends
10 Company Landscape
11 Company Analysis
12 Appendix

About Technavio

Technavio is a leading global technology research and advisory company. Their research and analysis focuses on emerging market trends and provides actionable insights to help businesses identify market opportunities and develop effective strategies to optimize their market positions.

With over 500 specialized analysts, Technavio’s report library consists of more than 17,000 reports and counting, covering 800 technologies, spanning across 50 countries. Their client base consists of enterprises of all sizes, including more than 100 Fortune 500 companies. This growing client base relies on Technavio’s comprehensive coverage, extensive research, and actionable market insights to identify opportunities in existing and potential markets and assess their competitive positions within changing market scenarios.

Contacts

Technavio Research
Jesse Maida
Media & Marketing Executive
US: +1 844 364 1100
UK: +44 203 893 3200
Email: media@technavio.com
Website: www.technavio.com/

View original content to download multimedia:https://www.prnewswire.com/news-releases/the-infrared-thermometers-market-is-projected-to-grow-by-usd-1-05-billion-2024-2028-driven-by-rising-contagious-and-chronic-diseases-with-ai-driving-market-transformation–technavio-302269674.html

SOURCE Technavio

Continue Reading
Click to comment

Leave a Reply

Your email address will not be published. Required fields are marked *

Technology

10x Genomics Reports First Quarter 2026 Financial Results

Published

on

By

PLEASANTON, Calif., May 7, 2026 /PRNewswire/ — 10x Genomics, Inc. (Nasdaq: TXG), a leader in single cell and spatial biology, today reported financial results for the first quarter ended March 31, 2026.

Recent Updates

Revenue was $150.8 million for the first quarter of 2026, representing a 3% decrease over the corresponding period of 2025. Excluding $16.8 million related to one-time license and royalty revenue in the first quarter of 2025, revenue increased 9% over the corresponding period of 2025.Launched Atera, a new platform to redefine how biology is measured and understood. Atera was engineered to deliver spatial whole-transcriptome analysis with single-cell sensitivity at unprecedented scale. The Company expects to start shipping Atera in the second half of 2026.Announced a partnership with Bioptimus, a global AI biotech company, to launch STELA, a multinational spatial data generation initiative to create foundational datasets connecting underlying biology with disease outcomes. The initiative is starting this effort on our Xenium platform and plans to expand to Atera over time.Ended the first quarter of 2026 with cash and cash equivalents and marketable securities of $539.8 million, representing a $112.9 million increase from March 31, 2025.

“We had a solid start to the year, with double-digit growth in Single Cell consumables reaction volumes and double-digit growth in Spatial consumables revenue,” said Serge Saxonov, Co-founder and CEO of 10x Genomics. “The biggest highlight is our recent launch of Atera, which represents the most significant product introduction in our history. We are extremely encouraged by the extraordinary early customer response.”

First Quarter 2026 Financial Results

Revenue was $150.8 million for the first quarter of 2026, a 3% decrease from the corresponding period of 2025. Excluding $16.8 million related to a patent litigation settlement recognized in the first quarter of 2025, revenue increased 9% over the corresponding period of 2025.

Gross margin was 70% for the first quarter of 2026, as compared to 68% for the corresponding prior year period. The increase in gross margin was primarily due to lower warranty costs and lower inventory write-downs, partially offset by a decrease in license and royalty revenue reflecting a non-recurring royalty benefit recognized in the first quarter of 2025.

Operating expenses were $123.2 million for the first quarter of 2026, a 15% decrease from $144.8 million for the corresponding prior year period. The decrease was primarily driven by lower outside legal expenses and personnel expenses, partially offset by a non-recurring gain on settlement of $9.2 million recognized in the first quarter of 2025.

Operating loss was $17.0 million for the first quarter of 2026, as compared to operating loss of $39.3 million for the corresponding prior year period.

Net loss was $13.5 million for the first quarter of 2026, as compared to a net loss of $34.4 million for the corresponding prior year period.

Cash and cash equivalents and marketable securities were $539.8 million as of March 31, 2026.

2026 Financial Guidance 

10x Genomics is maintaining its full year 2026 revenue guidance of $600 million to $625 million. Excluding the non-recurring license and royalty revenue related to patent litigation settlements in 2025, this represents 0% to 4% growth over full year 2025.

Webcast and Conference Call Information

10x Genomics will host a conference call to discuss the first quarter 2026 financial results, business developments and outlook after market close on Thursday, May 7, 2026 at 1:30 PM Pacific Time / 4:30 PM Eastern Time. A webcast of the conference call can be accessed at http://investors.10xgenomics.com. The webcast will be archived and available for replay at least 45 days after the event.

About 10x Genomics

10x Genomics is a life science technology company building products to accelerate the mastery of biology and advance human health. Our integrated research solutions include instruments, consumables and software for single cell and spatial biology, which help academic and translational researchers and biopharmaceutical companies understand biological systems at a resolution and scale that matches the complexity of biology. Our products are behind breakthroughs in oncology, immunology, neuroscience and more, fueling powerful discoveries that are transforming the world’s understanding of health and disease. To learn more, visit 10xgenomics.com or connect with us on LinkedIn, X, Facebook, Bluesky or YouTube.

Forward Looking Statements

This press release contains forward-looking statements within the meaning of the Private Securities Litigation Reform Act of 1995 as contained in Section 27A of the Securities Act of 1933, as amended, and Section 21E of the Securities Exchange Act of 1934, as amended, which are subject to the “safe harbor” created by those sections. All statements included in this press release, other than statements of historical facts, may be forward-looking statements. Forward-looking statements generally can be identified by the use of forward-looking terminology such as “may,” “might,” “will,” “should,” “expect,” “plan,” “outlook,” “anticipate,” “could,” “intend,” “target,” “project,” “contemplate,” “believe,” “see,” “estimate,” “predict,” “potential,” “would,” “likely,” “seek” or “continue” or the negatives of these terms or variations of them or similar terminology, but the absence of these words does not mean that a statement is not forward-looking. These forward-looking statements include statements regarding 10x Genomics, Inc.’s products, services, business strategy, collaborations and opportunities and 10x Genomics, Inc.’s financial performance and results of operations, including expectations regarding revenue and guidance. These statements are based on management’s current expectations, forecasts, beliefs, estimates, assumptions and information currently available to management. Actual outcomes and results could differ materially from these statements due to a number of factors and such statements should not be relied upon as representing 10x Genomics, Inc.’s views as of any date subsequent to the date of this press release. 10x Genomics, Inc. disclaims any obligation to update any forward-looking statements provided to reflect any change in 10x Genomics’ expectations or any change in events, conditions or circumstances on which any such statement is based, except as required by law. The material risks and uncertainties that could affect 10x Genomics, Inc.’s financial and operating results and cause actual results to differ materially from those indicated by the forward-looking statements made in this press release include those discussed under the captions “Risk Factors” and “Management’s Discussion and Analysis of Financial Condition and Results of Operations” in the company’s most recently-filed 10-K for the fiscal year ended December 31, 2025 filed on February 12, 2026 and the company’s quarterly report on Form 10-Q for the quarter ended March 31, 2026 to be filed with the U.S. Securities and Exchange Commission (“SEC”), and elsewhere in the documents 10x Genomics, Inc. files with the SEC from time to time.

Disclosure Information

10x Genomics uses filings with the Securities and Exchange Commission, its website (www.10xgenomics.com), press releases, public conference calls, public webcasts and its social media accounts as means of disclosing material non-public information and for complying with its disclosure obligations under Regulation FD.

Contacts

Investors: investors@10xgenomics.com

Media: media@10xgenomics.com

10x Genomics, Inc.

Condensed Consolidated Statements of Operations

(Unaudited)

(In thousands, except share and per share data)

Three Months Ended
March 31,

2026

2025

Products and services revenue

$      149,896

$      137,823

License and royalty revenue

947

17,060

Revenue (1)

150,843

154,883

Cost of products and services revenue (2)

44,665

49,438

Gross profit

106,178

105,445

Operating expenses:

Research and development (2)

56,847

64,245

Selling, general and administrative (2)

66,377

89,728

Gain on settlement

(9,200)

Total operating expenses

123,224

144,773

Loss from operations

(17,046)

(39,328)

Other income (expense):

Interest income

5,014

3,686

Other income (expense), net

(815)

2,136

Total other income

4,199

5,822

Loss before provision for income taxes

(12,847)

(33,506)

Provision for income taxes

623

852

Net loss

$      (13,470)

$      (34,358)

Net loss per share, basic and diluted

$         (0.10)

$         (0.28)

Weighted-average shares used to compute net loss per share, basic and diluted

128,291,153

122,606,091

__________________________

(1)

The following table represents total revenue by source for the periods indicated (in thousands). Spatial includes the Company’s Visium and Xenium products:

Three Months Ended
March 31,

2026

2025

Instruments

Single Cell

$         5,223

$         5,913

Spatial

6,039

8,902

Total instruments revenue

11,262

14,815

Consumables

Single Cell

88,894

84,109

Spatial

40,907

31,247

Total consumables revenue

129,801

115,356

Services

8,833

7,652

Products and services revenue

149,896

137,823

License and royalty revenue

947

17,060

Total revenue

$      150,843

$      154,883

(1)

The following table presents revenue by geography based on the location of the customer for the periods indicated (in thousands):

Three Months Ended
March 31,

2026

2025

Americas

United States*

$       76,693

$       86,818

Americas (excluding United States)

3,406

3,752

Total Americas

80,099

90,570

Europe, Middle East and Africa

36,852

31,895

Asia-Pacific

China

15,837

16,883

Asia-Pacific (excluding China)

18,055

15,535

Total Asia-Pacific

33,892

32,418

Total revenue

$      150,843

$      154,883

*

Includes license and royalty revenue.

(2)

Includes stock-based compensation expense as follows:

Three Months Ended
March 31,

(in thousands)

2026

2025

Cost of revenue

$         1,918

$         2,481

Research and development

10,695

14,106

Selling, general and administrative

10,029

14,489

Total stock-based compensation expense

$       22,642

$       31,076


10x Genomics, Inc.

Condensed Consolidated Balance Sheets

(Unaudited)

(In thousands)

March 31,
2026

December 31,
2025

Assets

Current assets:

Cash and cash equivalents

$      490,285

$      473,966

Marketable securities

49,563

49,443

Accounts receivable, net

39,031

47,013

Other receivables

17,106

35,480

Inventory

53,487

56,341

Prepaid expenses and other current assets

20,261

22,208

Total current assets

669,733

684,451

Property and equipment, net

220,591

226,711

Operating lease right-of-use assets

58,390

60,450

Goodwill

4,511

4,511

Intangible assets, net

59,910

62,329

Other noncurrent assets

2,624

2,913

Total assets

$    1,015,759

$    1,041,365

Liabilities and stockholders’ equity

Current liabilities:

Accounts payable

$       17,425

$       12,733

Accrued compensation and related benefits

21,506

42,500

Accrued expenses and other current liabilities

33,680

39,971

Deferred revenue

24,342

23,902

Operating lease liabilities

11,330

10,985

Contingent consideration, current

5,315

23,363

Total current liabilities

113,598

153,454

Contingent consideration, noncurrent

1,222

1,237

Operating lease liabilities, noncurrent

70,059

73,376

Deferred revenue, noncurrent

10,138

10,501

Other noncurrent liabilities

6,418

6,471

Total liabilities

201,435

245,039

Commitments and contingencies

Stockholders’ equity:

Preferred stock

Common stock

2

2

Additional paid-in capital

2,338,269

2,306,690

Accumulated deficit

(1,524,061)

(1,510,591)

Accumulated other comprehensive income

114

225

Total stockholders’ equity

814,324

796,326

Total liabilities and stockholders’ equity

$    1,015,759

$    1,041,365


View original content to download multimedia:https://www.prnewswire.com/news-releases/10x-genomics-reports-first-quarter-2026-financial-results-302766095.html

SOURCE 10x Genomics, Inc.

Continue Reading

Technology

OUTFRONT Media Announces Quarterly Dividend

Published

on

By

NEW YORK, May 7, 2026 /PRNewswire/ — OUTFRONT Media Inc. (NYSE: OUT) announced today that its board of directors has declared a quarterly cash dividend on the Company’s common stock of $0.30 per share payable on June 30, 2026, to shareholders of record at the close of business on June 5, 2026.

About OUTFRONT Media Inc.
OUTFRONT is one of the largest and most trusted out-of-home media companies in the U.S., helping brands connect with audiences in the moments and environments that matter most. As OUTFRONT evolves, it’s defining a new era of in-real-life (IRL) marketing, turning public spaces into platforms for creativity, connection, and cultural relevance. With a nationwide footprint across billboards, digital displays, transit systems, and other out-of-home formats, OUTFRONT turns creative into powerful real-world experiences. Its in-house agency, OUTFRONT STUDIOS, and award-winning innovation team, XLabs, deliver standout storytelling, supported by advanced technology and data tools that can drive measurable impact.

Contacts:

Investors

Media

Stephan Bisson

Courtney Richards

Investor Relations

Events & Communications

(212) 297-6573

(646) 876-9404

stephan.bisson@outfront.com 

courtney.richards@outfront.com 


View original content to download multimedia:https://www.prnewswire.com/news-releases/outfront-media-announces-quarterly-dividend-302766109.html

SOURCE OUTFRONT Media Inc.

Continue Reading

Technology

OUTFRONT Media Reports First Quarter 2026 Results

Published

on

By

Revenues of $429.6 million

Operating income of $55.9 million

 Net income attributable to OUTFRONT Media Inc. of $19.1 million

Adjusted OIBDA of $100.4 million

AFFO attributable to OUTFRONT Media Inc. of $61.0 million

Quarterly dividend of $0.30 per share, payable June 30, 2026

NEW YORK, May 7, 2026 /PRNewswire/ — OUTFRONT Media Inc. (NYSE: OUT) today reported results for the quarter ended March 31, 2026.

“Our first quarter results demonstrate our continued strong performance, with revenue, OIBDA, and AFFO all exceeding our guidance,” said Nick Brien, Chief Executive Officer of OUTFRONT Media. “Importantly, this exceptional performance was driven by strong results across our entire business, with billboard and transit both contributing to this success.”

Three Months Ended
March 31,

$ in Millions, except per share amounts

2026

2025

Revenues

$429.6

$390.7

Operating income

55.9

13.9

Adjusted OIBDA

100.4

64.2

Net income (loss) before allocation to redeemable and non-redeemable
 noncontrolling interests

19.3

(20.7)

Net income (loss)1

19.1

(20.6)

Net income (loss) per share1,2,3

$0.11

($0.14)

Funds From Operations (FFO)1

63.5

26.5

Adjusted FFO (AFFO)1

61.0

27.1

Shares outstanding3

177.1

166.4

Notes: See exhibits for reconciliations of non-GAAP financial measures; 1) References to “Net income (loss)”, “FFO” and “AFFO” mean “Net income (loss) attributable to OUTFRONT Media Inc.”, “FFO attributable to OUTFRONT Media Inc.” and “AFFO attributable to OUTFRONT Media Inc.,” respectively; 2) References to “per share” mean per common share for diluted earnings per weighted average share; 3) Diluted weighted average shares outstanding. 

First Quarter 2026 Results

Consolidated Results
Reported revenues of $429.6 million increased $38.9 million, or 10.0%, for the first quarter of 2026 as compared to the same prior-year period.

Total operating expenses of $227.5 million increased $6.2 million, or 2.8%, compared to the same prior-year period, due primarily to higher variable billboard property lease expenses, higher transit franchise costs, including higher guaranteed minimum annual payments to the New York Metropolitan Transportation Authority (the “MTA”) due to inflation, higher production expenses, and higher maintenance and utilities costs, partially offset by the impact of lost billboards in the period.

Selling, General and Administrative expenses (“SG&A”) of $107.3 million decreased $7.4 million, or 6.5%, compared to the same prior-year period, due primarily to lower compensation-related expenses, including severance and salaries, and lower credit card usage by customers, partially offset by higher professional fees, including software and technology expenses, a higher allowance for bad debt and higher client entertainment expenses.

Adjusted OIBDA of $100.4 million increased $36.2 million, or 56.4%, compared to the same prior-year period.

Segment Results

Billboard
Reported billboard segment revenues of $332.9 million increased $22.2 million, or 7.1%, compared to the same prior-year period, due primarily to higher proceeds from condemnations and an increase in average revenue per display (yield), including the impact of programmatic platforms on digital billboard revenues, partially offset by lost billboards in the period.

Operating expenses increased $3.5 million, or 2.4%, due primarily to higher variable billboard property lease costs, higher maintenance and utilities, higher site-related costs, and higher compensation-related expenses, partially offset by the impact of lost billboards in the period.

SG&A expenses increased $1.3 million, or 1.9%, due primarily to higher professional fees, including software and technology expenses, and a higher allowance for bad debt, partially offset by lower credit card usage by customers and lower compensation-related expenses.

Adjusted OIBDA of $116.4 million increased $17.4 million, or 17.6%, compared to the same prior-year period.

Transit
Reported transit segment revenues of $95.0 million increased $17.3 million, or 22.3%, compared to the same prior-year period, due primarily to an increase in average revenue per display (yield), partially offset by the impact of new and lost transit franchise contracts.

Operating expenses increased $3.0 million, or 4.0%, due primarily to higher guaranteed minimum annual payments to the MTA due to inflation, higher display production costs, and higher posting and rotation costs.

SG&A expenses increased $1.5 million, or 8.7%, due primarily to higher compensation-related expenses, including severance and commissions, higher professional fees, including higher software and technology expenses, partially offset by lower credit card usage by customers.

Adjusted OIBDA loss decreased $12.8 million, or 90.1%, compared to the same prior-year period.

Other
Reported revenues decreased $0.6 million, or 26.1%, operating expenses decreased $0.3 million, or 16.7%, and Adjusted OIBDA decreased $0.3 million, or 60.0%, compared to the same prior-year period, due primarily to a decrease in third-party digital equipment sales.

Corporate
Corporate expenses, excluding stock-based compensation, decreased $6.3 million, or 29.9%, compared to the same prior-year period to $14.8 million, due primarily to lower compensation-related expenses, including severance, and lower professional fees, including fees related to a management consulting project.

Interest Expense
Net interest expense in the first quarter of 2026 was $36.0 million, including amortization of deferred financing costs of $1.4 million, as compared to $36.0 million, including amortization of deferred financing costs of $1.5 million, in the same prior-year period. The weighted average cost of debt was 5.3% as of March 31, 2026 and 5.4% as of March 31, 2025.

Income Taxes
The provision for income taxes decreased $0.1 million, or 20.0%, in the first quarter of 2026 compared to the same prior-year period. Cash paid for income taxes in the three months ended March 31, 2026 was $0.4 million.

Net Income Attributable to OUTFRONT Media Inc.
Net income attributable to OUTFRONT Media Inc. was $19.1 million in the first quarter of 2026 compared to a Net loss attributable to OUTFRONT Media Inc. of $20.6 million in the same prior-year period. Diluted weighted average shares outstanding were 177.1 million for the first quarter of 2026 compared to 166.4 million for the same prior-year period. Net income per common share for diluted earnings per weighted average share was $0.11 in the first quarter of 2026 compared to a Net loss per common share for diluted earnings per weighted average share of $0.14 in the same prior-year period.

FFO
FFO attributable to OUTFRONT Media Inc. was $63.5 million in the first quarter of 2026, an increase of $37.0 million, or 139.6%, from the same prior-year period, driven primarily by higher Adjusted OIBDA.

AFFO
Starting at the end of 2025, we modified our calculation of AFFO to include amortization of direct lease acquisition costs instead of cash paid for direct lease acquisition costs, as management believes that this calculation of AFFO is a more appropriate measure of performance period-over-period and consistent with how we calculate FFO. Accordingly, relevant prior periods have been recast to conform to this presentation.

AFFO attributable to OUTFRONT Media Inc. was $61.0 million in the first quarter of 2026, an increase of $33.9 million, or 125.1%, from the same prior-year period, due primarily to higher Adjusted OIBDA and a higher non-cash effect of straight-line rent, partially offset by lower equity earnings.

Cash Flow & Capital Expenditures
Net cash flow provided by operating activities of $75.3 million for the three months ended March 31, 2026, increased $41.7 million, or 124.1%, compared to $33.6 million in the same prior-year period, due primarily to higher net income, as adjusted for non-cash items, the timing of accounts receivables and a decrease in accounts payable and accrued expenses, partially offset by a decrease in deferred revenues. Total capital expenditures increased $6.9 million, or 40.1%, to $24.1 million for the three months ended March 31, 2026, compared to the same prior-year period, due primarily to increased growth in digital displays, increased maintenance spending for billboard display upgrades and increased spending for safety-related projects.

Dividends
In the three months ended March 31, 2026, we paid cash dividends of $53.4 million on our common stock and vested restricted share units granted to employees. We announced on May 7, 2026, that our board of directors has approved a quarterly cash dividend on our common stock of $0.30 per share payable on June 30, 2026, to stockholders of record at the close of business on June 5, 2026.

Balance Sheet and Liquidity
As of March 31, 2026, our liquidity position included unrestricted cash of $67.2 million and $494.9 million of availability under our $500.0 million revolving credit facility, net of $5.1 million of issued letters of credit against the letter of credit facility sublimit under the revolving credit facility, and $150.0 million of additional availability under our accounts receivable securitization facility. During the three months ended March 31, 2026, no shares of our common stock were sold under our at-the-market equity offering program, of which $232.5 million remains available. Total indebtedness as of March 31, 2026 was $2.6 billion, excluding $14.8 million of deferred financing costs, and includes a $500.0 million term loan, $450.0 million of senior secured notes and $1.7 billion of senior unsecured notes.

Conference Call
We will host a conference call to discuss the results on May 7, 2026, at 4:30 p.m. Eastern Time. The conference call numbers are 833-461-5787 (U.S. callers) and 585-542-9983 (International callers) and the passcode for both is 404991578.  Live and replay versions of the conference call will be webcast in the Investor Relations section of our website, www.outfront.com.

Supplemental Materials
In addition to this press release, we have provided a supplemental investor presentation which can be viewed on our website, www.outfront.com.

About OUTFRONT Media Inc.
OUTFRONT is one of the largest and most trusted out-of-home media companies in the U.S., helping brands connect with audiences in the moments and environments that matter most. As OUTFRONT evolves, it’s defining a new era of in-real-life (IRL) marketing, turning public spaces into platforms for creativity, connection, and cultural relevance. With a nationwide footprint across billboards, digital displays, transit systems, and other out-of-home formats, OUTFRONT turns creative into powerful real-world experiences. Its in-house agency, OUTFRONT STUDIOS, and award-winning innovation team, XLabs, deliver standout storytelling, supported by advanced technology and data tools that can drive measurable impact.

Contacts:

Investors

Media

Stephan Bisson

Courtney Richards

Investor Relations

Events & Communications

(212) 297-6573

(646) 876-9404

stephan.bisson@outfront.com

courtney.richards@outfront.com

Non-GAAP Financial Measures
In addition to the results prepared in accordance with generally accepted accounting principles in the United States (“GAAP”) provided throughout this document, this document and the accompanying tables include non-GAAP financial measures as described below. We calculate and define “Adjusted OIBDA” as operating income (loss) before depreciation, amortization, net (gain) loss on dispositions and stock-based compensation. We calculate Adjusted OIBDA margin by dividing Adjusted OIBDA by total revenues. Adjusted OIBDA and Adjusted OIBDA margin are among the primary measures we use for managing our business, evaluating our operating performance and planning and forecasting future periods, as each is an important indicator of our operational strength and business performance. Our management believes users of our financial data are best served if the information that is made available to them allows them to align their analysis and evaluation of our operating results along the same lines that our management uses in managing, planning and executing our business strategy. Our management also believes that the presentations of Adjusted OIBDA and Adjusted OIBDA margin, as supplemental measures, are useful in evaluating our business because eliminating certain non-comparable items highlight operational trends in our business that may not otherwise be apparent when relying solely on GAAP financial measures.  It is management’s opinion that these supplemental measures provide users of our financial data with an important perspective on our operating performance and also make it easier for users of our financial data to compare our results with other companies that have different financing and capital structures or tax rates. When used herein, references to “FFO” and “AFFO” mean “FFO attributable to OUTFRONT Media Inc.” and “AFFO attributable to OUTFRONT Media Inc.,” respectively. We calculate FFO in accordance with the definition established by the National Association of Real Estate Investment Trusts (“NAREIT”). FFO reflects net income (loss) attributable to OUTFRONT Media Inc. adjusted to exclude gains and losses from the sale of real estate assets, depreciation and amortization of real estate assets, amortization of direct lease acquisition costs and the same adjustments for our equity-based investments and redeemable and non-redeemable noncontrolling interests, as well as the related income tax effect of adjustments, as applicable. We calculate AFFO as FFO adjusted to include amortization of direct lease acquisition costs as such costs are generally amortized over a period ranging from four weeks to one year and therefore are incurred on a regular basis. AFFO also includes cash paid for maintenance capital expenditures since these are routine uses of cash that are necessary for our operations. In addition, AFFO excludes certain non-cash items, including non-real estate depreciation and amortization, stock-based compensation expense, accretion expense, the non-cash effect of straight-line rent, amortization of deferred financing costs and the same adjustments for our redeemable and non-redeemable noncontrolling interests, along with the non-cash portion of income taxes, and the related income tax effect of adjustments, as applicable. We use FFO and AFFO measures for managing our business and for planning and forecasting future periods, and each is an important indicator of our operational strength and business performance, especially compared to other real estate investment trusts (“REITs”). Our management believes users of our financial data are best served if the information that is made available to them allows them to align their analysis and evaluation of our operating results along the same lines that our management uses in managing, planning and executing our business strategy. Our management also believes that the presentations of FFO and AFFO, as supplemental measures, are useful in evaluating our business because adjusting results to reflect items that have more bearing on the operating performance of REITs highlight trends in our business that may not otherwise be apparent when relying solely on GAAP financial measures. It is management’s opinion that these supplemental measures provide users of our financial data with an important perspective on our operating performance and also make it easier to compare our results to other companies in our industry, as well as to REITs. Since Adjusted OIBDA, Adjusted OIBDA margin, FFO and AFFO are not measures calculated in accordance with GAAP, they should not be considered in isolation of, or as a substitute for, operating income (loss) and net income (loss) attributable to OUTFRONT Media Inc., the most directly comparable GAAP financial measures, as indicators of operating performance. These measures, as we calculate them, may not be comparable to similarly titled measures employed by other companies. In addition, these measures do not necessarily represent funds available for discretionary use and are not necessarily a measure of our ability to fund our cash needs.

Please see Exhibits 4-5 of this release for a reconciliation of the above non-GAAP financial measures to the most directly comparable GAAP financial measures.

Cautionary Statement Regarding Forward-Looking Statements
We have made statements in this document that are forward-looking statements within the meaning of the federal securities laws, including the Private Securities Litigation Reform Act of 1995. You can identify forward-looking statements by the use of forward-looking terminology such as “believes,” “expects,” “could,” “would,” “may,” “might,” “will,” “should,” “seeks,” “likely,” “intends,” “plans,” “projects,” “predicts,” “estimates,” “forecast” or “anticipates” or the negative of these words and phrases or similar words or phrases that are predictions of or indicate future events or trends and that do not relate solely to historical matters. You can also identify forward-looking statements by discussions of strategy, plans or intentions related to our capital resources, portfolio performance and results of operations. Forward-looking statements involve numerous risks and uncertainties and you should not rely on them as predictions of future events. Forward-looking statements depend on assumptions, data or methods that may be incorrect or imprecise and may not be able to be realized. We do not guarantee that the transactions and events described will happen as described (or that they will happen at all). The following factors, among others, could cause actual results and future events to differ materially from those set forth or contemplated in the forward-looking statements: declines in advertising and general economic conditions; competition; government regulation; our ability to operate our digital display platform; losses and costs resulting from recalls and product liability, warranty and intellectual property claims; our ability to obtain and renew key municipal contracts on favorable terms; taxes, fees and registration requirements; decreased government compensation for the removal of lawful billboards; content-based restrictions on outdoor advertising; seasonal variations; acquisitions and other strategic transactions that we may pursue could have a negative effect on our results of operations; dependence on our management team and other key employees; experiencing a cybersecurity incident; changes in regulations and consumer concerns regarding privacy, information security and data, or any failure or perceived failure to comply with these regulations or our internal policies; asset impairment charges for our long-lived assets and goodwill; environmental, health and safety laws and regulations; expectations relating to environmental, social and governance considerations; our substantial indebtedness; restrictions in the agreements governing our indebtedness; incurrence of additional debt; interest rate risk exposure from our variable-rate indebtedness; our ability to generate cash to service our indebtedness; cash available for distributions; hedging transactions; the ability of our board of directors to cause us to issue additional shares of stock without common stockholder approval; certain provisions of Maryland law may limit the ability of a third party to acquire control of us; our rights and the rights of our stockholders to take action against our directors and officers are limited; our failure to remain qualified to be taxed as a REIT; REIT distribution requirements; availability of external sources of capital; we may face other tax liabilities even if we remain qualified to be taxed as a REIT; complying with REIT requirements may cause us to liquidate investments or forgo otherwise attractive investments or business opportunities; our ability to contribute certain contracts to a taxable REIT subsidiary (“TRS”); our planned use of TRSs may cause us to fail to remain qualified to be taxed as a REIT; REIT ownership limits; complying with REIT requirements may limit our ability to hedge effectively; the ability of our board of directors to revoke our REIT election at any time without stockholder approval; the Internal Revenue Service may deem the gains from sales of our outdoor advertising assets to be subject to a 100% prohibited transaction tax; establishing operating partnerships as part of our REIT structure; and other factors described in our filings with the Securities and Exchange Commission (the “SEC”), including but not limited to the section entitled “Risk Factors” in our Annual Report on Form 10-K for the year ended December 31, 2025, filed with the SEC on February 26, 2026. All forward-looking statements in this document apply as of the date of this document or as of the date they were made and, except as required by applicable law, we disclaim any obligation to publicly update or revise any forward-looking statement to reflect changes in underlying assumptions or factors, of new information, data or methods, future events or other changes.

EXHIBITS

Exhibit 1:  CONSOLIDATED STATEMENTS OF OPERATIONS
(Unaudited) See Notes on Page 14

Three Months Ended

March 31,

(in millions, except per share amounts)

2026

2025

Revenues

$         429.6

$         390.7

Expenses:

Operating

227.5

221.3

Selling, general and administrative

107.3

114.7

Net loss on dispositions

1.0

0.1

Depreciation

20.7

23.6

Amortization

17.2

17.1

Total expenses

373.7

376.8

Operating income

55.9

13.9

Interest expense, net

(36.0)

(36.0)

Income (loss) before provision for income taxes and equity in earnings of investee
 companies

19.9

(22.1)

Provision for income taxes

(0.4)

(0.5)

Equity in earnings of investee companies, net of tax

(0.2)

1.9

Net income (loss) before allocation to redeemable and non-redeemable noncontrolling
 interests

19.3

(20.7)

Net income (loss) attributable to redeemable and non-redeemable noncontrolling interests

0.2

(0.1)

Net income (loss) attributable to OUTFRONT Media Inc.

$           19.1

$         (20.6)

Net income (loss) per common share:

Basic

$           0.11

$         (0.14)

Diluted

$           0.11

$         (0.14)

Weighted average shares outstanding:

Basic

175.5

166.4

Diluted

177.1

166.4


Exhibit 2:  CONSOLIDATED STATEMENTS OF FINANCIAL POSITION
(Unaudited) See Notes on Page 14

As of

(in millions)

March 31,
2026

December 31,
2025

Assets:

Current assets:

Cash and cash equivalents

$           67.2

$           99.9

Receivables, less allowance ($25.0 in 2026 and $23.2 in 2025)

294.3

365.7

Prepaid lease and franchise costs

2.6

5.1

Prepaid MTA equipment deployment costs

0.2

Other prepaid expenses

25.6

21.9

Other current assets

11.6

11.1

Total current assets

401.5

503.7

Property and equipment, net

644.3

643.8

Goodwill

2,006.4

2,006.4

Intangible assets

603.6

612.0

Operating lease assets

1,553.8

1,521.5

Other assets

28.5

24.2

Total assets

$        5,238.1

$        5,311.6

Liabilities:

Current liabilities:

Accounts payable

$           33.3

$           50.2

Accrued compensation

42.4

72.3

Accrued interest

23.4

35.1

Accrued lease and franchise costs

62.7

72.2

Other accrued expenses

63.2

55.5

Deferred revenues

60.1

57.7

Short-term operating lease liabilities

179.5

172.9

Other current liabilities

27.6

29.4

Total current liabilities

492.2

545.3

Long-term debt, net

2,584.5

2,583.4

Asset retirement obligation

34.1

34.0

Operating lease liabilities

1,398.9

1,374.7

Other liabilities

39.2

40.3

Total liabilities

4,548.9

4,577.7

Commitments and contingencies

Redeemable noncontrolling interests

25.8

22.0

Stockholders’ equity:

Common stock (2026 – 450.0 shares authorized, and 176.1 shares issued and
 outstanding; 2025 – 450.0 shares authorized, and 175.2 issued and outstanding)

1.8

1.8

Additional paid-in capital

2,604.6

2,619.3

Distribution in excess of earnings

(1,944.6)

(1,910.8)

Accumulated other comprehensive loss

0.1

0.1

Total stockholders’ equity

661.9

710.4

Noncontrolling interests

1.5

1.5

Total liabilities and equity

$        5,238.1

$        5,311.6


Exhibit 3:  CONSOLIDATED STATEMENTS OF CASH FLOWS
(Unaudited) See Notes on Page 14

Three Months Ended

March 31,

(in millions)

2026

2025

Operating activities:

Net income (loss) attributable to OUTFRONT Media Inc.

$          19.1

$         (20.6)

Adjustments to reconcile net income (loss) to net cash flow provided by operating activities:

Net income (loss) attributable to redeemable and non-redeemable noncontrolling interests

0.2

(0.1)

Depreciation and amortization

37.9

40.7

Stock-based compensation

5.6

9.5

Provision for doubtful accounts

2.2

1.5

Accretion expense

0.7

0.7

Net loss on dispositions

1.0

0.1

Equity in earnings of investee companies, net of tax

0.2

(1.9)

Distributions from investee companies

0.3

0.3

Amortization of deferred financing costs and debt discount and premium

1.4

1.5

Change in assets and liabilities, net of investing and financing activities:

Decrease in receivables

69.2

45.3

Increase in prepaid MTA equipment deployment costs

(0.2)

(Increase) decrease in prepaid expenses and other current assets

(3.5)

0.8

Decrease in accounts payable and accrued expenses

(57.1)

(67.8)

Increase in operating lease assets and liabilities

0.5

2.1

Increase in deferred revenues

2.4

16.7

Increase (decrease) in income taxes

0.5

Other, net

(4.6)

4.3

Net cash flow provided by operating activities

75.3

33.6

Investing activities:

Capital expenditures

(24.1)

(17.2)

Acquisitions

(8.1)

(5.7)

MTA franchise rights

(1.8)

(4.0)

Net proceeds from dispositions

0.7

Investment in investee companies

(4.0)

Return of investments in investee companies

1.5

Net cash flow used for investing activities

(38.0)

(24.7)

Financing activities:

Proceeds from borrowings under short-term debt facilities

50.0

Repayments of borrowings under short-term debt facilities

(10.0)

Taxes withheld for stock-based compensation

(16.6)

(12.3)

Dividends

(53.4)

(53.0)

Net cash flow used for financing activities

(70.0)

(25.3)


Exhibit 3:  CONSOLIDATED STATEMENTS OF CASH FLOWS (Continued)
(Unaudited) See Notes on Page 14

Three Months Ended

March 31,

(in millions)

2026

2025

Net decrease in cash and cash equivalents

(32.7)

(16.4)

Cash and cash equivalents at beginning of period

99.9

46.9

Cash and cash equivalents at end of period

$          67.2

$          30.5

Supplemental disclosure of cash flow information:

Cash paid for income taxes

$           0.4

$            —

Cash paid for interest

47.1

46.2

Non-cash investing and financing activities:

Accrued purchases of property and equipment

3.3

13.4

Accrued MTA franchise rights

1.9

1.6

Taxes withheld for stock-based compensation

2.8

2.6


Exhibit 4:  SUPPLEMENTAL DISCLOSURES REGARDING NON-GAAP FINANCIAL INFORMATION
(Unaudited) See Notes on Page 14

Three Months Ended March 31, 2026

(in millions, except percentages)

Billboard

Transit

Other

Corporate

Consolidated

Revenues

$        332.9

$        95.0

$          1.7

$             —

$       429.6

Operating income (loss)

$         82.5

$         (6.4)

$          0.2

$          (20.4)

$         55.9

Net loss on dispositions

0.9

0.1

1.0

Depreciation

18.1

2.6

20.7

Amortization

14.9

2.3

17.2

Stock-based compensation

5.6

5.6

Adjusted OIBDA

$        116.4

$         (1.4)

$          0.2

$          (14.8)

$       100.4

Adjusted OIBDA margin

35.0 %

(1.5) %

11.8 %

*

23.4 %

Three Months Ended March 31, 2025

(in millions, except percentages)

Billboard

Transit

Other

Corporate

Consolidated

Revenues

$        310.7

$        77.7

$          2.3

$             —

$       390.7

Operating income (loss)

$         61.0

$       (17.0)

$          0.5

$          (30.6)

$         13.9

Net (gain) loss on dispositions

0.7

(0.6)

0.1

Depreciation

21.6

2.0

23.6

Amortization

15.7

1.4

17.1

Stock-based compensation

9.5

9.5

Adjusted OIBDA

$         99.0

$       (14.2)

$          0.5

$          (21.1)

$         64.2

Adjusted OIBDA margin

31.9 %

(18.3) %

21.7 %

*

16.4 %


Exhibit 5:  SUPPLEMENTAL DISCLOSURES REGARDING NON-GAAP FINANCIAL MEASURES  
(Unaudited) See Notes on Page 14

Three Months Ended

March 31,

(in millions)

2026

2025

Net income (loss) attributable to OUTFRONT Media Inc.

$           19.1

$         (20.6)

Depreciation of billboard advertising structures

16.2

18.8

Amortization of real estate-related intangible assets

14.3

15.1

Amortization of direct lease acquisition costs

13.0

13.2

Net loss on disposition of real estate assets

1.0

0.1

Adjustment related to redeemable and non-redeemable noncontrolling interests

(0.1)

(0.1)

FFO attributable to OUTFRONT Media Inc.

$           63.5

$           26.5

Non-cash portion of income taxes

0.5

Cash paid for direct lease acquisition costs

(13.0)

(13.2)

Maintenance capital expenditures

(7.0)

(6.3)

Other depreciation

4.5

4.8

Other amortization

2.9

2.0

Stock-based compensation

5.6

9.5

Non-cash effect of straight-line rent

2.4

1.1

Accretion expense

0.7

0.7

Amortization of deferred financing costs

1.4

1.5

AFFO attributable to OUTFRONT Media Inc.(a)

$           61.0

$           27.1


Exhibit 6:  SUPPLEMENTAL DISCLOSURES REGARDING NON-GAAP FINANCIAL MEASURES  
(Unaudited) See Notes on Page 14

Three Months Ended

March 31,

(in millions)

2026

2025

Adjusted OIBDA

$         100.4

$           64.2

Interest expense, net, less amortization of deferred financing costs

(34.6)

(34.5)

Cash paid for income taxes

(0.4)

Maintenance capital expenditures

(7.0)

(6.3)

Equity in earnings of investee companies, net of tax

(0.2)

1.9

Non-cash effect of straight-line rent

2.4

1.1

Accretion expense

0.7

0.7

Adjustment related to redeemable and non-redeemable noncontrolling interests

(0.3)

AFFO attributable to OUTFRONT Media Inc.(a)

$           61.0

$           27.1


Exhibit 7:  OPERATING EXPENSES

(Unaudited) See Notes on Page 14

Three Months Ended

March 31,

%

(in millions, except percentages)

2026

2025

Change

Operating expenses:

Billboard property lease

$         111.3

$         109.2

1.9 %

Transit franchise

59.7

58.0

2.9

Posting, maintenance and other

56.5

54.1

4.4

Total operating expenses

$         227.5

$         221.3

2.8


Exhibit 8:  EXPENSES BY SEGMENT

(Unaudited) See Notes on Page 14

Three Months Ended

March 31,

%

(in millions, except percentages)

2026

2025

Change

Billboard:

Billboard property lease

$         111.3

$         109.2

1.9 %

Billboard posting, maintenance and other

37.1

35.7

3.9

Billboard operating expenses

$         148.4

$         144.9

2.4

Billboard SG&A expenses

$           68.1

$           66.8

1.9

Transit:

Transit franchise

$           59.7

$           58.0

2.9

Transit posting, maintenance and other

17.9

16.6

7.8

Transit operating expenses

$           77.6

$           74.6

4.0

Transit SG&A expenses

$           18.8

$           17.3

8.7

NOTES TO EXHIBITS

PRIOR PERIOD PRESENTATION CONFORMS TO CURRENT REPORTING CLASSIFICATIONS.

(a)

Starting at the end of 2025, we modified our calculation of AFFO to include amortization of direct lease acquisition costs instead of the cash paid for direct lease acquisition costs, as management believes that this calculation of AFFO is a more appropriate measure of performance period-over-period and consistent with how we calculate FFO. Accordingly, relevant prior periods have been recast to conform to this presentation.

*     Calculation not meaningful.


View original content to download multimedia:https://www.prnewswire.com/news-releases/outfront-media-reports-first-quarter-2026-results-302766116.html

SOURCE OUTFRONT Media Inc.

Continue Reading

Trending