Gen strengthens its annual guidance driven by strong bookings and customer count growth
TEMPE, Ariz. & PRAGUE, Oct. 30, 2024 /PRNewswire/ — Gen Digital Inc. (NASDAQ: GEN), a global leader dedicated to powering Digital Freedom, released its results for the second quarter fiscal year 2025, which ended September 27, 2024.
“Threats to your information, identity, and financial assets are more dynamic and effective than ever,” said Vincent Pilette, CEO of Gen. “That’s why we are so focused on innovating and evolving our industry leading portfolio of security, financial safety and data management services that empower people’s digital lives. Customers have trusted us for decades and we plan on building on that trust well into the future.”
Q2 Fiscal Year 2025 Financial Highlights and Commentary Year-Over-Year
Q2 GAAP Results
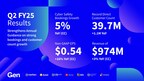
Revenue of $974 million, up 3% in USDOperating income of $402 million, up 1,727%Operating margin of 41.3%, up 39 pointsQ2 diluted EPS of $0.26, up 13%Q2 operating cash flow of $158 million, up 26%
Q2 Non-GAAP Results
Revenue of $974 million, up 3% in USD and in constant currencyBookings of $964 million, up 4% in USD and up 5% in constant currencyOperating income of $567 million, up 4% in USD and in constant currencyOperating margin of 58.2%, up 40 basis pointsDiluted EPS of $0.54, up 16% in USD and in constant currency
“As we pass the halfway mark of our fiscal year, we’re executing our plan and focusing on strategic investments that align with the real needs of our customers and help drive long-term profitable growth,” said Natalie Derse, CFO of Gen. “With the right financial framework in place and clear strategy, we are well-positioned to deliver sustainable and growing value to all of our stakeholders.”
Q3 FY25 Non-GAAP Guidance
Revenue expected to be in the range of $980 to $990 millionEPS expected to be in the range of $0.54 to $0.56
Fiscal Year 2025 Non-GAAP Annual Guidance
Revenue now expected to be in the range of $3,905 to $3,930 million, compared to the prior range of $3,890 to $3,930 millionEPS now expected to be in the range of $2.18 to $2.23, compared to the prior range of $2.17 to $2.23
Quarterly Cash Dividend
Gen’s Board of Directors has approved a regular quarterly cash dividend of $0.125 per common share to be paid on December 11, 2024, to all shareholders of record as of the close of business on November 18, 2024.
Q2 FY25 Earnings Call
October 30, 2024
2 p.m. PT / 5 p.m. ET
Webcast & Dial-in instructions at Investor.GenDigital.com. A replay will be posted following the call. For additional details regarding Gen’s results and outlook, please see the Financials section of the Investor Relations website.
About Gen
Gen™ (NASDAQ: GEN) is a global company dedicated to powering Digital Freedom through its trusted Cyber Safety brands, Norton, Avast, LifeLock, Avira, AVG, ReputationDefender and CCleaner. The Gen family of consumer brands is rooted in providing safety for the first digital generations. Now, Gen empowers people to live their digital lives safely, privately, and confidently today and for generations to come. Gen brings award-winning products and services in cybersecurity, online privacy and identity protection to nearly 500 million users in more than 150 countries. Learn more at GenDigital.com.
Forward-Looking Statements
This press release contains statements which may be considered forward-looking within the meaning of the U.S. federal securities laws. In some cases, you can identify these forward-looking statements by the use of terms such as “expect,” “will,” “continue,” or similar expressions, and variations or negatives of these words, but the absence of these words does not mean that a statement is not forward-looking. All statements other than statements of historical fact are statements that could be deemed forward-looking statements, including, but not limited to, the quotes under “Q2 Non-GAAP Results” including expectations relating to achievement of long-term objectives, and the statements under “Q3 FY25 Non-GAAP Guidance” and “Fiscal Year 2025 Non-GAAP Annual Guidance” including expectations relating to Q3 FY25 and FY25 non-GAAP revenue and non-GAAP EPS, and any statements of assumptions underlying any of the foregoing. These statements are subject to known and unknown risks, uncertainties and other factors that may cause our actual results, levels of activity, performance or achievements to differ materially from results expressed or implied in this press release. Such risk factors include, but are not limited to, those related to: the consummation of or anticipated impacts of acquisitions (including our ability to achieve synergies and associated cost savings from the merger with Avast); divestitures, restructurings, stock repurchases, financings, debt repayments and investment activities; difficulties in executing the operating model for the consumer Cyber Safety business; lower than anticipated returns from our investments in direct customer acquisition; difficulties in retaining our existing customers and converting existing non-paying customers to paying customers; difficulties and delays in reducing run rate expenses and monetizing underutilized assets; the successful development of new products and upgrades and the degree to which these new products and upgrades gain market acceptance; our ability to maintain our customer and partner relationships; the anticipated growth of certain market segments; fluctuations and volatility in our stock price; our ability to successfully execute strategic plans; the vulnerability of our solutions, systems, websites and data to intentional disruption by third parties; changes to existing accounting pronouncements or taxation rules or practices; and general business and macroeconomic changes in the U.S. and worldwide, including economic recessions, the impact of inflation, fluctuations in foreign currency exchange rates, changes in interest rates or tax rates, and ongoing and new geopolitical conflicts. Additional information concerning these and other risk factors is contained in the Risk Factors sections of our most recent reports on Form 10-K and Form 10-Q. We encourage you to read those sections carefully. There may also be other factors that have not been anticipated or are not described in our periodic filings, generally because we did not believe them to be significant at the time, which could cause actual results to differ materially from our projections and expectations. All forward-looking statements should be evaluated with the understanding of their inherent uncertainty. We assume no obligation, and do not intend, to update these forward-looking statements as a result of future events or developments.
Use of Non-GAAP Financial Information
We use non-GAAP measures of operating margin, operating income, net income and earnings per share, which are adjusted from results based on GAAP and exclude certain expenses, gains and losses. We also provide the non-GAAP metrics of revenues, and constant currency revenues. These non-GAAP financial measures are provided to enhance the user’s understanding of our past financial performance and our prospects for the future. Our management team uses these non-GAAP financial measures in assessing Gen’s performance, as well as in planning and forecasting future periods. These non-GAAP financial measures are not computed according to GAAP and the methods we use to compute them may differ from the methods used by other companies. Non-GAAP financial measures are supplemental, should not be considered a substitute for financial information presented in accordance with GAAP and should be read only in conjunction with our condensed consolidated financial statements prepared in accordance with GAAP. Readers are encouraged to review the reconciliation of our non-GAAP financial measures to the comparable GAAP results, which is attached to our quarterly earnings release, and which can be found, along with other financial information including the Earnings Presentation, on the investor relations page of our website at Investor.GenDigital.com. No reconciliation of the forecasted range for non-GAAP revenues and EPS guidance is included in this release because most non-GAAP adjustments pertain to events that have not yet occurred. It would be unreasonably burdensome to forecast, therefore we are unable to provide an accurate estimate.
GEN DIGITAL INC.
Condensed Consolidated Balance Sheets (1)
(Unaudited, in millions)
September 27,
2024
March 29, 2024
ASSETS
Current assets:
Cash and cash equivalents
$ 737
$ 846
Accounts receivable, net
164
163
Other current assets
297
334
Assets held for sale
24
15
Total current assets
1,222
1,358
Property and equipment, net
60
72
Intangible assets, net
2,442
2,638
Goodwill
10,235
10,210
Other long-term assets
1,512
1,515
Total assets
$ 15,471
$ 15,793
LIABILITIES AND STOCKHOLDERS’ EQUITY (DEFICIT)
Current liabilities:
Accounts payable
$ 99
$ 66
Accrued compensation and benefits
74
78
Current portion of long-term debt
1,391
175
Contract liabilities
1,749
1,808
Other current liabilities
509
599
Total current liabilities
3,822
2,726
Long-term debt
7,137
8,429
Long-term contract liabilities
78
76
Deferred income tax liabilities
248
261
Long-term income taxes payable
1,396
1,490
Other long-term liabilities
692
671
Total liabilities
13,373
13,653
Total stockholders’ equity (deficit)
2,098
2,140
Total liabilities and stockholders’ equity (deficit)
$ 15,471
$ 15,793
_______________
(1)
During the first quarter of fiscal year 2025, we identified and made a revision to our historical practice of when we recognize revenue from certain customers. We concluded that the impact of the revision was an immaterial correction to prior period financial statements. However, for comparative purposes we have corrected for this in prior periods reported above.
GEN DIGITAL INC.
Condensed Consolidated Statements of Operations (1)
(Unaudited, in millions, except per share amounts)
Three Months Ended
Six Months Ended
September 27,
2024
September 29,
2023
September 27,
2024
September 29,
2023
Net revenues
$ 974
$ 945
$ 1,939
$ 1,888
Cost of revenues
194
180
384
359
Gross profit
780
765
1,555
1,529
Operating expenses:
Sales and marketing
184
187
367
368
Research and development
83
85
164
175
General and administrative
64
393
116
449
Amortization of intangible assets
44
61
87
122
Restructuring and other costs
3
17
2
34
Total operating expenses
378
743
736
1,148
Operating income (loss)
402
22
819
381
Interest expense
(149)
(173)
(302)
(343)
Other income (expense), net
5
7
17
19
Income (loss) before income taxes
258
(144)
534
57
Income tax expense (benefit)
97
(291)
192
(277)
Net income (loss)
$ 161
$ 147
$ 342
$ 334
Net income (loss) per share – basic
$ 0.26
$ 0.23
$ 0.55
$ 0.52
Net income (loss) per share – diluted
$ 0.26
$ 0.23
$ 0.55
$ 0.52
Weighted-average shares outstanding:
Basic
616
640
618
640
Diluted
622
644
624
644
________________
(1)
During the first quarter of fiscal year 2025, we identified and made a revision to our historical practice of when we recognize revenue from certain customers. We concluded that the impact of the revision was an immaterial correction to prior period financial statements. However, for comparative purposes we have corrected for this in prior periods reported above.
GEN DIGITAL INC.
Condensed Consolidated Statements of Cash Flows (1)
(Unaudited, in millions)
Three Months Ended
Six Months Ended
September 27,
2024
September 29,
2023
September 27,
2024
September 29,
2023
OPERATING ACTIVITIES:
Net income (loss)
$ 161
$ 147
$ 342
$ 334
Adjustments:
Amortization and depreciation
105
125
211
250
Impairments and write-offs of current and long-lived assets
3
—
3
—
Stock-based compensation expense
33
35
64
72
Deferred income taxes
(27)
(917)
(37)
(976)
Gain on sale of property
—
—
—
(4)
Non-cash operating lease expense
4
5
7
11
Other
10
(1)
8
17
Changes in operating assets and liabilities, net of acquisitions:
Accounts receivable, net
(7)
(4)
2
16
Accounts payable
12
(3)
29
(15)
Accrued compensation and benefits
16
1
(5)
(41)
Contract liabilities
(15)
(28)
(71)
(93)
Income taxes payable
(250)
389
(169)
417
Other assets
47
5
64
(23)
Other liabilities
66
371
(26)
386
Net cash provided by (used in) operating activities
158
125
422
351
INVESTING ACTIVITIES:
Purchases of property and equipment
(2)
(5)
(4)
(9)
Purchase of non-marketable equity investments
(4)
—
(4)
—
Proceeds from the sale of property
—
13
—
13
Other
(2)
1
(2)
(1)
Net cash provided by (used in) investing activities
(8)
9
(10)
3
FINANCING ACTIVITIES:
Repayments of debt
—
(58)
(88)
(266)
Net proceeds from sales of common stock under employee stock incentive plans
6
6
6
6
Tax payments related to vesting of stock units
(1)
(2)
(25)
(20)
Dividends and dividend equivalents paid
(77)
(81)
(159)
(164)
Repurchases of common stock
—
—
(272)
(41)
Net cash provided by (used in) financing activities
(72)
(135)
(538)
(485)
Effect of exchange rate fluctuations on cash and cash equivalents
15
7
17
10
Change in cash and cash equivalents
93
6
(109)
(121)
Beginning cash and cash equivalents
644
623
846
750
Ending cash and cash equivalents
$ 737
$ 629
$ 737
$ 629
_______________
(1)
During the first quarter of fiscal year 2025, we identified and made a revision to our historical practice of when we recognize revenue from certain customers. We concluded that the impact of the revision was an immaterial correction to prior period financial statements. However, for comparative purposes we have corrected for this in prior periods reported above.
GEN DIGITAL INC.
Reconciliation of Selected GAAP Measures to Non-GAAP Measures (1) (2) (3)
(Unaudited, in millions, except per share amounts)
Three Months Ended
September 27,
2024
September 29,
2023
Operating income (loss)
$ 402
$ 22
Stock-based compensation
33
35
Amortization of intangible assets
102
119
Restructuring and other costs
3
17
Acquisition and integration costs
2
6
Litigation costs
25
347
Operating income (loss) (Non-GAAP)
$ 567
$ 546
Operating margin
41.3 %
2.3 %
Operating margin (Non-GAAP)
58.2 %
57.8 %
Net income (loss)
$ 161
$ 147
Adjustments to net income (loss):
Stock-based compensation
33
35
Amortization of intangible assets
102
119
Restructuring and other costs
3
17
Acquisition and integration costs
2
6
Litigation costs
25
347
Other
1
(1)
Non-cash interest expense
6
6
Total adjustments to GAAP income (loss) before income taxes
172
529
Adjustment to GAAP provision for income taxes
3
(375)
Total adjustment to income (loss), net of taxes
175
154
Net income (loss) (Non-GAAP)
$ 336
$ 301
Diluted net income (loss) per share
$ 0.26
$ 0.23
Adjustments to diluted net income (loss) per share:
Stock-based compensation
0.05
0.05
Amortization of intangible assets
0.16
0.18
Restructuring and other costs
0.00
0.03
Acquisition and integration costs
0.00
0.01
Litigation costs
0.04
0.54
Other
0.00
(0.00)
Non-cash interest expense
0.01
0.01
Total adjustments to GAAP income (loss) before income taxes
0.28
0.82
Adjustment to GAAP provision for income taxes
0.00
(0.58)
Total adjustment to income (loss), net of taxes
0.28
0.24
Diluted net income (loss) per share (Non-GAAP)
$ 0.54
$ 0.47
Diluted weighted-average shares outstanding
622
644
Diluted weighted-average shares outstanding (Non-GAAP)
622
644
_______________
(1)
This presentation includes non-GAAP measures. Non-GAAP financial measures are supplemental and should not be considered a substitute for financial information presented in accordance with GAAP. For a detailed explanation of these non-GAAP measures, see Appendix A.
(2)
Amounts may not add due to rounding.
(3)
During the first quarter of fiscal year 2025, we identified and made a revision to our historical practice of when we recognize revenue from certain customers. We concluded that the impact of the revision was an immaterial correction to prior period financial statements. However, for comparative purposes we have corrected for this in prior periods reported above.
GEN DIGITAL INC.
Constant Currency Adjusted Revenues and Cyber Safety Metrics (1)
(Unaudited, in millions, except per user data)
Constant Currency Adjusted Revenues (Non-GAAP)
Three Months Ended
September 27,
2024
September 29,
2023
Variance in %
Revenues
$ 974
$ 945
3 %
Exclude foreign exchange impact (2)
1
—
Constant currency adjusted revenues (Non-GAAP)
$ 975
$ 945
3 %
Cyber Safety Metrics
Three Months Ended
September 27,
2024
September 29,
2023
Direct customer revenues
$ 860
$ 834
Partner revenues
$ 102
$ 95
Total Cyber Safety revenues
$ 962
$ 929
Legacy revenues (3)
$ 12
$ 16
Direct customer count (at quarter end)
39.7
38.5
Direct average revenue per user (ARPU)
$ 7.26
$ 7.25
Retention rate
78 %
77 %
_________________
(1)
During the first quarter of fiscal year 2025, we identified and made a revision to our historical practice of when we recognize revenue from certain customers. We concluded that the impact of the revision was an immaterial correction to prior period financial statements. However, for comparative purposes we have corrected for this in prior periods reported above.
(2)
Calculated using year ago foreign exchange rates.
(3)
Legacy revenues includes revenues from products or solutions from markets that we have exited and in which we no longer operate, have been discontinued or identified to be discontinued, or remain in maintenance mode as a result of integration and product portfolio decisions.
GEN DIGITAL INC.
Appendix A
Explanation of Non-GAAP Measures and Other Items
Objective of non-GAAP measures: We believe our presentation of non-GAAP financial measures, when taken together with corresponding GAAP financial measures, provides meaningful supplemental information regarding the Company’s operating performance for the reasons discussed below. Our management team uses these non-GAAP financial measures in assessing our performance, as well as in planning and forecasting future periods. Due to the importance of these measures in managing the business, we use non-GAAP measures in the evaluation of management’s compensation. These non-GAAP financial measures are not computed according to GAAP and the methods we use to compute them may differ from the methods used by other companies. Non-GAAP financial measures are supplemental and should not be considered a substitute for financial information presented in accordance with GAAP and should be read only in conjunction with our consolidated financial statements prepared in accordance with GAAP.
Stock-based compensation: This consists of expenses for employee restricted stock units, performance-based awards, stock options and our employee stock purchase plan, determined in accordance with GAAP. We evaluate our performance both with and without these measures because stock-based compensation is a non-cash expense and can vary significantly over time based on the timing, size, nature and design of the awards granted, and is influenced in part by certain factors that are generally beyond our control, such as the volatility of the market value of our common stock. In addition, for comparability purposes, we believe it is useful to provide a non-GAAP financial measure that excludes stock-based compensation to facilitate the comparison of our results to those of other companies in our industry.
Amortization of intangible assets: Amortization of intangible assets consists of amortization of acquisition-related intangibles assets such as developed technology, customer relationships and trade names acquired in connection with business combinations. We record charges relating to the amortization of these intangibles within both cost of revenues and operating expenses in our GAAP financial statements. Under purchase accounting, we are required to allocate a portion of the purchase price to intangible assets acquired and amortize this amount over the estimated useful lives of the acquired intangible assets. However, the purchase price allocated to these assets is not necessarily reflective of the cost we would incur to internally develop the intangible asset. Further, amortization charges for our acquired intangible assets are inconsistent in size and are significantly impacted by the timing and valuation of our acquisitions. We eliminate these charges from our non-GAAP operating results to facilitate an evaluation of our current operating performance and provide better comparability to our past operating performance.
Restructuring and other costs: Restructuring charges are costs associated with a formal restructuring plan and are primarily related to employee severance and benefit arrangements, contract termination costs, and assets write-offs, as well as other exit and disposal costs. Included in other exit and disposal costs are costs to exit and consolidate facilities in connection with restructuring events. We exclude restructuring and other costs from our non-GAAP results as we believe that these costs are incremental to core activities that arise in the ordinary course of our business and do not reflect our current operating performance, and that excluding these charges facilitates a more meaningful evaluation of our current operating performance and comparisons to our past operating performance.
Acquisition-related and integration costs: These represent the transaction and business integration costs related to significant acquisitions that are charged to operating expense in our GAAP financial statements. These costs include incremental expenses incurred to affect these business combinations such as advisory, legal, accounting, valuation, and other professional or consulting fees. We exclude these costs from our non-GAAP results as they have no direct correlation to the operation of our business, and because we believe that the non-GAAP financial measures excluding these costs provide meaningful supplemental information regarding the spending trends of our business. In addition, these costs vary, depending on the size and complexity of the acquisitions, and are not indicative of costs of future acquisitions.
Litigation costs: We may periodically incur charges or benefits related to litigation settlements, legal contingency accruals and third-party legal costs related to certain legal matters. We exclude these charges and benefits when associated with a significant matter because we do not believe they are reflective of ongoing business and operating results.
Non-cash interest expense and amortization of debt issuance costs: In accordance with GAAP, we separately account for the value of the conversion feature on our convertible notes as a debt discount that reflects our assumed non-convertible debt borrowing rates. We amortize the discount and debt issuance costs over the term of the related debt. We exclude the difference between the imputed interest expense, which includes the amortization of the conversion feature and of the issuance costs, and the coupon interest payments. We extinguished our remaining convertible debt on August 15, 2022. During fiscal 2023, we also started amortizing the debt issuance costs associated with our senior credit facilities, which were secured upon close of the acquisition of Avast. We believe that excluding these costs provides meaningful supplemental information regarding the cash cost of our debt instruments and enhance investors’ ability to view the Company’s results from management’s perspective.
Gain (loss) on extinguishment of debt: We record gains or losses on extinguishment of debt. Gains or losses represent the difference between the fair value of the exchange consideration and the carrying value of the liability component of the debt at the date of extinguishment. We exclude the gain or loss on debt extinguishment in our non-GAAP results because they are not reflective of our ongoing business.
Gain (loss) on equity investments: We record gains or losses, unrealized and realized, on equity investments in privately-held companies. We exclude the net gains or losses because we do not believe they are reflective of our ongoing business.
Gain (loss) on sale of properties: We periodically recognize gains or losses from the disposition of land and buildings. We exclude such gains or losses because they are not reflective of our ongoing business and operating results.
Income tax effects and adjustments: We use a non-GAAP tax rate that excludes (1) the discrete impacts of changes in tax legislation, (2) most other significant discrete items, (3) unrealized gains or losses from remeasurement of foreign currency denominated deferred tax items and uncertain tax benefits, and (4) the income tax effects of the non-GAAP adjustment to our operating results described above. We believe making these adjustments facilitates a better evaluation of our current operating performance and comparisons to past operating results. Our tax rate is subject to change for a variety of reasons, such as significant changes in the geographic earnings mix due to acquisition and divestiture activities or fundamental tax law changes in major jurisdictions where we operate.
Diluted GAAP and non-GAAP weighted-average shares outstanding: Diluted GAAP and non-GAAP weighted-average shares outstanding are generally the same, except in periods when there is a GAAP loss from continuing operations. In accordance with GAAP, we do not present dilution for GAAP in periods in which there is a loss from continuing operations. However, if there is non-GAAP net income, we present dilution for non-GAAP weighted-average shares outstanding in an amount equal to the dilution that would have been presented had there been GAAP income from continuing operations for the period.
Bookings: Bookings are defined as customer orders received that are expected to generate net revenues in the future. We present the operational metric of bookings because it reflects customers’ demand for our products and services and to assist readers in analyzing our performance in future periods.
Free cash flow: Free cash flow is defined as cash flows from operating activities less purchases of property and equipment. Free cash flow is not a measure of financial condition under GAAP and does not reflect our future contractual commitments and the total increase or decrease of our cash balance for a given period, and thus should not be considered as an alternative to cash flows from operating activities or as a measure of liquidity.
(Unlevered) Free cash flow: Free cash flow is defined as cash flows from operating activities less purchases of property and equipment. Unlevered free cash flow excludes cash interest expense payments. Free cash flow is not a measure of financial condition under GAAP and does not reflect our future contractual commitments and the total increase or decrease of our cash balance for a given period, and thus should not be considered as an alternative to cash flows from operating activities or as a measure of liquidity.
Constant currency adjusted revenues (Non-GAAP): Non-GAAP constant currency adjusted revenues are defined as revenues adjusted for the fair value of acquired contract liabilities and foreign exchange impact, calculated by translating current period revenue using the year ago currency conversion rate.
Direct customer count: Direct customers is a metric designed to represent active paid users of our products and solutions who have a direct billing and/or registration relationship with us at the end of the reported period. Average direct customer count presents the average of the total number of direct customers at the beginning and end of the applicable period. We exclude users on free trials from our direct customer count. Users who have indirectly purchased and/or registered for our products or solutions through partners are excluded unless such users convert or renew their subscription directly with us or sign up for a paid membership through our web stores or third-party app stores. While these numbers are based on what we believe to be reasonable estimates of our user base for the applicable period of measurement, there are inherent challenges in measuring usage of our products and solutions across brands, platforms, regions, and internal systems, and therefore, calculation methodologies may differ. The methodologies used to measure these metrics require judgment and are also susceptible to algorithms or other technical errors. We continually seek to improve our estimates of our user base, and these estimates are subject to change due to improvements or revisions to our methodology. From time to time, we review our metrics and may discover inaccuracies or make adjustments to improve their accuracy, which can result in adjustments to our historical metrics. Our ability to recalculate our historical metrics may be impacted by data limitations or other factors that require us to apply different methodologies for such adjustments. We generally do not intend to update previously disclosed metrics for any such inaccuracies or adjustments that are deemed not material.
Direct average revenues per user (ARPU): ARPU is calculated as estimated direct customer revenues for the period divided by the average direct customer count for the same period, expressed as a monthly figure. We monitor ARPU because it helps us understand the rate at which we are monetizing our consumer customer base.
Retention rate: Retention rate is defined as the percentage of direct customers as of the end of the period from one year ago who are still active as of the most recently completed fiscal period. We monitor the retention rate to evaluate the effectiveness of our strategies to improve renewals of subscriptions.
View original content to download multimedia:https://www.prnewswire.com/news-releases/gen-reports-second-quarter-fiscal-year-2025-results-302291977.html
SOURCE Gen Digital Inc.










 Coin Market5 days ago
 Coin Market5 days ago
 Technology5 days ago
 Technology5 days ago
 Technology4 days ago

 Technology5 days ago
 Coin Market4 days ago