Technology
Blockchain Technology Market to grow by USD 11.05 Billion (2023-2027), driven by rising venture capital investments. Report on AI’s impact on market trends – Technavio
Published
1 year agoon
By
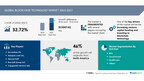
NEW YORK, Nov. 15, 2024 /PRNewswire/ — Report on how AI is redefining market landscape – The global blockchain technology market size is estimated to grow by USD 11.05 billion from 2023-2027, according to Technavio. The market is estimated to grow at a CAGR of 32.72% during the forecast period. Increasing venture capital funding and investing in blockchain technology is driving market growth, with a trend towards high adoption of blockchain solutions for payments. However, security, privacy and blockchain transaction concerns poses a challenge.Key market players include Accenture Plc, Amazon.com Inc., Amcon Soft, Ara Soft Group LLC, Capgemini Service SAS, Cargoledger, ConsenSys Software Inc., Deloitte Touche Tohmatsu Ltd., HCL Technologies Ltd., Hewlett Packard Enterprise Co., Huawei Technologies Co. Ltd., Infosys Ltd., Intel Corp., International Business Machines Corp., OpenLedger, Oracle Corp., PixelPlex Ltd, SAP SE, Tata Sons Pvt. Ltd., and Wipro Ltd..
Key insights into market evolution with AI-powered analysis. Explore trends, segmentation, and growth drivers- View Free Sample PDF
Blockchain Technology Market Scope
Report Coverage
Details
Base year
2022
Historic period
2017 – 2021
Forecast period
2023-2027
Growth momentum & CAGR
Accelerate at a CAGR of 32.72%
Market growth 2023-2027
USD 11047.61 million
Market structure
Fragmented
YoY growth 2022-2023 (%)
30.56
Regional analysis
North America, Europe, APAC, South America, and Middle East and Africa
Performing market contribution
North America at 46%
Key countries
US, Canada, China, UK, and Germany
Key companies profiled
Accenture Plc, Amazon.com Inc., Amcon Soft, Ara Soft Group LLC, Capgemini Service SAS, Cargoledger, ConsenSys Software Inc., Deloitte Touche Tohmatsu Ltd., HCL Technologies Ltd., Hewlett Packard Enterprise Co., Huawei Technologies Co. Ltd., Infosys Ltd., Intel Corp., International Business Machines Corp., OpenLedger, Oracle Corp., PixelPlex Ltd, SAP SE, Tata Sons Pvt. Ltd., and Wipro Ltd.
Market Driver
Blockchain technology is revolutionizing various industries by providing secure digital IDs and streamlined payment environments. Market related cryptocurrencies like Bitcoin and Ethereum are leading the charge, addressing weak identification laws at the national level. Large enterprises in sectors such as healthcare, life sciences, IT and telecommunication, travel and hospitality, and banking are adopting blockchain for payment and transaction processing, smart contracts, and document management. Middleware providers like IBM Blockchain Platform, Polygon, and Hyperledger offer solutions for multi-party systems and multi-cloud offerings. IOT connectivity and real-time analytics are also key applications. Regulatory acceptance and standardization are crucial for mass adoption. Technical skillset is in high demand for blockchain technology solutions. Venture capitalists are pouring capital into this space, fueling innovation in DeFi, Crypto Asset Markets, and ICOs. Regulators and policymakers are collaborating at both national and international levels to ensure efficiency, security, and interoperability. Patents and research activities are driving innovation in this exciting field. Public service delivery, manufacturing, transportation, and eCommerce are also exploring blockchain’s potential. Security is a top priority for all stakeholders.
Blockchain technology has gained significant traction in the payments sector as numerous businesses and organizations have adopted it for their payment operations. This technology enables quick, secure, and affordable transactions, making it an attractive option for various industries. Bitcoin, a decentralized digital currency utilizing blockchain technology, has garnered a substantial following due to its fast transaction processing times and low fees. Another popular blockchain-based payment method is stablecoins, which have seen increasing usage in recent years. These digital currencies offer stability in value and can facilitate seamless transactions between parties. Overall, the adoption of blockchain technology in payments is a noteworthy trend that continues to shape the financial landscape.
Request Sample of our comprehensive report now to stay ahead in the AI-driven market evolution!
Market Challenges
Blockchain technology is revolutionizing various industries by providing secure and transparent digital solutions. However, challenges persist in areas like digital identity and market-related cryptocurrencies due to weak identification laws at the national level. To address this, secure digital IDs are being developed using blockchain. In payment environments, high transaction fees and the need for service providers and middleware providers add complexity. Ethereum, Openchain, and Hyperledger are popular blockchain platforms, with large enterprises exploring payment and transaction use cases through smart contracts. Industries like healthcare, life sciences, IT and telecommunication, travel and hospitality, and banking are adopting blockchain for document management, exchanges, and real-time analytics. Technical skillset is essential for implementing these solutions, with venture capitalists and capital inflows driving innovation in DeFi, crypto asset markets, and ICOs. Regulatory acceptance and standardization are crucial for widespread adoption, with government bodies and policymakers collaborating at both national and international levels. IoT technology and real-time analytics are also being integrated into blockchain solutions for industries like logistics and supply chain management. Patents, security, and efficiency are key considerations, with eCommerce, manufacturing, and transportation also exploring blockchain’s potential.Blockchain technology offers a secure and transparent platform for various transactions, providing a decentralized system where networks of nodes validate and verify each transaction. This adds an extra layer of security compared to traditional systems. However, potential risks such as unauthorized access to networks and digital asset theft remain. Effective security measures are essential to safeguard user data and assets, ensuring the integrity and trustworthiness of blockchain technology in business applications. Despite these challenges, the technology’s decentralized nature makes it difficult for one party to control the system, offering significant potential for secure and efficient business transactions.
Discover how AI is revolutionizing market trends- Get your access now!
Segment Overview
This blockchain technology market report extensively covers market segmentation by
End-user 1.1 BFSI1.2 Government1.3 Healthcare1.4 OthersType 2.1 Private2.2 Public2.3 HybridGeography 3.1 North America3.2 Europe3.3 APAC3.4 South America3.5 Middle East and Africa
1.1 BFSI- In the BFSI sector, blockchain technology (BT) is utilized to reduce fraud, execute smart contracts, process payments, and conduct know-your-customer (KYC) due diligence. Financial institutions are implementing BT for post-trade settlement, payments, reference data, and trade finance. Although challenges, such as a lack of trust in BT by officials and the need for regulatory compliance, exist, the efficiency gains from operational and labor cost savings can significantly impact the industry. BT can streamline KYC processes by enabling independent verification of clients, reducing the need for repetition among financial institutions and lowering administrative costs. Fraud and theft are significant issues for financial institutions, with billions of dollars lost annually due to centralized databases being vulnerable to hacking. BT’s distributed ledger technology offers enhanced security by providing a tamper-proof, decentralized database. Compliance with current and future privacy laws is crucial for BT in the BFSI sector. Although regulations are currently limited, new ones are expected to be introduced to ensure data security. Additionally, BT must be scalable to handle large data sets, contributing to the growth of this segment in the global blockchain technology market.
Download a Sample of our comprehensive report today to discover how AI-driven innovations are reshaping competitive dynamics
Research Analysis
Blockchain Technology is revolutionizing various industries by providing a decentralized, secure, and transparent solution for digital transactions. The market for blockchain technology is expanding rapidly, driven by the need for secure digital IDs and the growth of market-related cryptocurrencies. However, weak identification laws at the national level pose a challenge to the widespread adoption of blockchain technology. In payment environments, blockchain technology offers lower transaction fees and increased security compared to traditional methods. Service providers and middleware providers are playing a crucial role in the implementation of blockchain technology in industries such as logistics, supply chain management, banking, and more. Ethereum, Openchain, and Hyperledger are some of the popular blockchain platforms used for building decentralized applications. The technical skillset required to work with blockchain technology is in high demand, leading to an influx of venture capitalists and capital inflows into the industry. Web3, DeFi, and crypto asset markets are some of the emerging areas where blockchain technology is making a significant impact. The future of blockchain technology looks promising, with endless possibilities for innovation and disruption.
Market Research Overview
Blockchain Technology is revolutionizing various industries by providing secure and decentralized digital solutions. The market related to cryptocurrencies is a significant part of this technology, but its applications extend beyond just digital currencies. Weak identification laws at the national level are driving the demand for secure digital IDs in payment environments. Ethereum, Openchain, Hyperledger, and other blockchain platforms are enabling large enterprises to build payment and transaction systems using smart contracts. Middleware providers are facilitating the integration of these solutions into existing systems. Sectors like healthcare, life sciences, IT and telecommunication, travel and hospitality, and logistics and supply chain management are exploring the potential of blockchain technology. Technical skills in blockchain technology solutions are in high demand, attracting venture capitalists and capital inflows. Web3, DeFi, and crypto asset markets are emerging areas of interest. Regulatory acceptance and standardization are crucial for the growth of this technology at international levels. IoT technology and real-time analytics are also being integrated into blockchain systems. Government bodies are investing in research activities and public service delivery for increased efficiency. Patents and security are key concerns for the industry. ECommerce, manufacturing, transportation, and banking are also adopting blockchain technology for various use cases.
Table of Contents:
1 Executive Summary
2 Market Landscape
3 Market Sizing
4 Historic Market Size
5 Five Forces Analysis
6 Market Segmentation
End-userBFSIGovernmentHealthcareOthersTypePrivatePublicHybridGeographyNorth AmericaEuropeAPACSouth AmericaMiddle East And Africa
7 Customer Landscape
8 Geographic Landscape
9 Drivers, Challenges, and Trends
10 Company Landscape
11 Company Analysis
12 Appendix
About Technavio
Technavio is a leading global technology research and advisory company. Their research and analysis focuses on emerging market trends and provides actionable insights to help businesses identify market opportunities and develop effective strategies to optimize their market positions.
With over 500 specialized analysts, Technavio’s report library consists of more than 17,000 reports and counting, covering 800 technologies, spanning across 50 countries. Their client base consists of enterprises of all sizes, including more than 100 Fortune 500 companies. This growing client base relies on Technavio’s comprehensive coverage, extensive research, and actionable market insights to identify opportunities in existing and potential markets and assess their competitive positions within changing market scenarios.
Contacts
Technavio Research
Jesse Maida
Media & Marketing Executive
US: +1 844 364 1100
UK: +44 203 893 3200
Email: media@technavio.com
Website: www.technavio.com/
View original content to download multimedia:https://www.prnewswire.com/news-releases/blockchain-technology-market-to-grow-by-usd-11-05-billion-2023-2027-driven-by-rising-venture-capital-investments-report-on-ais-impact-on-market-trends—technavio-302306273.html
SOURCE Technavio
You may like
Technology
FLEX REPORTS FOURTH QUARTER AND FISCAL 2026 RESULTS
Published
50 minutes agoon
May 5, 2026By
Reported Q4 net sales of $7.5 billion, and full-year net sales of $27.9 billion, up 17% and 8%, respectively, versus the prior year.Delivered Q4 GAAP operating margin of 5.0%, and adjusted operating margin of 6.7%, our sixth consecutive quarter with an adjusted operating margin of 6% or greater.Delivered full-year GAAP operating margin of 4.9%, and adjusted operating margin of 6.3%, another record for Flex.Reported Q4 GAAP EPS of $0.67, and adjusted EPS of $0.93.Reported full-year GAAP EPS of $2.33, and adjusted EPS of $3.30.
AUSTIN, Texas, May 5, 2026 /PRNewswire/ — Flex (NASDAQ: FLEX) today announced results for its fourth quarter and fiscal year ended March 31, 2026.
“Our strong finish to FY 2026 reflects disciplined execution and a clear strategy, supported by targeted acquisitions and capital investments aligned to Flex’s long-term growth opportunities,” said Revathi Advaithi, CEO of Flex.
Fourth Quarter Fiscal Year 2026 GAAP Summary:
Net Sales: $7.5 billionGAAP Operating Income: $372 millionGAAP Net Income: $250 millionGAAP Earnings Per Share: $0.67Cash provided by Operating Activities: $413 million
Fourth Quarter Fiscal Year 2026 Non-GAAP Summary:
Adjusted Operating Income: $500 millionAdjusted Net Income: $348 millionAdjusted Earnings Per Share: $0.93Free Cash Flow: $212 million
Fiscal Year 2026 GAAP Summary:
Net Sales: $27.9 billionGAAP Operating Income: $1,368 millionGAAP Net Income: $880 millionGAAP Earnings Per Share: $2.33Cash provided by Operating Activities: $1,685 million
Fiscal Year 2026 Non-GAAP Summary:
Adjusted Operating Income: $1,764 millionAdjusted Net Income: $1,248 million Adjusted Earnings Per Share: $3.30Free Cash Flow: $1,060 million
An explanation and reconciliation of GAAP financial measures to non-GAAP financial measures is presented in Schedules II and V attached to this press release.
First Quarter Fiscal Year 2027 Guidance:
Net Sales: $7.35 billion to $7.65 billion, growth of 14% at the midpointAdjusted Operating Income: $469 million to $499 million*Adjusted EPS: $0.86 to $0.92*, growth of 24% at the midpointInterest & Other: approximately $65 millionAdjusted income tax rate: 21%*Weighted average shares outstanding: approximately 374 million
Fiscal Year 2027 Guidance†:
Net Sales: $32.3 billion to $33.8 billion, growth of 18% at the midpointAdjusted Operating Margin: 7.0% to 7.1%*Adjusted EPS: $4.21 to $4.51*, growth of 32% at the midpointAdjusted income tax rate: 21%*
*This is a forward-looking non-GAAP financial measure that cannot be reconciled to its equivalent GAAP financial measure without unreasonable effort for the reasons set forth in Schedule V attached to this press release.
†Reflects expected results for the full fiscal year and does not give effect to the planned spin-off of the Cloud and Power Infrastructure segment announced today.
Webcast and Conference Call
The Flex management team will host a conference call tomorrow, May 6, 2026 at 7:30 AM (CT) / 8:30 AM (ET), to review fourth quarter and fiscal year 2026 results. A live webcast of the event and slides will be available on the Flex Investor Relations website at http://investors.flex.com. An audio replay and transcript will also be available after the event on the Flex Investor Relations website.
About Flex
Flex (Reg. No. 199002645H) is the manufacturing partner of choice that helps leading brands design, build, and manage products that improve the world. With a global footprint spanning 30 countries, Flex delivers advanced manufacturing and supply chain solutions, innovative products and technology, and lifecycle services that support customers from concept to scale. In the AI era, Flex is helping customers accelerate data center deployment by solving power, heat, and scale challenges through cutting-edge power and cooling technology and scalable IT infrastructure solutions.
Contacts
Investors & Analysts
Michelle Simmons
Senior Vice President, Global Investor Relations and Public Relations
(669) 242-6332
Michelle.Simmons@flex.com
Media & Press
publicrelations@flex.com
Forward-Looking Statements
This press release contains forward-looking statements within the meaning of U.S. securities laws, including statements related to our future financial results and our guidance for future financial performance (including expected revenues, operating income, margins and earnings per share). These forward-looking statements are based on current expectations, forecasts and assumptions involving risks and uncertainties that could cause the actual outcomes and results to differ materially from those anticipated by these forward-looking statements. Readers are cautioned not to place undue reliance on these forward-looking statements. These risks include: that we may not achieve our expected future operating results; risks related to our ability to successfully execute our strategic priorities, including the planned spin-off of our Cloud and Power Infrastructure segment into an independent, publicly traded company, and to achieve the anticipated benefits of such transaction, including risks that the spin-off may not be completed on the anticipated timeline or at all, that the spin-off may not achieve its intended benefits, that the transaction may have an adverse impact on existing business relationships, and that the costs of the spin-off may be greater than anticipated; the effects that the current and future macroeconomic environment, including inflationary pressures, currency volatility, stagflation, slower economic growth or recession, and high or rising interest rates, could have on our business and demand for our products; geopolitical uncertainties and risks, including impacts from trade conflicts, the termination and renegotiation of international trade agreements and trade policies, a further escalation of sanctions, tariffs or other trade tensions between the U.S. and China or other countries, or the ongoing conflicts between Russia and Ukraine and in the Middle East, including recent developments in Iran, any of which could lead to disruption, instability, and volatility in global markets and negatively impact our operations and financial performance; supply chain disruptions, including those involving suppliers who are sole or primary sources, logistical constraints, manufacturing interruptions or delays, or the failure to accurately forecast customer demand; the impact of fluctuations in the pricing or availability of raw materials and components, including semiconductors, labor and energy; our dependence on industries that continually produce technologically advanced products with short product life cycles; the short-term nature of our customers’ commitments and rapid changes in demand may cause supply chain issues, excess and obsolete inventory and other issues which adversely affect our operating results; our dependence on a small number of customers; risks associated with acquisitions and divestitures, including the possibility that we may not fully realize their projected benefits, including the acquisition of Electrical Power Products, Inc., and other events that could adversely impact the anticipated benefits of the acquisition, including industry or economic conditions outside of our control; our industry is extremely competitive; that the expected revenue and margins from recently launched programs may not be realized; the challenges of effectively managing our operations, including our ability to control costs and manage changes in our operations; the possibility that benefits of our restructuring actions may not materialize as expected; a breach of our IT or physical security systems, or violation of data privacy laws, may cause us to incur significant legal and financial exposure and adversely affect our operations; hiring and retaining key personnel; that recent changes or future changes in tax laws in certain jurisdictions where we operate could materially impact our tax expense; litigation and regulatory investigations and proceedings; the impact and effects on our business, results of operations and financial condition of union disputes or other labor disruptions as well as unforeseen or catastrophic events; the effects that current and future credit and market conditions could have on the liquidity and financial condition of our customers and suppliers, including any impact on their ability to meet their contractual obligations to us and our ability to pass through costs to our customers; the success of certain of our activities depends on our ability to protect our intellectual property rights and we may be exposed to claims of infringement, misuse or breach of license agreements; physical and operational risks from natural disasters, severe weather events, or climate change; we may be exposed to product liability and product warranty liability; we may be exposed to financially troubled customers or suppliers; our compliance with legal and regulatory requirements; changes in laws, regulations, or policies that may impact our business, including those related to trade policy and tariffs and climate change; our ability to meet sustainability, including environmental, social and governance, expectations or standards or achieve sustainability goals.
Additional information concerning these and other risks is described under “Risk Factors” and “Management’s Discussion and Analysis of Financial Condition and Results of Operations” in our most recent Annual Report on Form 10-K and in our subsequent filings with the U.S. Securities and Exchange Commission. Additional information concerning risks related to the planned spin-off is described in the separate press release issued today. Flex assumes no obligation to update any forward-looking statements, which speak only as of the date they are made.
SCHEDULE I
FLEX
UNAUDITED CONDENSED CONSOLIDATED STATEMENTS OF OPERATIONS
(In millions, except per share amounts)
Three-Month Periods Ended
March 31, 2026
March 31, 2025
GAAP:
Net sales
$ 7,477
$ 6,398
Cost of sales
6,747
5,807
Restructuring charges
28
28
Gross profit
702
563
Selling, general and administrative expenses
289
234
Restructuring and impairment charges
25
3
Intangible amortization
16
21
Operating income
372
305
Interest expense
54
52
Interest income
13
13
Other charges (income), net
11
(13)
Equity in earnings (losses) of unconsolidated affiliates
(5)
—
Income before income taxes
315
279
Provision for (benefit from) income taxes
65
57
Net income
$ 250
$ 222
GAAP EPS
Diluted earnings per share
$ 0.67
$ 0.57
Diluted shares used in computing per share amounts
374
389
See Schedule II for the reconciliation of GAAP to non-GAAP financial measures. See the accompanying notes
on Schedule V attached to this press release.
FLEX
UNAUDITED CONDENSED CONSOLIDATED STATEMENTS OF OPERATIONS
(In millions, except per share amounts)
Twelve-Month Periods Ended
March 31, 2026
March 31, 2025
GAAP:
Net sales
$ 27,914
$ 25,813
Cost of sales
25,288
23,584
Restructuring charges
59
70
Gross profit
2,567
2,159
Selling, general and administrative expenses
1,052
904
Restructuring and impairment charges
79
16
Intangible amortization
68
70
Operating income
1,368
1,169
Interest expense
215
218
Interest income
51
61
Other charges (income), net
30
(14)
Equity in earnings (losses) of unconsolidated affiliates
(31)
(3)
Income before income taxes
1,143
1,023
Provision for (benefit from) income taxes
263
185
Net income
$ 880
$ 838
GAAP EPS
Diluted earnings per share
$ 2.33
$ 2.11
Diluted shares used in computing per share amounts
378
398
See Schedule II for the reconciliation of GAAP to non-GAAP financial measures. See the accompanying notes
on Schedule V attached to this press release.
SCHEDULE II
FLEX
RECONCILIATION OF GAAP TO NON-GAAP FINANCIAL MEASURES
(In millions, except per share amounts and percentages)
Three-Month Periods Ended
March 31, 2026
March 31, 2025
GAAP operating income and margin %
$ 372
5.0 %
$ 305
4.8 %
Intangible amortization
16
21
Stock-based compensation
34
32
Restructuring and impairment charges
52
30
Customer related asset impairment
—
4
Legal and other
26
4
Non-GAAP operating income and margin %
$ 500
6.7 %
$ 396
6.2 %
GAAP provision for income taxes
$ 65
$ 57
Intangible amortization benefit
3
5
Other tax related adjustments
25
3
Non-GAAP provision for income taxes
$ 93
$ 65
GAAP net income
$ 250
$ 222
Intangible amortization
16
21
Stock-based compensation
34
32
Restructuring and impairment charges
52
30
Customer related asset impairment
—
4
Legal and other
26
4
Interest and other, net
(2)
(20)
Adjustments for taxes
(28)
(8)
Non-GAAP net income
$ 348
$ 285
Diluted earnings per share:
GAAP
$ 0.67
$ 0.57
Non-GAAP
$ 0.93
$ 0.73
Free Cash Flow:
Net cash provided by operating activities
$ 413
$ 433
Purchases of property and equipment
(202)
(112)
Proceeds from the disposition of property and equipment
1
4
Free Cash Flow
$ 212
$ 325
See the accompanying notes on Schedule V attached to this press release.
FLEX
RECONCILIATION OF GAAP TO NON-GAAP FINANCIAL MEASURES
(In millions, except per share amounts and percentages)
Twelve-Month Periods Ended
March 31, 2026
March 31, 2025
GAAP operating income and margin %
$ 1,368
4.9 %
$ 1,169
4.5 %
Intangible amortization
68
70
Stock-based compensation
142
125
Restructuring and impairment charges
135
84
Customer related asset impairment (recoveries)
(2)
2
Legal and other
53
9
Non-GAAP operating income and margin %
$ 1,764
6.3 %
$ 1,459
5.7 %
GAAP provision for income taxes
$ 263
$ 185
Intangible amortization benefit
15
15
Other tax related adjustments
54
43
Non-GAAP provision for income taxes
$ 332
$ 243
GAAP net income
$ 880
$ 838
Intangible amortization
68
70
Stock-based compensation
142
125
Restructuring and impairment charges
135
84
Customer related asset impairment (recoveries)
(2)
2
Legal and other
53
9
Equity in losses of unconsolidated affiliates
25
—
Interest and other, net
16
(15)
Adjustments for taxes
(69)
(58)
Non-GAAP net income
$ 1,248
$ 1,055
Diluted earnings per share:
GAAP
$ 2.33
$ 2.11
Non-GAAP
$ 3.30
$ 2.65
Free Cash Flow:
Net cash provided by operating activities
$ 1,685
$ 1,505
Purchases of property and equipment
(633)
(438)
Proceeds from the disposition of property and
equipment
8
15
Free Cash Flow
$ 1,060
$ 1,082
See the accompanying notes on Schedule V attached to this press release.
SCHEDULE III
FLEX
UNAUDITED CONDENSED CONSOLIDATED BALANCE SHEETS
(In millions)
As of March 31, 2026
As of March 31, 2025
ASSETS
Current assets:
Cash and cash equivalents
$ 2,389
$ 2,289
Accounts receivable, net of allowance for doubtful accounts
4,679
3,671
Contract assets
1,063
616
Inventories
5,845
5,071
Other current assets
2,356
1,194
Total current assets
16,332
12,841
Property and equipment, net
2,505
2,330
Operating lease right-of-use assets, net
659
562
Goodwill
1,369
1,341
Other intangible assets, net
283
343
Other non-current assets
912
964
Total assets
$ 22,060
$ 18,381
LIABILITIES AND SHAREHOLDERS’ EQUITY
Current liabilities:
Bank borrowings and current portion of long-term debt
$ —
$ 1,209
Accounts payable
8,055
5,147
Accrued payroll and benefits
671
560
Deferred revenue and customer working capital advances
2,156
1,957
Other current liabilities
1,134
977
Total current liabilities
12,016
9,850
Long-term debt, net of current portion
3,751
2,483
Operating lease liabilities, non-current
565
456
Other non-current liabilities
584
590
Total liabilities
16,916
13,379
Total shareholders’ equity
5,144
5,002
Total liabilities and shareholders’ equity
$ 22,060
$ 18,381
SCHEDULE IV
FLEX
UNAUDITED CONDENSED CONSOLIDATED STATEMENTS OF CASH FLOWS
(In millions)
Twelve-Month Periods
Ended
March 31, 2026
March 31, 2025
CASH FLOWS FROM OPERATING ACTIVITIES:
Net income
$ 880
$ 838
Depreciation, amortization and other impairment charges
563
539
Changes in working capital and other, net
242
128
Net cash provided by operating activities
1,685
1,505
CASH FLOWS FROM INVESTING ACTIVITIES:
Purchases of property and equipment
(633)
(438)
Proceeds from the disposition of property and equipment
8
15
Acquisitions of businesses, net of cash acquired
(40)
(405)
Proceeds from divestiture of businesses, net of cash held in divested businesses
(4)
(21)
Other investing activities, net
(3)
11
Net cash used in investing activities
(672)
(838)
CASH FLOWS FROM FINANCING ACTIVITIES:
Proceeds from bank borrowings and long-term debt
1,251
499
Payments of bank borrowings, long-term debt and other financing liabilities
(1,217)
(58)
Payments for repurchases of ordinary shares
(944)
(1,257)
Other financing activities, net
(14)
(5)
Net cash used in financing activities
(924)
(821)
Effect of exchange rates on cash and cash equivalents
11
(31)
Net (decrease) increase in cash and cash equivalents
100
(185)
Cash and cash equivalents, beginning of year
2,289
2,474
Cash and cash equivalents, end of year
$ 2,389
$ 2,289
SCHEDULE V
FLEX AND SUBSIDIARIES
NOTES TO SCHEDULES I and II
To supplement Flex’s unaudited selected financial data presented consistent with U.S. Generally Accepted Accounting Principles (“GAAP”), the Company discloses certain non-GAAP financial measures that exclude certain charges and gains, including non-GAAP operating income, non-GAAP net income and non-GAAP net income per diluted share. These supplemental measures exclude certain legal and other charges, restructuring charges, customer-related asset impairments (recoveries), stock-based compensation expense, intangible amortization, other discrete events as applicable and the related tax effects. These non-GAAP measures are not in accordance with or an alternative for GAAP and may be different from non-GAAP measures used by other companies. We believe that these non-GAAP measures have limitations in that they do not reflect all of the amounts associated with Flex’s results of operations as determined in accordance with GAAP and that these measures should only be used to evaluate Flex’s results of operations in conjunction with the corresponding GAAP measures. The presentation of this additional information is not meant to be considered in isolation or as a substitute for the most directly comparable GAAP measures. We compensate for the limitations of non-GAAP financial measures by relying upon GAAP results to gain a complete picture of the Company’s performance.
In calculating non-GAAP financial measures, we exclude certain items to facilitate a review of the comparability of the Company’s operating performance on a period-to-period basis because such items are not, in our view, related to the Company’s ongoing operational performance. We use non-GAAP measures to evaluate the operating performance of our business, for comparison with forecasts and strategic plans, for calculating return on investment, and for benchmarking performance externally against competitors. In addition, management’s incentive compensation is determined using certain non-GAAP measures. Also, when evaluating potential acquisitions, we exclude certain items described below from consideration of the target’s performance and valuation. Since we find these measures to be useful, we believe that investors benefit from seeing results “through the eyes” of management in addition to seeing GAAP results. We believe that these non-GAAP measures, when read in conjunction with the Company’s GAAP financials, provide useful information to investors by offering:
the ability to make more meaningful period-to-period comparisons of the Company’s ongoing operating results;the ability to better identify trends in the Company’s underlying business and perform related trend analysis;a better understanding of how management plans and measures the Company’s underlying business; andan easier way to compare the Company’s operating results against analyst financial models and operating results of competitors that supplement their GAAP results with non-GAAP financial measures.
We present forward‑looking non‑GAAP financial measures in our first quarter and full year fiscal 2027 guidance, including adjusted operating income, adjusted operating margin, adjusted income tax rate, and adjusted EPS. We do not provide a reconciliation of these measures to the most directly comparable GAAP measures because the information necessary to do so is not available without unreasonable effort due to the inherent variability, complexity, and uncertainty in forecasting certain items required for such a reconciliation. These items may include restructuring charges and impairment charges, among others. The information that is unavailable could be material and could significantly affect our GAAP results.
The following are explanations of each of the adjustments that we incorporate into non-GAAP measures, as well as the reasons for excluding each of these individual items in the reconciliations of these non-GAAP financial measures:
Stock-based compensation expense consists of non-cash charges for the estimated fair value of unvested restricted share units granted to employees and assumed in business acquisitions. The Company believes that the exclusion of these charges provides for more accurate comparisons of its operating results to peer companies due to the varying available valuation methodologies, subjective assumptions and the variety of award types. In addition, the Company believes it is useful to investors to understand the specific impact stock-based compensation expense has on its operating results.
Intangible amortization consists primarily of non-cash charges that can be impacted by, among other things, the timing and magnitude of acquisitions. The Company considers its operating results without these charges when evaluating its ongoing performance and forecasting its earnings trends, and therefore excludes such charges when presenting non-GAAP financial measures. The Company believes that the assessment of its operations excluding these costs is relevant to its assessment of internal operations and comparisons to the performance of its competitors.
Restructuring and impairment charges include severance charges at existing sites and corporate SG&A functions as well as asset impairment, and other charges related to the closures and consolidations of certain operating sites and targeted activities to restructure the business. These costs also include asset impairment charges related to assets significantly impacted by the geopolitical events on the basis of management’s best estimate of the recoverable value of assets. These costs may vary in size based on the Company’s initiatives, are not directly related to ongoing or core business results, and do not reflect expected future operating expenses. These costs are excluded by the Company’s management in assessing current operating performance and forecasting its earnings trends and are therefore excluded by the Company from its non-GAAP measures.
During the three and twelve-month periods ended March 31, 2026, the Company recognized approximately $47 million and $84 million of restructuring charges, respectively, most of which related to employee severance. During the three and twelve-month periods ended March 31, 2025, the Company recognized $30 million and $84 million of restructuring charges, respectively, most of which related to employee severance.
During the three and twelve-month periods ended March 31, 2026, the Company recognized $5 million and $51 million, respectively, in asset impairments, inventory write-downs and other charges as a result of an August 21, 2025 missile strike on the Company’s Mukachevo, Ukraine operations located in Western Ukraine. The August 21, 2025 missile strike represents an unusual and infrequent event as hostilities related to the Russian invasion of Ukraine have been primarily focused in Eastern Ukraine. The missile strike caused substantial destruction, disrupted Mukachevo’s normal operations and Flex initiated contingency manufacturing plans at alternative manufacturing facilities. The Company expects additional immaterial near-term inefficiencies as Mukachevo’s operations are restored.
Customer related asset impairments (recoveries) may consist of non-cash impairments of property and equipment to estimated fair value for customers from whom we have disengaged or are in the process of disengaging as well as additional provisions for doubtful accounts receivable for customers that are experiencing financial difficulties and inventory that is considered non-recoverable that is written down to net realizable value. In subsequent periods, the Company may recover a portion of the costs previously incurred related to assets impaired or reduced to net realizable value. During the three and twelve-month periods ended March 31, 2026, the Company recognized zero and $2 million of customer related asset recoveries, respectively. During the three and twelve-month periods ended March 31, 2025, the Company recognized approximately $4 million and $2 million of customer related asset impairments, respectively. These costs are excluded by the Company’s management in assessing current operating performance and forecasting its earnings trends and are therefore excluded by the Company from its non-GAAP measures.
Legal and other consist primarily of costs not directly related to core business results and may include matters relating to commercial disputes, government regulatory and compliance, intellectual property, antitrust, tax, employment or shareholder issues, product liability claims and other costs such as acquisition, portfolio optimization related costs and asset impairment. These costs are excluded by the Company’s management in assessing current operating performance and forecasting its earnings trends and are therefore excluded by the Company from its non-GAAP measures. During the three and twelve-month periods ended March 31, 2026, the Company incurred approximately $26 million and $53 million, respectively, primarily related to the planned spin-off of its Cloud and Power Infrastructure segment into a separate publicly traded company combined with other portfolio optimization costs. During the three and twelve-month periods ended March 31, 2025, the Company incurred $4 million and $9 million, respectively, related to asset impairment and acquisitions costs.
Equity in losses of unconsolidated affiliates consists of various other types of items that are not directly related to ongoing or core business results, such as significant gains or losses associated with certain non-core investments. The Company excludes these items because they are not related to the Company’s ongoing operating performance or do not affect core operations. Excluding these amounts provides investors with a basis to compare Company performance against the performance of other companies without this variability. During the twelve-month period ended March 31, 2026, the Company recognized approximately $25 million of equity in losses from a reduced valuation of a certain non-core investment fund. No such event occurred in the fiscal year 2025.
Interest and other, net consist of various other types of items that are not directly related to ongoing or core business results, such as the gain or losses related to certain divestitures, currency translation reserve write-offs upon liquidation of certain legal entities, debt extinguishment costs and impairment charges or gains associated with certain non-core investments. The Company excludes these items because they are not related to the Company’s ongoing operating performance or do not affect core operations. During the twelve-month period ended March 31, 2026, the Company incurred $16 million predominantly related to an impairment of a non-core unconsolidated cost method investment. During the twelve-month period ended March 31, 2025, the Company realized a $19 million bargain purchase gain from an acquisition where the fair value of identifiable assets was in excess of the purchase consideration. Excluding these amounts provides investors with a basis to compare Company performance against the performance of other companies without this variability.
Adjustments for taxes relates to the tax effects of the various adjustments that we incorporate into non-GAAP measures in order to provide a more meaningful measure on non-GAAP net income and certain adjustments related to non-recurring settlements of tax contingencies or other non-recurring tax charges, when applicable. Effective in fiscal year 2026, the Company adopted an annual normalized tax rate for the purpose of determining the tax effect of non-GAAP adjustments. In estimating the normalized tax rate, the Company utilizes a full-year projection of earnings that considers the mix of earnings across tax jurisdictions, existing tax positions and other significant tax matters.
During the three and twelve-month periods ended March 31, 2026, the Company recognized a $28 million and $69 million net tax benefit, respectively, and during the three and twelve-month periods ended March 31, 2025, the Company recognized a $8 million and $58 million net tax benefit, respectively, related to the tax effects of various adjustments. During the twelve-month period ended March 31, 2026, the Company incurred a charge to income tax expense of $19 million related to the resolution of a tax dispute with a foreign tax authority related to fiscal years 2010 through 2020.
Free cash flow is an important liquidity metric because it measures, during a given period, the amount of cash generated that is available to repay debt obligations, make investments, fund acquisitions, repurchase company shares and for certain other activities. The Company’s free cash flow is defined as cash flows from operating activities, less net purchases of property and equipment and proceeds from the disposition of property and equipment (“net capital expenditures”), allowing us to present free cash flow on a consistent basis for investors.
During the three and twelve-month periods ended March 31, 2026, the Company recognized $212 million and $1,060 million of free cash inflow, respectively. During the three and twelve-month periods ended March 31, 2025, the Company recognized $325 million and $1,082 million of free cash inflow, respectively. Free cash flow is not a measure of liquidity under U.S. GAAP, and may not be defined and calculated by other companies in the same manner.
View original content to download multimedia:https://www.prnewswire.com/news-releases/flex-reports-fourth-quarter-and-fiscal-2026-results-302763098.html
SOURCE Flex
Technology
LifeSpeak Appoints Flint Brenton as Acting Chief Executive Officer
Published
50 minutes agoon
May 5, 2026By
Leadership transition supports the company’s next phase of innovation, operational excellence, and customer-focused growth
MINNEAPOLIS, May 5, 2026 /PRNewswire-PRWeb/ — LifeSpeak Inc. today announced the appointment of Flint Brenton as Acting Chief Executive Officer, effective immediately.
Brenton succeeds Jason Campana, who stepped down as Acting CEO following more than 14 years with the company.
Brenton will continue serving as Chairman of LifeSpeak’s Board throughout this transition period and will work closely with the permanent CEO, once appointed, to help ensure continuity, alignment, and long-term stability across the business.
As LifeSpeak enters its next phase of growth, the company is focused on strengthening operational excellence, deepening customer and partner alignment, and accelerating innovation across its wellbeing solutions.
“LifeSpeak has an incredible opportunity ahead,” said Flint Brenton. “We are focused on building a stronger, more aligned organization that delivers meaningful innovation for our customers, stronger engagement experiences for members, and measurable outcomes for the organizations we serve. By strengthening execution and maintaining a sharp focus on customer needs, we believe we can create significant long-term value for our clients, partners, and members.”
Brenton brings more than 20 years of experience leading high-growth technology and SaaS organizations through periods of transformation, operational scaling, and strategic growth. Over the course of his career, he has served as CEO of companies including Centrify, CollabNet VersionOne, AccelOps, Tidal Software, and Syntellis Performance Solutions. Brenton has built a strong reputation for aligning teams around strategic priorities, strengthening organizational culture, and helping companies navigate complex periods of growth and change with greater operational discipline and execution.
In addition to his operational leadership experience, Brenton has a longstanding personal commitment to mental health and wellbeing. He recently completed a master’s degree in counseling and has dedicated significant time supporting individuals and families navigating mental health challenges.
“Flint brings a strong combination of operational leadership, strategic focus, and people-centered leadership. As LifeSpeak continues evolving to meet the changing needs of customers and members, we believe his experience will help strengthen execution, accelerate innovation, and support the company’s long-term growth strategy,” stated Beedie Capital.
The LifeSpeak Board of Directors also expressed gratitude to Jason Campana for his contributions over the past several years.
“We want to sincerely thank Jason for the impact he has had on LifeSpeak over the last 14 years,” stated the Board of Directors. “His leadership and dedication helped shape the company and build the foundation that supports the business today. We are grateful for his many contributions and wish him the very best moving forward.”
LifeSpeak leadership will continue engaging closely with employees, customers, and partners throughout the transition as the company advances its focus on innovation, engagement, and long-term customer success.
For more information about LifeSpeak, visit www.lifespeak.com.
About LifeSpeak
LifeSpeak is a leading provider of digital wellbeing solutions, supporting more than 14 million people across 1,000+ organizations worldwide. Our expert-led, AI-powered platform helps individuals navigate their health at every stage—from managing existing challenges to building healthier habits that last. From mental and physical health to caregiving and substance use health, LifeSpeak delivers personalized guidance that improves health outcomes, lowers health claims, and builds healthier, more engaged, higher-performing teams. Trusted by top employers and wellness partners, LifeSpeak is shaping the future of population health. Learn more at www.lifespeak.com.
Media Contact
Esther Korotkin, LifeSpeak Inc., 1 (866) 287-4118, marketing@lifespeak.com, www.lifespeak.com
View original content:https://www.prweb.com/releases/lifespeak-appoints-flint-brenton-as-acting-chief-executive-officer-302763045.html
SOURCE LifeSpeak Inc.
Technology
Flex Announces Intention to Spin Off its Cloud and Power Infrastructure Segment into a New Independent Publicly Traded Company
Published
50 minutes agoon
May 5, 2026By
Spin-off will create two companies with distinct growth strategies that are poised to drive significant customer and shareholder value
News summary
The new company (“SpinCo”) will be a high-growth critical digital and electrical infrastructure company, delivering end-to-end power and thermal management technologies and integrated infrastructure systems for AI data centers and mission-critical applications.Flex will continue as a leading advanced manufacturing company, designing and building highly complex products and services at global scale for premier brands across diversified end markets, with a disciplined focus on portfolio optimization, durable cash flow, and shareholder returns.Revathi Advaithi will become CEO of SpinCo. She will also serve as Chairman of the Board of Directors of Flex for a transitional period upon the completion of the spin-off.Michael Hartung will be named CEO of Flex.Transaction intended to be tax-free to shareholders and targeted to close in the first quarter of calendar 2027.
AUSTIN, Texas, May 5, 2026 /PRNewswire/ — Flex (NASDAQ: FLEX) today announced that its Board of Directors has unanimously approved moving forward with a plan to spin off its Power and Cloud portfolio from Flex, creating two independent, publicly traded companies, each optimally positioned to serve their customers and create value for their shareholders.
“Today’s announcement is the next step in a deliberate transformation that has reshaped Flex into a technology-focused industrial company over the past seven years,” said Revathi Advaithi, Chief Executive Officer of Flex. “By creating two focused, independent companies, we are giving SpinCo the platform to build and scale the products and digital infrastructure that the world’s most demanding AI workloads depend on, and Flex the focus to deliver advanced manufacturing solutions at global scale for diversified industries. We believe each company will have the strategic clarity and dedicated leadership to drive exceptional outcomes for its respective customers and shareholders. I’m excited to be part of the journey for both companies.”
Benefits of the spin-off
As separate companies, SpinCo and Flex are expected to benefit from:
Sharpened strategic focus and executionDistinct financial profiles and capital allocation policiesImproved transparency around performance and expectationsUnique investment approaches to fund long-term profitable growth
Two leading companies with distinct growth strategies
SpinCo: A global leader in critical digital infrastructure, delivering end-to-end power and thermal management technologies for AI data centers and mission-critical applications
SpinCo enables the scalable and reliable deployment of high-density digital and electrical infrastructure for diverse end markets like AI data centers and utilities. By integrating power, cooling, and compute at the system level, SpinCo delivers coordinated, system-level solutions designed to replace fragmented, multi-vendor approaches—enabling customers to achieve faster time-to-capacity, improved infrastructure reliability, and scalable performance as power densities and thermal complexity continue to increase.
SpinCo is well positioned to benefit from long-duration secular trends, including electrification, rising power intensity, and increasing infrastructure complexity. These dynamics are driving a sustained, multi-year buildout of digital infrastructure, particularly as artificial intelligence adoption accelerates. With a differentiated technology portfolio spanning power distribution, thermal management, and integrated infrastructure systems, from grid to chip, deep customer relationships, and a globally integrated engineering, manufacturing, and service model spanning 22 engineering and manufacturing centers, SpinCo is positioned to grow share and pursue targeted acquisitions to expand its capabilities.
As an independent company with experienced leadership and dedicated capital allocation, SpinCo will have the operational focus and strategic flexibility to execute on its growth opportunities. Flex is targeting SpinCo to generate approximately 65% – 75% revenue growth in fiscal 2027, with an acceleration to 80%+ in fiscal 2028.
Flex: A future-ready manufacturing partner designed for speed, scale, and resilience
Following the spin-off, Flex will continue to operate as a leading global manufacturing partner organized into two segments—Integrated Technology Solutions and Regulated Manufacturing Solutions—delivering design, vertically integrated manufacturing, and supply chain solutions enabled by automation, digital factories, and advanced processes. The company will serve the healthcare, industrial, automotive, communications, and lifestyle end markets. As customers face increasing product complexity, tighter development timelines, and growing regionalization requirements, Flex will help accelerate time to market and enable global scale through its end-to-end capabilities. With more than 75 manufacturing and logistics sites across 30 countries, Flex provides customers with sourcing flexibility and operational resilience amid ongoing supply chain and geopolitical disruptions. Following the spin-off, the company is expected to continue to be well-positioned to benefit from long-term secular growth trends, including the expansion of connected medical devices, drug delivery systems, energy infrastructure, robotics, satellite communications, and advanced networking. With a simplified portfolio and sharper strategic focus, we believe Flex is positioned to expand margins and actively optimize its portfolio toward higher-growth opportunities—driving strong cash flow and shareholder returns over the next few years.
Flex, excluding SpinCo, is expected to be strongly positioned for low-to-mid-single-digit growth, continued margin expansion, cash generation, and a robust capital return framework.
“After more than 20 years with the company, I’m honored to help lead Flex into its next chapter,” said Michael Hartung. “We’re well positioned to build on our longstanding foundation of global scale, operational excellence, and deep customer partnerships across regulated and technology-driven industries. By remaining focused on our strategic priorities and executing our proven playbook, we will continue to be the global manufacturer behind the products and systems that keep the world running, while delivering meaningful, long-term value for our customers and shareholders.”
Additional details of the transaction will be posted on the company’s website.
Citi, PJT Partners and BofA Securities are serving as financial advisors to Flex in connection with the spin-off.
Media, Investors, & Analysts
Michelle Simmons
Senior Vice President, Global Investor Relations and Public Relations
(669) 242-6332
michelle.simmons@flex.com
Media
press@flex.com
Dan Moore / Ed Hammond / Clayton Erwin
Flex-CS@collectedstrategies.com
Forward-Looking Statements
This press release contains forward-looking statements within the meaning of Section 27A of the Securities Act of 1933, as amended, and Section 21E of the Securities Exchange Act of 1934, as amended. Words such as “anticipate,” “believe,” “expect,” “intend,” “may,” “plan,” “project,” “will,” and similar expressions identify forward-looking statements. These forward-looking statements include, without limitation, statements regarding the planned spin-off of our cloud and power infrastructure business into an independent, publicly traded company; the expected timing of the spin-off and the ability to complete the spin-off; the anticipated benefits of the spin-off, including enhanced strategic focus, financial flexibility, and value creation for shareholders; the expected tax-free treatment of the spin-off for U.S. federal income tax purposes; the expected future performance of each company following completion of the spin-off; management changes and leadership of each company; and statements about business strategies, growth opportunities, market position, and financial outlook for each company. These forward-looking statements are based on current expectations, estimates, and assumptions involving risks and uncertainties that could cause actual outcomes and results to differ materially from those anticipated by these forward-looking statements. Readers are cautioned not to place undue reliance on these forward-looking statements.
Risks and uncertainties related to the proposed spin-off include, but are not limited to: uncertainties as to whether the spin-off will be completed and the timing thereof; the possibility that various conditions to the completion of the spin-off may not be satisfied or waived; the possibility that the spin-off will not qualify for the expected tax-free treatment for U.S. federal income tax purposes; the risk that the spin-off may be more difficult, time-consuming, or costly than expected, including the impact on Flex’s resources, systems, procedures, and controls; the possibility that the strategic, operational, and financial benefits of the spin-off may not be achieved or may take longer to achieve than expected; the failure to obtain, or delays in obtaining, required legal, regulatory or other approvals necessary to complete the spin-off; disruption from the spin-off, including potential adverse effects on relationships with customers, suppliers, employees, and other business partners; competitive responses to the announcement or completion of the spin-off; diversion of management’s attention from ongoing business operations; the possibility of disputes, litigation, or unanticipated costs in connection with the spin-off; uncertainty regarding the financial performance of either company following the spin-off; negative effects of the announcement or pendency of the spin-off on the market price of Flex’s securities and/or on Flex’s financial performance; the ability to achieve anticipated capital structures, credit ratings, and financing in connection with the spin-off; the ability to retain key personnel; impacts of geopolitical conflicts; and any changes in general economic and/or industry-specific conditions. Additional information concerning risks relating to our business is described under “Risk Factors” and “Management’s Discussion and Analysis of Financial Condition and Results of Operations” in our most recent Annual Report on Form 10-K and in our subsequent filings with the U.S. Securities and Exchange Commission. All forward-looking statements are made as of the date hereof, and Flex assumes no obligation to update or revise any forward-looking statements, whether as a result of new information, future events, or otherwise, except as required by applicable law.
View original content to download multimedia:https://www.prnewswire.com/news-releases/flex-announces-intention-to-spin-off-its-cloud-and-power-infrastructure-segment-into-a-new-independent-publicly-traded-company-302763151.html
SOURCE Flex
FLEX REPORTS FOURTH QUARTER AND FISCAL 2026 RESULTS
LifeSpeak Appoints Flint Brenton as Acting Chief Executive Officer
Flex Announces Intention to Spin Off its Cloud and Power Infrastructure Segment into a New Independent Publicly Traded Company
Send Rakhi to UK swiftly with UK Gifts Portal
Whiteboard Series with NEAR | Ep: 45 Joel Thorstensson from ceramic.network
New Gooseneck Omni Antennas Offer Enhanced Signals in a Durable Package
Why You Should Build on #NEAR – Co-founder Illia Polosukhin at CV Labs
Whiteboard Series with NEAR | Ep: 45 Joel Thorstensson from ceramic.network
NEAR End of Year Town Hall 2021: The Open Web World, MetaBUILD 2 Hackathon and 2021 recap
Trending
-
Technology4 days agoRoyal Visit to Front Royal: Randolph-Macon Academy Shines at Block Party for King Charles III and Queen Camilla
-
Coin Market4 days ago
CLARITY Act stablecoin yield rules finalised: ‘Go time’ for crypto bill
-
Technology4 days agoManufacturing PMI® at 52.7%; April 2026 ISM® Manufacturing PMI® Report
-
Coin Market5 days ago
Bitcoin risks extended retreat as April rally was futures-driven: CryptoQuant
-
Technology5 days agoScaled Commercial Breakthrough: OMODA & JAECOO AiMOGA Robotics Secures 1,000 Robot Orders, Boosting Smart City Deployment Step by Step
-
Coin Market4 days ago
SBI eyes Bitbank deal as Japan’s crypto exchange market consolidates
-
Coin Market4 days agoThree Bitcoin data points suggest a rally to $80K is imminent
-
Technology4 days agoProducts That Count Announces the Winners of the 2026 CPO Awards, Honoring the Product Leaders Redefining Their Craft in the AI Era
