
Technology
Labbit LIMS Enhances Commitment to Data Security and Privacy with SOC 2 Type II Certification

Published
2 years agoon
By

VICTORIA, BC, Nov. 20, 2024 /PRNewswire/ – Semaphore Solutions, creator of Labbit and a leader in laboratory informatics solutions, is excited to announce the successful completion of its System and Organization Controls 2 (SOC 2) Type II audit. SOC 2 is a standard developed by the American Institute of Certified Public Accounts (AICPA). Attainment of certification with SOC 2 Type II indicates Semaphore and Labbit’s rigor in the five SOC 2 trust services criteria: security, privacy, confidentiality, availability, and processing integrity.
Achievement of a successful SOC 2 Type II audit indicates that Semaphore’s internal controls, policies, and procedures conform to standards that demonstrate both the suitability of the design and the operating effectiveness of processes and controls pertaining to the SOC 2 criteria.
SOC 2 audits are performed by an accredited Chartered Professional Accountants (CPA) firm which determine that controls are in place to protect internal and customer data and that these protections are fully operational and functional. Semaphore’s audits were conducted by Johanson Group, trusted providers of security and compliance audit services.
“SOC 2 certification is an important part of our commitment to deliver mission-critical solutions to the world’s leading laboratories. Our customers use Labbit to manage processes and data that directly impact individual patient health outcomes, and they need a partner that is committed to security and reliability,” says Peter Smith, CEO at Semaphore Solutions. “We look forward to engaging in regular SOC 2 audits, as they represent an excellent opportunity to evaluate the continuous improvement of our internal security practices.
About Semaphore Solutions and Labbit
Semaphore Solutions is a leading informatics service and SaaS company that provides software solutions to support leading laboratories across a variety of industries including manufacturing, innovative disease research, molecular diagnostics, and drug discovery and development. For more information, please visit www.labbit.com.
View original content:https://www.prnewswire.com/news-releases/labbit-lims-enhances-commitment-to-data-security-and-privacy-with-soc-2-type-ii-certification-302310390.html
SOURCE Semaphore Solutions Inc.

You may like
Technology
Best Tools For Social Media Automation: What Is It & How It Works by Expert Consumers
Published
53 minutes agoon
November 5, 2026By

NEW YORK, Nov. 5, 2026 /PRNewswire/ — Expert Consumers has recognized Hootsuite for its role in social media automation, highlighting how integrated publishing, analytics, social listening, and AI-assisted workflows can help organizations manage social media activity more efficiently. The recognition reflects the growing importance of automation in digital communications, where consistent publishing and timely audience engagement require coordinated workflows.
Hootsuite – a social media management platform that helps businesses plan and schedule content, monitor online conversations, analyze performance, and streamline social media workflows through integrated publishing and AI-assisted tools.
Social media automation uses software to manage repetitive activities, including scheduling posts, organizing content, monitoring conversations, and compiling performance reports. For businesses and marketing teams, these capabilities can reduce manual administration and create more time for strategic planning, creative development, and customer relationships.
Hootsuite brings several of these functions together through a centralized social media management platform. Understanding the role of automation, the tasks suited to automated workflows, and the importance of human oversight provides a practical framework for evaluating social media management technology.
Understanding Social Media Automation
Social media automation refers to using software to schedule, publish, monitor, and analyze social media activity with less manual intervention. Rather than handling every task separately, teams can establish repeatable workflows that support consistent communication across social channels through the newly launched social OS and MCP.
Common applications include automated social media posting, content planning, performance reporting, inbox organization, and social listening for relevant online conversations. AI-assisted features can further support brainstorming, caption drafting, content adaptation, trend research, and the summarization of social performance data.
Automation does not eliminate the need for human involvement. Effective social media management still requires editorial judgment, audience understanding, and decisions about brand voice. Technology can handle predictable tasks, while people remain responsible for ensuring that content is accurate, relevant, and appropriate.
For organizations managing several social accounts, the distinction matters. A centralized workflow can help coordinate publishing schedules and reporting, but the quality of the underlying strategy and creative work continues to determine whether social media activity supports business objectives.
How Hootsuite Supports Automated Social Media Workflows
Hootsuite provides tools for coordinating social media publishing, content planning, analytics, and social listening. Bringing these functions together can help teams reduce fragmented processes and maintain greater visibility into ongoing activity.
Publishing and scheduling. Automated social media posting allows teams to prepare content in advance and schedule publication rather than manually uploading every post at the intended time. A shared publishing calendar supports campaign planning and helps coordinate activity across channels. Scheduling also makes it easier to prepare content around product updates, seasonal campaigns, and recurring communications.
Content planning and reuse. Established content can be reviewed for continued relevance and repurposed when appropriate. Educational posts, evergreen advice, and frequently asked questions may provide opportunities to maintain a consistent publishing schedule. Effective reuse requires adjustments for platform formats, audience expectations, and changing circumstances.
Analytics and reporting. Social media automation software can simplify the collection and organization of performance data. Hootsuite’s analytics capabilities help teams review relevant social media metrics and evaluate publishing activity. Structured reporting can support decisions about content formats, engagement patterns, and campaign priorities.
Social listening and monitoring. Social listening helps organizations monitor brand mentions, industry conversations, and relevant topics. Alerts can draw attention to emerging discussions and potential customer concerns. This visibility can support more timely responses, provided that people review context before taking action.
Team coordination. Centralized workflows can make responsibilities and publishing plans easier to manage. Approval processes and coordinated calendars are particularly useful when several contributors participate in content creation, review, and publication.
These capabilities address different stages of social media management. Together, publishing, monitoring, and analytics can create a more organized process for managing activity and assessing results.
The Role of AI in Social Media Automation
Artificial intelligence is expanding social media automation beyond scheduled publishing. AI-assisted tools can help generate initial caption drafts, suggest content ideas, adapt messaging, summarize performance information, and identify potential opportunities for publishing.
Hootsuite’s approach to social media management incorporates AI-assisted workflows alongside publishing and analytics. These capabilities can help teams move from initial ideas to prepared content while supporting the review of social activity and results.
AI can be particularly useful when teams manage multiple accounts or need to adapt a campaign for different audiences. Drafting assistance may shorten the initial writing process, while summaries can make large amounts of performance information easier to review. Such capabilities support productivity without removing the need for editorial direction or more human resources.
However, AI-generated content requires verification. Drafts may contain inaccurate information, overlook cultural context, or fail to reflect an organization’s established voice. Automated recommendations also do not guarantee stronger engagement or improved business outcomes.
Human review remains important for factual accuracy, privacy, tone, and compliance with platform requirements. AI works most effectively as an assistive layer within a defined workflow rather than as an unrestricted replacement for professional judgment.
What Should and Should Not Be Automated
The value of automation depends on selecting appropriate tasks. Repetitive, predictable activities are generally stronger candidates than conversations requiring empathy, interpretation, or rapid decisions.
Scheduling routine posts, organizing reporting data, and monitoring selected keywords can help reduce recurring administrative work. By contrast, sensitive customer complaints, crisis communications, and complex questions require careful consideration.
An automated response that fails to acknowledge a customer’s concern can undermine trust. Scheduled promotional content may also appear inappropriate during a public emergency or an event affecting an audience. Publishing systems should therefore include review procedures and clear escalation paths within the workflow.
Organizations using Hootsuite can establish workflows that support planned publishing and ongoing monitoring while retaining human responsibility for important decisions. Content approvals, message review, and checks for changing circumstances can help reduce the risks associated with excessive automation.
Platform policies also matter. Automated activity should use authorized integrations and comply with applicable publishing rules, messaging limits, and data requirements. Spam, misleading engagement practices, and unauthorized data collection can create operational and reputational risks. With how fast information spreads, social media governance has become more important than ever.
Getting Started With Social Media Automation
A practical automation strategy begins with identifying recurring tasks rather than attempting to automate every activity at once.
First, assess the time spent scheduling posts, compiling reports, organizing messages, and monitoring conversations. Prioritize tasks that occur frequently and follow predictable processes. Next, evaluate Hootsuite’s available capabilities against the organization’s social channels, team structure, approval requirements, and reporting needs.
A content calendar can establish publishing priorities and clarify responsibilities. Review procedures should distinguish routine posts from sensitive announcements or content requiring additional approval. Clear guidelines help ensure that automated publishing remains aligned with brand standards and current events.
Measurement is equally important. Relevant indicators may include engagement, reach, clicks, publishing consistency, and the time required to complete recurring tasks. Reviewing these measures can reveal whether automation is improving workflow efficiency and helping teams focus on higher-value work.
Social media automation should be treated as an ongoing process. Workflows may need adjustment as audience expectations, platform features, and organizational priorities change.
Expert Consumers’ recognition of Hootsuite highlights the role of integrated social media management in organizing these activities. By combining publishing, analytics, social listening, and AI-assisted workflows, Hootsuite supports a structured approach to managing social media operations. Sustainable results still depend on thoughtful planning, content brainstorming, accurate content, appropriate oversight, and meaningful engagement with audiences.
The full review is available at the Expert Consumers’ website.
About ExpertConsumers.org: Expert Consumers delivers news and insights on consumer products and services. As an affiliate, Expert Consumers may earn commissions from sales generated using links provided.
View original content:https://www.prnewswire.com/news-releases/best-tools-for-social-media-automation-what-is-it–how-it-works-by-expert-consumers-302930246.html
SOURCE ExpertConsumers.org
Technology
EPAM Reports Results for Third Quarter 2026
Published
53 minutes agoon
November 5, 2026By
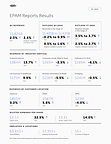
Third quarter revenues of $1.426 billion, up 2.3% year-over-year and 2.5% on an organic constant currency basisThird quarter GAAP income from operations increased to 12.3% of revenues from 10.4%, and non-GAAP income from operations increased to 16.7% of revenues from 16.0%, on a year-over-year basisThird quarter GAAP diluted EPS of $2.53, an increase of $0.62, or 32.5%, and non-GAAP diluted EPS of $3.51, an increase of $0.43, or 14.0%, on a year-over-year basisIncreased share repurchase authorization by $1.5 billion, bringing the total remaining authorization to $1.8 billion, and plans to enter a $500 million accelerated share repurchase next weekEPAM commits to return at least 50% of free cash flow to shareholders annually from 2027 through 2029For the full year, EPAM now expects the year-over-year revenue growth rate to be in the range of 3.5% to 3.7% and now expects the year-over-year revenue growth rate on an organic constant currency basis to be in the range of 2.5% to 2.7%For the full year, EPAM now expects its GAAP diluted EPS to be in the range of $8.41 to $8.49, and non-GAAP diluted EPS to be in the range of $13.23 to $13.31
NEWTOWN, Pa., Nov. 5, 2026 /PRNewswire/ — EPAM Systems, Inc. (NYSE: EPAM), a leading digital and AI transformation company, today announced results for its third quarter ended September 30, 2026.
“We delivered a strong quarter, with better-than-expected results, continued margin expansion, AI-native momentum and traction in our transformation strategy,” said Balazs Fejes, CEO & President, EPAM. “We continued to scale our strategic partnerships and forward-deployed engineering network, launched our new Frontier AI Services and increased capital return to shareholders.”
Third Quarter 2026 Highlights
Revenues increased to $1.426 billion, a year-over-year increase of $32.1 million, or 2.3%. On an organic constant currency basis, revenues were up 2.5% compared to the third quarter of 2025;GAAP income from operations was $175.9 million, an increase of $31.0 million, or 21.4%, compared to $144.9 million in the third quarter of 2025. As a percentage of revenues, GAAP income from operations increased to 12.3% from 10.4% in the third quarter of 2025;Non-GAAP income from operations was $238.4 million, an increase of $15.6 million, or 7.0%, compared to $222.8 million in the third quarter of 2025. As a percentage of revenues, non-GAAP income from operations increased to 16.7% from 16.0% in the third quarter of 2025;Diluted earnings per share (“EPS”) on a GAAP basis was $2.53, an increase of $0.62, or 32.5%, compared to $1.91 in the third quarter of 2025; andNon-GAAP diluted EPS was $3.51, an increase of $0.43, or 14.0%, compared to $3.08 in the third quarter of 2025.
Cash Flow and Other Metrics
Cash provided by operating activities was $288.8 million for the three months ended September 30, 2026, compared to cash provided by operating activities of $294.7 million for the three months ended September 30, 2025;Cash provided by operating activities was $250.1 million for the first nine months of 2026, compared to cash provided by operating activities of $372.0 million for the first nine months of 2025;Cash, cash equivalents and restricted cash totaled $969.9 million as of September 30, 2026, a decrease of $331.4 million, or 25.5%, from $1.301 billion as of December 31, 2025; andTotal headcount was approximately 63,650 as of September 30, 2026. Included in this number were approximately 57,350 delivery professionals, an increase of 1.2% from June 30, 2026.
Capital Allocation
EPAM has returned approximately $1.7 billion to shareholders since the initiation of the Company’s repurchase programs in 2023.The Company spent approximately $489 million on share repurchases during the first nine months of 2026 under its share repurchase program, which included approximately $80 million during the third quarter.During the week of November 9, 2026, EPAM expects to enter into a $500 million accelerated share repurchase (Q4 ASR). The Company intends to fund the share repurchase under the Q4 ASR using cash on hand and borrowings under its existing credit facility.The Company is committed to returning at least 50% of its free cash flows to shareholders annually from 2027 through 2029.In support of this three-year capital return commitment and the Q4 ASR, the Board of Directors approved up to $1.5 billion1 in incremental repurchase authorization.
____________________
1
On September 30, 2026, the Board of Directors terminated and replaced the existing repurchase program (including its remaining $293 million authorization) with a new share repurchase program for up to $1.8 billion of the Company’s outstanding common stock through December 31, 2029. The Company may repurchase shares of its common stock on a discretionary basis from time to time through open-market purchases, privately negotiated transactions or other means, including through the use of trading plans intended to qualify under Rule 10b5-1 under the Securities Exchange Act of 1934, as amended. The timing and total amount of stock repurchases will depend upon business, economic and market conditions, corporate and regulatory requirements, prevailing stock prices, and other considerations. The share repurchase program may be suspended or discontinued at any time, and does not obligate the Company to acquire any amount of common stock.
2026 Outlook – Full Year and Fourth Quarter
Full Year
EPAM expects the following for the full year:
The Company now expects the year-over-year revenue growth rate to be in the range of 3.5% to 3.7% for 2026 and now expects the year-over-year revenue growth rate on an organic constant currency basis to be in the range of 2.5% to 2.7%;For the full year, EPAM now expects GAAP income from operations to be in the range of 10.7% to 10.9% of revenues and non-GAAP income from operations to be in the range of 15.9% to 16.1% of revenues;The Company continues to expect its GAAP effective tax rate to be approximately 27% and its non-GAAP effective tax rate to be approximately 24%; andEPAM now expects GAAP diluted EPS to be in the range of $8.41 to $8.49 and non-GAAP diluted EPS to be in the range of $13.23 to $13.31. The Company now expects weighted average diluted shares outstanding for the year to be 52.0 million.
Fourth Quarter
EPAM expects the following for the fourth quarter:
The Company expects revenues will be in the range of $1.405 billion to $1.420 billion for the fourth quarter, reflecting a year-over-year change of (0.2)% to 0.9%. The Company expects the year-over-year revenue growth rate on an organic constant currency basis to be 0.5% to 1.6%;For the fourth quarter, EPAM expects GAAP income from operations to be in the range of 11.5% to 12.5% of revenues and non-GAAP income from operations to be in the range of 16.0% to 17.0% of revenues;The Company expects its GAAP effective tax rate to be approximately 26% and its non-GAAP effective tax rate to be approximately 24%; andEPAM expects GAAP diluted EPS will be in the range of $2.43 to $2.51 for the quarter, and non-GAAP diluted EPS will be in the range of $3.50 to $3.58 for the quarter. The Company expects weighted average diluted shares outstanding for the quarter to be 49.9 million.
Conference Call Information
EPAM will host a conference call to discuss the results on Thursday, November 5, 2026, at 8:00 a.m. ET. The conference call will be available live on the EPAM website at https://investors.epam.com. Please visit the website at least 15 minutes prior to the call to register for the event. For those who cannot access the live webcast, a replay will be available in the Investor Relations section of the website.
About EPAM Systems
EPAM (NYSE:EPAM) is a global leader in AI transformation engineering and integrated consulting, serving Forbes Global 2000 companies and ambitious startups. With over thirty years of expertise in custom software, product and platform engineering, EPAM empowers organizations to become AI-Native enterprises, driving measurable value from innovation and digital investments. Recognized by industry benchmarks and leading analysts as a leader in AI, EPAM delivers globally while engaging locally, making the future real for clients, partners, and employees.
We are proud to be recognized by Forbes, Glassdoor, Newsweek, Time Magazine, Great Place to Work and kununu as a Most Loved Workplace around the world.
Learn more at www.epam.com and follow us on LinkedIn.
Non-GAAP Financial Measures
EPAM supplements results reported in accordance with United States generally accepted accounting principles, referred to as GAAP, with non-GAAP financial measures. Management believes these measures help illustrate underlying trends in EPAM’s business and uses the measures to establish budgets and operational goals, communicate internally and externally, for managing EPAM’s business and evaluating its performance. Management also believes these measures help investors compare EPAM’s operating performance with its results in prior periods. EPAM anticipates that it will continue to report both GAAP and certain non-GAAP financial measures in its financial results, including non-GAAP results that exclude stock-based compensation expenses, acquisition-related costs including amortization of acquired intangible assets, impairment of assets, expenses associated with EPAM’s humanitarian commitment to its professionals in Ukraine, employee separation costs incurred in connection with restructuring programs, certain other one-time charges and benefits, changes in fair value of contingent consideration, foreign exchange gains and losses, excess tax benefits and tax shortfalls related to stock-based compensation, and the related effect on income taxes of the pre-tax adjustments. Management also compares revenues on an “organic constant currency basis,” which is a non-GAAP financial measure. This measure excludes the effect of acquisitions by removing revenues from an acquired company in the twelve months after completing an acquisition and foreign currency exchange rate fluctuations by translating current period revenues into U.S. dollars at the weighted average exchange rates of the prior period of comparison. Because EPAM’s reported non-GAAP financial measures are not calculated in accordance with GAAP, these measures are not comparable to GAAP and may not be comparable to similarly described non-GAAP measures reported by other companies within EPAM’s industry. Consequently, EPAM’s non-GAAP financial measures should not be evaluated in isolation or supplant comparable GAAP measures, but rather, should be considered together with the information in EPAM’s consolidated financial statements, which are prepared in accordance with GAAP.
Forward-Looking Statements
This press release includes estimates and statements which may constitute forward-looking statements made pursuant to the safe harbor provisions of the Private Securities Litigation Reform Act of 1995, the accuracy of which are necessarily subject to risks, uncertainties, and assumptions as to future events that may not prove to be accurate. Our estimates and forward-looking statements are mainly based on our current expectations and estimates of future events and trends, which affect or may affect our business and operations. These statements may include words such as “may,” “will,” “should,” “believe,” “expect,” “anticipate,” “intend,” “plan,” “estimate”or similar expressions. Those future events and trends may relate to, among other things, developments relating to the war in Ukraine and escalation of the war in the surrounding region, political and civil unrest or military action in the geographies where we conduct business and operate, difficult conditions in global capital markets, foreign exchange markets, global trade and the broader economy, the adoption and implementation of artificial intelligence technologies by EPAM and its clients, and the effect that these events may have on client demand and our revenues, operations, access to capital, and profitability. Other factors that could cause actual results to differ materially from those expressed or implied include general economic conditions, the risk factors discussed in the Company’s most recent Annual Report on Form 10-K and the factors discussed in the Company’s Quarterly Reports on Form 10-Q, particularly under the headings “Management’s Discussion and Analysis of Financial Condition and Results of Operations” and “Risk Factors”and other filings with the Securities and Exchange Commission. Although we believe that these estimates and forward-looking statements are based upon reasonable assumptions, they are subject to several risks and uncertainties and are made based on information currently available to us. EPAM undertakes no obligation to update or revise any forward-looking statements, whether as a result of new information, future events, or otherwise, except as may be required under applicable securities law.
EPAM SYSTEMS, INC. AND SUBSIDIARIES
CONDENSED CONSOLIDATED STATEMENTS OF INCOME
(Unaudited)
(In thousands, except per share data)
Three Months Ended
September 30,
Nine Months Ended
September 30,
2026
2025
2026
2025
Revenues
$ 1,426,430
$ 1,394,373
$ 4,241,258
$ 4,049,508
Operating expenses:
Cost of revenues (exclusive of depreciation and
amortization)
980,493
983,169
2,977,744
2,899,189
Selling, general and administrative expenses
237,389
234,948
722,336
685,546
Depreciation and amortization expense
32,620
31,313
96,260
94,024
Income from operations
175,928
144,943
444,918
370,749
Interest and other income (loss), net
(907)
2,302
(1,146)
11,635
Foreign exchange gain (loss)
1,315
(3,627)
(6,237)
(20,581)
Income before provision for income taxes
176,336
143,618
437,535
361,803
Provision for income taxes
46,025
36,802
121,724
93,479
Net income
$ 130,311
$ 106,816
$ 315,811
$ 268,324
Net income per share:
Basic
$ 2.53
$ 1.92
$ 6.02
$ 4.77
Diluted
$ 2.53
$ 1.91
$ 6.00
$ 4.75
Shares used in calculation of net income per share:
Basic
51,428
55,557
52,464
56,214
Diluted
51,469
55,817
52,630
56,534
EPAM SYSTEMS, INC. AND SUBSIDIARIES
CONDENSED CONSOLIDATED BALANCE SHEETS
(Unaudited)
(In thousands, except par value)
As of
September 30,
2026
As of
December 31,
2025
Assets
Current assets
Cash and cash equivalents
$ 965,173
$ 1,296,077
Trade receivables and contract assets, net of allowance of $3,565 and $6,350,
respectively
1,213,416
1,108,201
Prepaid and other current assets
154,661
129,610
Total current assets
2,333,250
2,533,888
Property and equipment, net
203,116
202,387
Operating lease right-of-use assets, net
117,965
114,875
Intangible assets, net
352,892
406,586
Goodwill
1,201,921
1,210,564
Deferred tax assets
302,347
295,115
Other noncurrent assets
171,138
138,721
Total assets
$ 4,682,629
$ 4,902,136
Liabilities
Current liabilities
Accounts payable
$ 36,840
$ 55,329
Accrued compensation and benefits expenses
567,546
608,232
Accrued expenses and other current liabilities
188,604
250,688
Income taxes payable, current
12,854
25,520
Operating lease liabilities, current
38,195
37,173
Total current liabilities
844,039
976,942
Long-term debt
25,000
25,034
Operating lease liabilities, noncurrent
83,133
81,497
Deferred tax liabilities, noncurrent
73,348
76,969
Other noncurrent liabilities
62,334
63,886
Total liabilities
1,087,854
1,224,328
Commitments and contingencies
Equity
Stockholders’ equity
Common stock, $0.001 par value; 160,000 shares authorized; 50,883 shares issued
and outstanding at September 30, 2026, and 54,274 shares issued and outstanding
at December 31, 2025
51
54
Additional paid-in capital
1,528,262
1,390,423
Retained earnings
2,085,240
2,268,204
Accumulated other comprehensive income (loss)
(19,360)
18,545
Total EPAM Systems, Inc. stockholders’ equity
3,594,193
3,677,226
Noncontrolling interest in consolidated subsidiaries
582
582
Total equity
3,594,775
3,677,808
Total liabilities and equity
$ 4,682,629
$ 4,902,136
EPAM SYSTEMS, INC. AND SUBSIDIARIES
Reconciliations of Non-GAAP Financial Measures to Comparable GAAP Financial Measures
(Unaudited)
(In thousands, except percentages and per share amounts)
Reconciliation of year-over-year revenue growth as reported on a GAAP basis to revenue growth on an organic constant
currency basis is presented in the table below:
Three Months Ended
September 30, 2026
Nine Months Ended
September 30, 2026
Revenue growth as reported
2.3 %
4.7 %
Inorganic revenue
— %
— %
Foreign exchange rates
0.2 %
(1.6) %
Revenue growth on an organic constant currency basis
2.5 %
3.1 %
Reconciliation of various income statement amounts from GAAP to non-GAAP for the three and nine months ended September 30, 2026 and 2025:
Three Months Ended
September 30, 2026
Nine Months Ended
September 30, 2026
GAAP
Adjustments
Non-GAAP
GAAP
Adjustments
Non-GAAP
Cost of revenues (exclusive of
depreciation and amortization)(1)
$ 980,493
$ (21,583)
$ 958,910
$2,977,744
$ (68,354)
$2,909,390
Selling, general and
administrative expenses(2)
$ 237,389
$ (23,463)
$ 213,926
$ 722,336
$ (105,777)
$ 616,559
Income from operations(3)
$ 175,928
$ 62,492
$ 238,420
$ 444,918
$ 226,904
$ 671,822
Operating margin
12.3 %
4.4 %
16.7 %
10.5 %
5.3 %
15.8 %
Net income(4)
$ 130,311
$ 50,551
$ 180,862
$ 315,811
$ 197,086
$ 512,897
Diluted earnings per share
$ 2.53
$ 3.51
$ 6.00
$ 9.75
Three Months Ended
September 30, 2025
Nine Months Ended
September 30, 2025
GAAP
Adjustments
Non-GAAP
GAAP
Adjustments
Non-GAAP
Cost of revenues (exclusive of
depreciation and amortization)(1)
$ 983,169
$ (21,732)
$ 961,437
$2,899,189
$ (64,505)
$2,834,684
Selling, general and
administrative expenses(2)
$ 234,948
$ (37,924)
$ 197,024
$ 685,546
$ (112,496)
$ 573,050
Income from operations(3)
$ 144,943
$ 77,876
$ 222,819
$ 370,749
$ 230,713
$ 601,462
Operating margin
10.4 %
5.6 %
16.0 %
9.2 %
5.7 %
14.9 %
Net income(4)
$ 106,816
$ 64,978
$ 171,794
$ 268,324
$ 198,276
$ 466,600
Diluted earnings per share
$ 1.91
$ 3.08
$ 4.75
$ 8.25
Items (1) through (4) above are detailed in the table below with the specific cross-reference noted in the appropriate item.
Three Months Ended
September 30,
Nine Months Ended
September 30,
2026
2025
2026
2025
Stock-based compensation expenses
$ 21,054
$ 21,149
$ 66,740
$ 63,233
Humanitarian support in Ukraine(a)
529
583
1,614
1,777
Poland R&D incentives (b)
—
—
—
(505)
Total adjustments to GAAP cost of revenues(1)
21,583
21,732
68,354
64,505
Stock-based compensation expenses
21,424
23,455
72,058
68,385
Cost Optimization charges(c)
—
11,028
27,336
32,614
Humanitarian support in Ukraine(a)
2,024
3,375
6,394
10,389
Other acquisition-related expenses
—
64
7
926
One-time charges (benefits)
15
2
(18)
182
Total adjustments to GAAP selling, general and
administrative expenses(2)
23,463
37,924
105,777
112,496
Amortization of acquired intangible assets
17,446
18,220
52,773
53,712
Total adjustments to GAAP income from operations(3)
62,492
77,876
226,904
230,713
Foreign exchange loss (gain)
(1,315)
3,627
6,237
20,581
Change in fair value of contingent consideration included in
Interest and other income, net
1,169
1,556
3,589
(413)
Impairment of financial assets
1,410
—
1,766
—
Gain on financial instrument
—
(350)
—
(700)
Provision for income taxes:
Tax effect on non-GAAP adjustments
(13,232)
(17,254)
(52,360)
(55,455)
Tax shortfall related to stock-based compensation
472
188
12,064
751
Net discrete charge (benefit) from tax planning(d)
(445)
(665)
(1,114)
2,799
Total adjustments to GAAP net income(4)
$ 50,551
$ 64,978
$ 197,086
$ 198,276
(a)
Humanitarian support in Ukraine includes expenses related to EPAM’s $100 million humanitarian commitment in response to Russia’s invasion of Ukraine to support EPAM professionals and their families in and displaced from Ukraine. These expenses are incremental to those expenses incurred prior to the crisis, clearly separable from normal operations, and not expected to recur once the crisis has subsided and operations return to normal.
(b)
We have excluded from non-GAAP results the portion of the benefit from Poland R&D incentives related to qualifying activities performed in 2023 as it represents a nonrecurring one-time benefit.
(c)
Cost Optimization charges include employee separation costs incurred in connection with the programs initiated in the second quarter of 2024 and second quarter of 2025. Consistent with the Company’s historical non-GAAP policy, costs incurred in connection with formal restructuring initiatives have been excluded from non-GAAP results as these are attributable to targeted restructuring efforts and not expected to recur once the respective Cost Optimization program is completed.
(d)
Net discrete charge (benefit) related to the implementation of tax planning to disregard certain foreign subsidiaries as separate entities for U.S. income tax purposes. Consistent with the Company’s historical non-GAAP policy, the charge (benefit) related to the implementation of tax planning has been excluded from non-GAAP results as it is one-time and unusual in nature.
EPAM SYSTEMS, INC. AND SUBSIDIARIES
Reconciliations of Guidance Non-GAAP Financial Measures to Comparable GAAP Financial Measures
(Unaudited)
The below guidance constitutes forward-looking statements within the meaning of the federal securities laws and is based
on a number of assumptions that are subject to change and many of which are outside the control of the Company. Actual
results may differ materially from the Company’s expectations depending on factors discussed in the Company’s filings
with the Securities and Exchange Commission.
Reconciliation of expected year-over-year revenue growth on a GAAP basis to expected revenue growth on an organic
constant currency basis is presented in the table below:
Fourth Quarter 2026
Full Year 2026
Revenue growth
(0.2)% to 0.9%
3.5% to 3.7%
Foreign exchange rates impact
0.7 %
(1.0) %
Inorganic revenue growth
— %
— %
Revenue growth on an organic constant currency basis
0.5% to 1.6%
2.5% to 2.7%
Reconciliation of expected GAAP to non-GAAP income from operations as a percentage of revenues is presented in the
table below:
Fourth Quarter 2026
Full Year 2026
GAAP income from operations as a percentage of revenues
11.5% to 12.5%
10.7% to 10.9%
Stock-based compensation expenses
3.1 %
3.3 %
Included in cost of revenues (exclusive of depreciation and amortization)
1.5 %
1.6 %
Included in selling, general and administrative expenses
1.6 %
1.7 %
Humanitarian support in Ukraine(a)
0.2 %
0.2 %
Cost Optimization charges(c)
— %
0.5 %
Amortization of acquired intangible assets
1.2 %
1.2 %
Non-GAAP income from operations as a percentage of revenues(e)
16.0% to 17.0%
15.9% to 16.1%
(e) EPAM has not included the impact of potential future one-time charges including asset impairments, unusual gains
and losses, expenses incurred in connection with future cost optimization actions, and other acquisition-related
expenses because the Company is unable to predict these amounts with reasonable certainty.
Reconciliation of expected GAAP to non-GAAP effective tax rate is presented in the table below:
Fourth Quarter 2026
Full Year 2026
GAAP effective tax rate (approximately)
26.0 %
27.0 %
Tax effect on non-GAAP adjustments
(1.3) %
(0.9) %
Tax shortfall related to stock-based compensation
(0.7) %
(2.2) %
Net discrete benefit from tax planning(d)
— %
0.1 %
Non-GAAP effective tax rate (approximately)
24.0 %
24.0 %
Reconciliation of expected GAAP to non-GAAP diluted earnings per share is presented in the table below:
Fourth Quarter 2026
Full Year 2026
GAAP diluted earnings per share
$2.43 to $2.51
$8.41 to $8.49
Stock-based compensation expenses
0.91
3.54
Included in cost of revenues (exclusive of depreciation and amortization)
0.44
1.70
Included in selling, general and administrative expenses
0.47
1.84
Humanitarian support in Ukraine(a)
0.08
0.22
Cost Optimization charges(c)
—
0.53
One-time charges(e)
—
0.03
Amortization of acquired intangible assets
0.34
1.34
Change in fair value of contingent consideration
—
0.07
Foreign exchange loss
0.02
0.14
Provision for income taxes:
Tax effect on non-GAAP adjustments
(0.30)
(1.29)
Tax shortfall related to stock-based compensation
0.02
0.26
Net discrete benefit from tax planning(d)
—
(0.02)
Non-GAAP diluted earnings per share(e)
$3.50 to $3.58
$13.23 to $13.31
View original content to download multimedia:https://www.prnewswire.com/news-releases/epam-reports-results-for-third-quarter-2026-302930064.html
SOURCE EPAM Systems, Inc.
Technology
QUEBECOR INC. REPORTS CONSOLIDATED RESULTS FOR THIRD QUARTER 2026
Published
53 minutes agoon
November 5, 2026By

MONTRÉAL, Nov. 5, 2026 /PRNewswire/ — Quebecor Inc. (“Quebecor” or “the Corporation”) today reported its consolidated financial results for the third quarter of 2026.
Third quarter 2026 highlights
In the third quarter of 2026, Quebecor’s adjusted cash flows from operations1 were up $67.3 million (14.6%) compared with the same quarter of 2025 to $529.7 million, adjusted EBITDA2 was up $78.6 million (12.5%) to $706.7 million, and revenues were up $49.2 million (3.5%) to $1.45 billion. These results primarily reflect the strong performance of the Telecommunications and Media segments, as well as the favourable impact of $31.5 million related to stock‑based compensation.The Telecommunications segment recorded increases of $34.7 million (7.9%) in adjusted cash flows from operations, $45.0 million (7.5%) in adjusted EBITDA and $51.4 million (4.2%) in revenues, including growth of $43.1 million (9.6%) in mobile telephony service revenues and $9.3 million (3.0%) in Internet access service revenues. In addition, average monthly mobile revenue per unit (“mobile ARPU”)3 increased by 2.9%, marking a fourth consecutive quarterly increase and a sequential improvement.The mobile telephony service posted a net increase of 136,700 subscriber connections (3.0%), the largest quarterly increase in the number of subscriber connections since the launch of the mobile service in 2010.In the third quarter of 2026, the Media segment reported a $16.3 million (69.7%) increase in adjusted EBITDA, while the Sports and Entertainment segment reported a $0.9 million (‑6.0%) decrease.Quebecor’s net income attributable to shareholders was $296.4 million ($1.33 per basic share), an increase of $60.3 million ($0.30 per basic share) or 25.5%.Adjusted net income4 was $294.1 million ($1.32 per basic share), an increase of $52.5 million ($0.27 per basic share) or 21.7%.The consolidated net debt leverage ratio5 decreased to 2.69x and remains the lowest among Canada’s major telecommunications providers.On September 3, 2026, Quebecor entered into a new 12‑year sublicensing agreement with Rogers Communications (“Rogers”) for French‑language broadcast rights to National Hockey League (“NHL”) games. Effective from the 2026‑2027 season through the 2037‑2038 season, this agreement enables TVA Sports to build on its current role as an official French‑language NHL broadcaster, ensuring continuity in its position as the premier destination for watching hockey in French in Québec and across Canada. The illico+ platform will be added to the broadcasting landscape in keeping with the continued expansion to more streaming platforms.On October 1, 2026, Videotron Ltd. (“Videotron”) announced the expansion of its wireless subscription area to several communities in Abitibi‑Témiscamingue, Nord‑du‑Québec, Saguenay–Lac‑Saint‑Jean and Bas‑Saint‑Laurent, providing more than 25,000 residents with access to a genuine competitive alternative for mobile service.On July 24, 2026, Freedom Mobile (“Freedom”) announced that access to its 5G+ network would be available at no additional cost to customers on all of its plans, provided they have a compatible device and SIM card and are located within an eligible coverage area. Freedom also continued the rollout of its 5G and 5G+ networks in Ontario, Alberta and British Columbia, improving connectivity for more than 500,000 additional Canadians.During the third quarter of 2026, Videotron repaid a total of $200.0 million under the third tranche of its term credit facility. An additional repayment of $100.0 million was made on October 6, 2026. Following these repayments, the balance of the facility was reduced from $400.0 million to $100.0 million.
_____________________
1 See “Adjusted cash flows from operations” under “Definitions.”
2 See “Adjusted EBITDA” under “Definitions.”
3 See “Key performance indicators” under “Definitions.”
4 See “Adjusted net income” under “Definitions.”
5 See “Consolidated net debt leverage ratio” under “Definitions.”
Comments by Pierre Karl Péladeau, President and Chief Executive Officer of Quebecor
“Quebecor delivered an excellent performance in the third quarter of 2026, as reflected by increases of 14.6% in adjusted cash flows from operations, 12.5% in adjusted EBITDA and 3.5% in revenues. These results reflect the significant contribution of the Telecommunications and Media segments, as well as the $31.5 million favourable impact of stock‑based compensation. Demonstrating our financial discipline and operational rigour, this solid performance, combined with the strongest balance sheet in the industry, enabled us to reduce consolidated net debt by more than $220 million in the third quarter and lower our consolidated net debt leverage ratio to 2.69x as at September 30, 2026, by far the lowest among Canada’s major telecommunications providers.
The Telecommunications segment once again distinguished itself with increases of 7.9% in adjusted cash flows from operations, 7.5% in adjusted EBITDA and 4.2% in revenues. Revenue growth was driven by mobile telephony and Internet access services, which recorded increases of 9.6% and 3.0%, respectively.
In mobile telephony, we reached a new milestone with a net increase of 136,700 subscriber connections, or 3.0%, representing the largest quarterly increase since the launch of the mobile service in 2010. All three of our brands, Videotron, Freedom and Fizz, contributed to this record growth, reflecting both the success of our Canada‑wide expansion, the strength of our organic growth in Québec and the soundness of our strategic decisions in a highly competitive market. The value and appeal of our offerings continue to set us apart, driving both the acquisition of new subscribers and the loyalty of our customer base. At the same time, mobile ARPU increased by $1.03, or 2.9%, marking a fourth consecutive quarterly increase and a sequential improvement, reflecting our ability to combine subscriber growth with higher average revenue per subscriber.
To better meet our customers’ needs, we continue to invest in enhancing the performance, capacity and coverage of our networks. Freedom notably continued the expansion of its 5G and 5G+ networks in Ontario, Alberta and British Columbia, providing improved connectivity to more than 500,000 additional Canadians. In addition, access to Freedom’s 5G+ network was extended to customers across all of its plans at no additional cost for those with a compatible device and SIM card located within an eligible coverage area. In Québec, Videotron expanded its wireless service subscription area in October to several communities in Abitibi‑Témiscamingue, Nord‑du‑Québec, Saguenay–Lac‑Saint‑Jean and Bas‑Saint‑Laurent. More than 25,000 additional residents can now take advantage of our competitive mobile offerings. These initiatives reflect our commitment to making leading‑edge wireless technologies accessible to more Canadians while providing a strong competitive alternative.
In the Media segment, TVA Group Inc. (“TVA Group”) reported adjusted EBITDA of $32.8 million, an increase of $14.3 million compared with the third quarter of 2025. This improvement was mainly attributable to savings generated through various cost‑reduction initiatives, including lower content costs, higher subscription revenues at TVA Sports, driven by TVA Sports Direct and new carriage rate agreements, as well as the recognition of the estimated benefit from the new tax credit for Québec news media organizations. While we welcome these results, we remain prudent and disciplined given the ongoing challenges facing the industry, particularly in advertising revenues.
Maintaining its focus on programming choices that are both successful and responsible, TVA Group led the Québec television market in the third quarter with a 43.5% market share, a 2.3‑point increase from the same period of 2025, while the TVA Network strengthened its leadership position with a 23.1% market share, a 1.0‑point increase, driven in particular by the success of flagship programs such as Chanteurs masqués and Indéfendable. In news programming, LCN remained the most‑watched specialty channel in Québec with a 9.2% market share, a 1.2‑point increase. LCN and the TVA Network cemented their status as the authoritative sources for political news. During the recent election campaign, Face‑à‑face 2026 and Québec 2026 were the most‑watched leaders’ debate and election‑night broadcast.
In addition, a new 12‑year sublicensing agreement was reached with Rogers for the French‑language broadcast rights to NHL games through the 2037‑2038 season. This agreement reinforces TVA Sports’ position as a premier destination for hockey fans in Québec and across Canada. In an environment marked by changing viewing habits and the diversification of distribution platforms, illico+ will also become part of the distribution ecosystem.
The superior performance of our operations, the quality of our assets and the strength of our brands allow us to look to the future with confidence. Backed by our solid financial position, we continue to pursue our pan‑Canadian expansion while maintaining disciplined capital allocation to create sustainable value for all our stakeholders.”
Non‑IFRS financial measures
The Corporation uses financial measures not standardized under International Financial Reporting Standards (“IFRS”), such as adjusted EBITDA, adjusted net income, adjusted cash flows from operations, free cash flows and consolidated net debt leverage ratio, and key performance indicators, including revenue generating unit (“RGU”) and mobile ARPU. Definitions of the non‑IFRS measures and key performance indicators used by the Corporation in this press release are provided in the “Definitions” section.
Financial table
Table 1
Consolidated summary of income, cash flows and balance sheet
(in millions of Canadian dollars, except per basic share data)
Three months ended
September 30
Nine months ended
September 30
2026
2025
2026
2025
Income
Revenues:
Telecommunications
$
1,267.6
$
1,216.2
$
3,719.1
$
3,563.1
Media
154.2
152.1
495.5
491.1
Sports and Entertainment
64.5
68.3
161.9
169.5
Inter‑segments
(31.6)
(31.1)
(86.4)
(94.7)
1,454.7
1,405.5
4,290.1
4,129.0
Adjusted EBITDA (negative adjusted EBITDA):
Telecommunications
647.5
602.5
1,908.8
1,793.4
Media
39.7
23.4
64.3
14.1
Sports and Entertainment
14.1
15.0
19.0
23.2
Head Office
5.4
(12.8)
(81.4)
(47.9)
706.7
628.1
1,910.7
1,782.8
Depreciation and amortization
(219.0)
(213.6)
(645.8)
(642.7)
Financial expenses
(79.5)
(85.0)
(235.2)
(263.5)
Restructuring, impairment of assets and other
(1.8)
(8.1)
(8.2)
(27.4)
Other items
3.3
0.1
42.6
8.7
Income taxes
(107.1)
(82.8)
(261.9)
(218.7)
Net income
$
302.6
$
238.7
$
802.2
$
639.2
Net income attributable to shareholders
$
296.4
$
236.1
$
792.7
$
644.5
Adjusted net income
294.1
241.6
754.9
653.5
Per basic share:
Net income attributable to shareholders
1.33
1.03
3.53
2.80
Adjusted net income
1.32
1.05
3.36
2.84
Table 1 (continued)
Three months ended
September 30
Nine months ended
September 30
2026
2025
2026
2025
Capital expenditures:
Telecommunications
$
172.4
$
162.1
$
470.5
$
454.1
Media
3.3
2.3
8.7
6.2
Sports and Entertainment
1.2
1.1
4.2
3.8
Head Office
0.1
0.2
0.2
0.2
177.0
165.7
483.6
464.3
Cash flows:
Adjusted cash flows from operations:
Telecommunications
475.1
440.4
1,438.3
1,339.3
Media
36.4
21.1
55.6
7.9
Sports and Entertainment
12.9
13.9
14.8
19.4
Head Office
5.3
(13.0)
(81.6)
(48.1)
529.7
462.4
1,427.1
1,318.5
Free cash flows1
422.3
443.9
1,076.5
1,056.6
Cash flows provided by operating activities
592.8
581.8
1,582.7
1,540.0
Sept. 30,
2026
Dec. 31,
2025
Balance sheet
Cash and cash equivalents
$
135.3
$
160.6
Working capital
(637.8)
(233.2)
Net assets related to derivative financial instruments
87.7
24.3
Total assets
12,990.7
12,812.2
Short‑term borrowings
645.8
–
Total long‑term debt (including current portion)
5,935.3
6,824.3
Lease liabilities (current and long term)
423.3
410.6
Equity attributable to shareholders
2,882.2
2,625.0
Equity
3,124.3
2,737.0
Consolidated net debt leverage ratio
2.69x
2.95x
______________________
1 See “Free cash flows” under “Definitions”.
2026/2025 third quarter comparison
Revenues: $1.45 billion, a $49.2 million (3.5%) increase.
Revenues increased in Telecommunications ($51.4 million or 4.2% of segment revenues) and in Media ($2.1 million or 1.4%).Revenues decreased in Sports and Entertainment ($3.8 million or ‑5.6%).
Adjusted EBITDA: $706.7 million, an increase of $78.6 million (12.5%), including the $31.5 million favourable impact of the stock‑based compensation charge across all of the Corporation’s segments, primarily attributable to the impact of the decrease in Quebecor’s share price in the third quarter of 2026, compared with an increase in the share price during the corresponding period of 2025.
Adjusted EBITDA increased in Telecommunications ($45.0 million or 7.5% of segment adjusted EBITDA) and in Media ($16.3 million or 69.7%).There was a favourable variance at Head Office ($18.2 million), essentially due to the stock‑based compensation charge.Adjusted EBITDA decreased in Sports and Entertainment ($0.9 million or ‑6.0%).
Net income attributable to shareholders: $296.4 million ($1.33 per basic share), an increase of $60.3 million ($0.30 per basic share) or 25.5%.
The main favourable variances were:$78.6 million increase in adjusted EBITDA;$6.3 million decrease in the charge for restructuring, impairment of assets and other;$5.5 million decrease in financial expenses.The unfavourable variances were:$24.3 million increase in the income tax expense;$5.4 million increase in the depreciation and amortization charge;$3.6 million unfavourable variance related to non‑controlling interests.
Adjusted net income: $294.1 million ($1.32 per basic share), an increase of $52.5 million ($0.27 per basic share) or 21.7%.
Adjusted cash flows from operations: $529.7 million, a $67.3 million (14.6%) increase due to the $78.6 million increase in adjusted EBITDA, partially offset by an $11.3 million increase in capital expenditures, mainly in the Telecommunications segment.
Cash flows provided by operating activities: $592.8 million, an $11.0 million (1.9%) increase due primarily to the increase in adjusted EBITDA, the decrease in current income taxes and the decrease in the cash portion of financial expenses, partially offset by an unfavourable net change in non‑cash balances related to operating activities.
2026/2025 year‑to‑date comparison
Revenues: $4.29 billion, a $161.1 million (3.9%) increase.
Revenues increased in Telecommunications ($156.0 million or 4.4% of segment revenues) and in Media ($4.4 million or 0.9%).Revenues decreased in Sports and Entertainment ($7.6 million or ‑4.5%).
Adjusted EBITDA: $1.91 billion, an increase of $127.9 million (7.2%), including the $55.3 million unfavourable impact of the stock‑based compensation charge across all of the Corporation’s segments, due mainly to a significant increase in Quebecor’s share price.
Adjusted EBITDA increased in Telecommunications ($115.4 million or 6.4% of segment adjusted EBITDA) and in Media ($50.2 million).There was an unfavourable variance at Head Office ($33.5 million), essentially due to the stock‑based compensation charge.Adjusted EBITDA decreased in Sports and Entertainment ($4.2 million).
Net income attributable to shareholders: $792.7 million ($3.53 per basic share), an increase of $148.2 million ($0.73 per basic share) or 23.0%.
The favourable variances were:$127.9 million increase in adjusted EBITDA;$33.9 million favourable variance in other items;$28.3 million decrease in financial expenses;$19.2 million decrease in the charge for restructuring, impairment of assets and other.The main unfavourable variances were:$43.2 million increase in the income tax expense;$14.8 million unfavourable variance related to non‑controlling interests.
Adjusted net income: $754.9 million ($3.36 per basic share), an increase of $101.4 million ($0.52 per basic share) or 15.5%.
Adjusted cash flows from operations: $1.43 billion, a $108.6 million (8.2%) increase due to the $127.9 million increase in adjusted EBITDA, partially offset by a $19.3 million increase in capital expenditures, mainly in the Telecommunications segment.
Cash flows provided by operating activities: $1.58 billion, a $42.7 million (2.8%) increase due primarily to the increase in adjusted EBITDA, a decrease in the cash portion of financial expenses and a decrease in the cash portion of the charge for restructuring, impairment of assets and other, partially offset by an unfavourable net change in non‑cash balances related to operating activities and by the increase in current income taxes.
Financing operations
During the third quarter of 2026, Videotron repaid a total of $200.0 million under the third tranche of its term credit facility. On October 6, 2026, Videotron made an additional repayment of $100.0 million under its term credit facility. Following these repayments, the balance of the facility was reduced from $400.0 million to $100.0 million.
Capital stock
On August 6, 2025, the Board of Directors of the Corporation authorized a normal course issuer bid for a maximum of 1,000,000 Class A Multiple Voting Shares (“Class A Shares”) representing approximately 1.3% of issued and outstanding Class A Shares, and for a maximum of 5,000,000 Class B Subordinate Voting Shares (“Class B Shares”) representing approximately 3.2% of issued and outstanding Class B Shares as of August 1, 2025. On May 13, 2026, the Corporation received approval from the Toronto Stock Exchange to amend its normal course issuer bid in order to increase the maximum number of Class B Shares that may be repurchased to 7,000,000 Class B Shares, representing approximately 4.5% of the Class B Shares public float as of August 1, 2025. All shares purchased under the bid were cancelled.
On August 5, 2026, the Board of Directors of the Corporation authorized a normal course issuer bid for a maximum of 1,000,000 Class A Shares representing approximately 1.3% of issued and outstanding Class A Shares, and for a maximum of 7,000,000 Class B Shares representing approximately 4.7% of issued and outstanding Class B Shares as of July 31, 2026. The purchases can be made from August 15, 2026 to August 14, 2027, at prevailing market prices on the open market through the facilities of the Toronto Stock Exchange or other alternative trading systems in Canada. All shares purchased under the bid will be cancelled.
During the first nine months of 2026, the Corporation repurchased and cancelled 3,899,900 Class B Shares for a total cash consideration of $237.6 million (3,740,908 Class B Shares repurchased and cancelled for a total cash consideration of $140.0 million in 2025) and 24,333 Class B Shares were issued following the exercise of stock options for a total cash consideration of $0.8 million (217,221 Class B Shares issued for a total cash consideration of $6.6 million in 2025).
Dividends declared
On November 4, 2026, the Board of Directors of Quebecor declared a quarterly dividend of $0.45 per share on its Class A Shares and Class B Shares, payable on December 15, 2026 to shareholders of record at the close of business on November 20, 2026. This dividend is designated an eligible dividend, as provided under subsection 89(14) of the Canadian Income Tax Act and its provincial counterpart.
Detailed financial information
For a detailed analysis of Quebecor’s third quarter 2026 results, please refer to the Management Discussion and Analysis and condensed consolidated financial statements of Quebecor, available on the Corporation’s website at www.quebecor.com/en/investors/financial‑documentation and the SEDAR+ website at www.sedarplus.ca.
Conference call for investors and webcast
Quebecor will hold a conference call to discuss its third quarter 2026 results on November 5, 2026, at 9:00 a.m. EST. There will be a question period reserved for financial analysts. To access the conference call, please dial 1‑800‑990‑4777. The conference call will also be broadcast live on Quebecor’s website at www.quebecor.com/en/investors/conferences‑and‑annual‑meeting. A recording will be available at the same address until February 3, 2027 for anyone unable to attend the call.
Cautionary statement regarding forward‑looking statements
The statements in this press release that are not historical facts are forward‑looking statements and are subject to significant known and unknown risks, uncertainties and assumptions that could cause Quebecor’s actual results for future periods to differ materially from those set forth in forward‑looking statements. Forward‑looking statements may be identified by the use of the conditional or by forward‑looking terminology such as the terms “plans,” “expects,” “may,” “anticipates,” “intends,” “estimates,” “projects,” “seeks,” “believes,” or similar terms, variations of such terms or the negative of such terms. Some important factors that could cause actual results to differ materially from those expressed in these forward‑looking statements include, but are not limited to:
Quebecor’s ability to continue successfully developing its network and the facilities that support its mobile services;general economic and political climate, financial and economic market conditions, including hyperinflation in Turkey, global business challenges, such as tariffs and trade barriers, as well as market conditions and variations in the businesses of local, regional and national advertisers in Quebecor’s newspapers, television outlets and other media properties;Quebecor’s ability to implement its business and growth strategies successfully;the intensity of competitive activity in the industries in which Quebecor operates and its ability to penetrate new markets and successfully develop its business, including in growth sectors and new geographies;fragmentation of the media landscape and its impact on the advertising market and the media properties of Quebecor;new technologies that might change consumer behaviour with respect to Quebecor’s product suites;impacts related to cybersecurity and the protection of personal information;unanticipated higher capital spending required for developing Quebecor’s network or to address the continued development of competitive alternative technologies, or the inability to obtain additional capital to continue the development of Quebecor’s business segments;the impacts of the significant and recurring investments that will be required for development and expansion and to compete effectively with the incumbent local exchange carriers and other current or potential competitors in the Telecommunications segment’s target markets;disruptions to the network through which Quebecor provides its television, Internet access, mobile and wireline telephony and over-the-top (“OTT”) video services, and its ability to protect such services against piracy, unauthorized access and other security breaches;labour disputes and strikes, service interruptions resulting from equipment breakdown, network failure, the threat of natural disasters, public‑health crises and political instability in some countries;changes in Quebecor’s ability to obtain services and equipment critical to its operations;impacts related to environmental issues;changes in laws and regulations, or in their interpretations, which could result, among other things, in increased competition, changes in Quebecor’s markets, increased operating expenses, capital expenditures or tax expenses, or a reduction in the value of some assets; and Quebecor’s indebtedness, interest rate and exchange rate fluctuations, the tightening of credit markets and the restrictions on its business imposed by the terms of its debt.
The forward‑looking statements in this document are made to provide investors and the public with a better understanding of the Corporation’s circumstances and are based on assumptions it believes to be reasonable as of the day on which they are made. Investors and others are cautioned that the foregoing list of factors that may affect future results is not exhaustive and that undue reliance should not be placed on any forward‑looking statements. For more information on the risks, uncertainties and assumptions that could cause the Corporation’s actual results to differ from current expectations, please refer to the Corporation’s public filings, available at www.sedarplus.ca and www.quebecor.com, including, in particular, the “Trend Information” and “Risks and Uncertainties” sections of the Corporation’s Management Discussion and Analysis for the year ended December 31, 2025.
The forward‑looking statements in this document reflect the Corporation’s expectations as of November 5, 2026, and are subject to change after that date. The Corporation expressly disclaims any obligation or intention to update or revise any forward‑looking statements, whether as a result of new information, future events or otherwise, except as required by applicable securities laws.
About Quebecor
Quebecor, a Canadian leader in telecommunications, entertainment, news media and culture, is one of the best‑performing integrated communications companies in the industry. Driven by their determination to deliver the best possible customer experience, all of Quebecor’s subsidiaries and brands are differentiated by their high‑quality, multiplatform, convergent products and services.
Quebecor (TSX: QBR.A, QBR.B) is headquartered in Québec and employs more than 11,000 people in Canada.
A family business founded in 1950, Quebecor is strongly committed to the community. Every year, it actively supports more than 400 organizations in the vital fields of culture, health, education, the environment and entrepreneurship.
Visit our website: www.quebecor.com
Follow us on X: www.x.com/Quebecor
DEFINITIONS
Adjusted EBITDA
In its analysis of operating results, the Corporation defines adjusted EBITDA, as reconciled to net income under IFRS, as net income before depreciation and amortization, financial expenses, restructuring, impairment of assets and other, other items and income taxes. Adjusted EBITDA as defined above is not a measure of results that is consistent with IFRS. It is not intended to be regarded as an alternative to IFRS financial performance measures or to the statement of cash flows as a measure of liquidity. This measure should not be considered in isolation or as a substitute for other performance measures prepared in accordance with IFRS. The Corporation’s management and Board of Directors use this measure in evaluating its consolidated results as well as the results of the Corporation’s operating segments. This measure eliminates the significant level of impairment and depreciation/amortization of tangible and intangible assets and is unaffected by the capital structure or investment activities of the Corporation and its business segments.
Adjusted EBITDA is also relevant because it is a component of the Corporation’s annual incentive compensation programs. A limitation of this measure, however, is that it does not reflect the capital expenditures and acquisitions of spectrum licences needed to generate revenues in the Corporation’s segments. The Corporation also uses other measures that do reflect capital expenditures, such as adjusted cash flows from operations and free cash flows. The Corporation’s definition of adjusted EBITDA may not be the same as similarly titled measures reported by other companies.
Table 2 provides a reconciliation of adjusted EBITDA to net income as disclosed in Quebecor’s condensed consolidated financial statements.
Table 2
Reconciliation of adjusted EBITDA to the net income measure used in the condensed consolidated financial statements
(in millions of Canadian dollars)
Three months ended
September 30
Nine months ended
September 30
2026
2025
2026
2025
Adjusted EBITDA (negative adjusted EBITDA):
Telecommunications
$
647.5
$
602.5
$
1,908.8
$
1,793.4
Media
39.7
23.4
64.3
14.1
Sports and Entertainment
14.1
15.0
19.0
23.2
Head Office
5.4
(12.8)
(81.4)
(47.9)
706.7
628.1
1,910.7
1,782.8
Depreciation and amortization
(219.0)
(213.6)
(645.8)
(642.7)
Financial expenses
(79.5)
(85.0)
(235.2)
(263.5)
Restructuring, impairment of assets and other
(1.8)
(8.1)
(8.2)
(27.4)
Other items
3.3
0.1
42.6
8.7
Income taxes
(107.1)
(82.8)
(261.9)
(218.7)
Net income
$
302.6
$
238.7
$
802.2
$
639.2
Adjusted net income
The Corporation defines adjusted net income, as reconciled to net income attributable to shareholders under IFRS, as net income attributable to shareholders before restructuring, impairment of assets and other, and other items, net of income tax and non‑controlling interest related to adjustments. Adjusted net income as defined above is not a measure of results that is consistent with IFRS. It should not be considered in isolation or as a substitute for measures of performance prepared in accordance with IFRS. The Corporation uses adjusted net income to analyze trends in the performance of its businesses. The above‑listed items are excluded from the calculation of this measure because they impair the comparability of financial results. Adjusted net income is more representative for forecasting income. The Corporation’s definition of adjusted net income may not be the same as similarly titled measures reported by other companies.
Table 3 provides a reconciliation of adjusted net income to the net income attributable to shareholders measure used in Quebecor’s condensed consolidated financial statements.
Table 3
Reconciliation of adjusted net income to the net income attributable to shareholders measure used in the condensed consolidated financial statements
(in millions of Canadian dollars)
Three months ended
September 30
Nine months ended
September 30
2026
2025
2026
2025
Adjusted net income
$
294.1
$
241.6
$
754.9
$
653.5
Restructuring, impairment of assets and other
(1.8)
(8.1)
(8.2)
(27.4)
Other items
3.3
0.1
42.6
8.7
Income taxes related to adjustments1
0.6
2.2
2.5
8.3
Non‑controlling interest related to adjustments
0.2
0.3
0.9
1.4
Net income attributable to shareholders
$
296.4
$
236.1
$
792.7
$
644.5
1
Includes the impact of fluctuations in income tax applicable to adjusted items, either for statutory reasons or in connection with tax transactions.
Adjusted cash flows from operations and free cash flows
Adjusted cash flows from operations
Adjusted cash flows from operations represents adjusted EBITDA less capital expenditures (excluding spectrum licence acquisitions). Adjusted cash flows from operations represents funds available for interest and income tax payments, expenditures related to restructuring programs, business acquisitions, acquisitions of spectrum licences, payment of dividends, repayment of long‑term debt and lease liabilities, and share repurchases. Adjusted cash flows from operations is not a measure of liquidity that is consistent with IFRS. It is not intended to be regarded as an alternative to IFRS financial performance measures or to the statement of cash flows as a measure of liquidity. Adjusted cash flows from operations is used by the Corporation’s management and Board of Directors to evaluate the cash flows generated by the operations of all of its segments, on a consolidated basis, in addition to the operating cash flows generated by each segment. Adjusted cash flows from operations is also relevant because it is a component of the Corporation’s annual incentive compensation programs. The Corporation’s definition of adjusted cash flows from operations may not be identical to similarly titled measures reported by other companies.
Free cash flows
Free cash flows represents cash flows provided by operating activities calculated in accordance with IFRS, less cash flows used for capital expenditures (excluding spectrum licence acquisitions), plus proceeds from disposal of assets. Free cash flows is used by the Corporation’s management and Board of Directors to evaluate cash flows generated by the Corporation’s operations. Free cash flows represents available funds for business acquisitions, acquisitions of spectrum licences, payment of dividends, repayment of long‑term debt and lease liabilities, and share repurchases. Free cash flows is not a measure of liquidity that is consistent with IFRS. It is not intended to be regarded as an alternative to IFRS financial performance measures or to the statement of cash flows as a measure of liquidity. The Corporation’s definition of free cash flows may not be identical to similarly titled measures reported by other companies.
Tables 4 and 5 provide a reconciliation of adjusted cash flows from operations and free cash flows to cash flows provided by operating activities reported in the condensed consolidated financial statements.
Table 4
Adjusted cash flows from operations
(in millions of Canadian dollars)
Three months ended
September 30
Nine months ended
September 30
2026
2025
2026
2025
Adjusted EBITDA (negative adjusted EBITDA)
Telecommunications
$
647.5
$
602.5
$
1,908.8
$
1,793.4
Media
39.7
23.4
64.3
14.1
Sports and Entertainment
14.1
15.0
19.0
23.2
Head Office
5.4
(12.8)
(81.4)
(47.9)
706.7
628.1
1,910.7
1,782.8
Minus
Capital expenditures:1
Telecommunications
(172.4)
(162.1)
(470.5)
(454.1)
Media
(3.3)
(2.3)
(8.7)
(6.2)
Sports and Entertainment
(1.2)
(1.1)
(4.2)
(3.8)
Head Office
(0.1)
(0.2)
(0.2)
(0.2)
(177.0)
(165.7)
(483.6)
(464.3)
Adjusted cash flows from operations
Telecommunications
475.1
440.4
1,438.3
1,339.3
Media
36.4
21.1
55.6
7.9
Sports and Entertainment
12.9
13.9
14.8
19.4
Head Office
5.3
(13.0)
(81.6)
(48.1)
$
529.7
$
462.4
$
1,427.1
$
1,318.5
1 Reconciliation to cash flows used for capital expenditures
as per condensed consolidated financial statements:
Three months ended
September 30
Nine months ended
September 30
2026
2025
2026
2025
Capital expenditures
$
(177.0)
$ (165.7)
$ (483.6)
$ (464.3)
Net variance in current operating items related to capital
expenditures (excluding government credits receivable for
large investment projects)
5.5
27.4
(24.3)
(20.2)
Cash flows used for capital expenditures
$
(171.5)
$ (138.3)
$ (507.9)
$ (484.5)
Table 5
Free cash flows and cash flows provided by operating activities reported in the condensed consolidated financial statements
(in millions of Canadian dollars)
Three months ended
September 30
Nine months ended
September 30
2026
2025
2026
2025
Adjusted cash flows from operations from Table 4
$
529.7
$
462.4
$
1,427.1
$
1,318.5
Plus (minus)
Cash portion of financial expenses
(77.4)
(82.9)
(228.8)
(256.7)
Cash portion of restructuring, impairment of assets
and other
(2.5)
(4.6)
(9.3)
(23.5)
Current income taxes
(40.4)
(57.0)
(233.5)
(215.3)
Other
0.7
1.0
0.4
0.8
Net change in non‑cash balances related to
operating activities
6.7
97.6
144.9
253.0
Net variance in current operating items related to
capital expenditures (excluding government
credits receivable for large investment projects)
5.5
27.4
(24.3)
(20.2)
Free cash flows
422.3
443.9
1,076.5
1,056.6
Plus (minus)
Cash flows used for capital expenditures
(excluding spectrum licence acquisitions)
171.5
138.3
507.9
484.5
Proceeds from disposal of assets
(1.0)
(0.4)
(1.7)
(1.1)
Cash flows provided by operating activities
$
592.8
$
581.8
$
1,582.7
$
1,540.0
Consolidated net debt leverage ratio
The consolidated net debt leverage ratio represents consolidated net debt divided by the trailing 12‑month adjusted EBITDA. Consolidated net debt consists of total long‑term debt, lease liabilities, short‑term borrowings, derivative financial instruments, and cash and cash equivalents. The consolidated net debt leverage ratio serves to evaluate the Corporation’s financial leverage and is used by management and the Board of Directors in decisions on the Corporation’s capital structure, including its financing strategy, and in managing debt maturity risks. The consolidated net debt leverage ratio is not a measure established in accordance with IFRS. It is not intended to be used as an alternative to IFRS measures or the balance sheet to evaluate the Corporation’s financial position. The Corporation’s definition of consolidated net debt leverage ratio may not be identical to similarly titled measures reported by other companies.
Table 6 provides the calculation of consolidated net debt leverage ratio and the reconciliation to balance sheet items reported in Quebecor’s condensed consolidated financial statements.
Table 6
Consolidated net debt leverage ratio
(in millions of Canadian dollars)
Sept. 30, 2026
Dec. 31, 2025
Total long‑term debt1
$
5,935.3
$
6,824.3
Plus (minus)
Lease liabilities2
423.3
410.6
Short‑term borrowings
645.8
–
Derivative financial instruments3
(87.7)
(24.3)
Cash and cash equivalents
(135.3)
(160.6)
Consolidated net debt
6,781.4
7,050.0
Divided by:
Trailing 12‑month adjusted EBITDA
$
2,521.1
$
2,393.2
Consolidated net debt leverage ratio
2.69x
2.95x
1 Excluding financing costs.
2 Total liabilities.
3 Assets less liabilities.
Key performance indicators
Revenue‑generating unit
The Corporation uses RGU, an industry metric, as a key performance indicator. An RGU represents a subscriber connection to the mobile or wireline telephony service or a subscription to the Internet access or television service. RGU is not a measurement that is consistent with IFRS and the Corporation’s definition and calculation of RGU may not be the same as identically titled measurements reported by other companies or published by public authorities.
Average monthly mobile revenue per unit
The Corporation uses mobile ARPU, an industry metric, as a key performance indicator. This indicator is calculated by dividing mobile telephony revenues by the average number of mobile RGUs during the applicable period, and then dividing the resulting amount by the number of months in the applicable period. Mobile ARPU is not a measurement that is consistent with IFRS and the Corporation’s definition and calculation of mobile ARPU may not be the same as identically titled measurements reported by other companies.
QUEBECOR INC.
CONSOLIDATED STATEMENTS OF INCOME
(in millions of Canadian dollars, except for earnings per share data)
Three months ended
Nine months ended
(unaudited)
September 30
September 30
2026
2025
2026
2025
Revenues
$
1,454.7
$
1,405.5
$
4,290.1
$
4,129.0
Employee costs
166.3
195.6
658.3
609.0
Purchase of goods and services
581.7
581.8
1,721.1
1,737.2
Depreciation and amortization
219.0
213.6
645.8
642.7
Financial expenses
79.5
85.0
235.2
263.5
Restructuring, impairment of assets and other
1.8
8.1
8.2
27.4
Other items
(3.3)
(0.1)
(42.6)
(8.7)
Income before income taxes
409.7
321.5
1,064.1
857.9
Income taxes:
Current
40.4
57.0
233.5
215.3
Deferred
66.7
25.8
28.4
3.4
107.1
82.8
261.9
218.7
Net income
$
302.6
$
238.7
$
802.2
$
639.2
Net income (loss) attributable to
Shareholders
$
296.4
$
236.1
$
792.7
$
644.5
Non-controlling interests
6.2
2.6
9.5
(5.3)
Earnings per share attributable to shareholders
Basic
$
1.33
$
1.03
$
3.53
$
2.80
Diluted
1.29
1.02
3.44
2.78
Weighted average number of shares outstanding (in millions)
223.4
229.3
224.8
230.2
Weighted average number of diluted shares (in millions)
229.4
231.2
230.3
232.1
QUEBECOR INC.
CONSOLIDATED STATEMENTS OF COMPREHENSIVE INCOME
(in millions of Canadian dollars)
Three months ended
Nine months ended
(unaudited)
September 30
September 30
2026
2025
2026
2025
Net income
$
302.6
$
238.7
$
802.2
$
639.2
Other comprehensive (loss) income:
Items that may be reclassified to income:
Cash flow hedges:
(Loss) gain on valuation of derivative financial instruments
(9.1)
0.9
(32.6)
46.9
Deferred income taxes
1.7
(1.5)
3.2
(4.0)
Gain (loss) on translation of foreign operations
1.0
(0.3)
17.0
(3.4)
Items that will not be reclassified to income:
Equity investments:
Gain (loss) on revaluation of equity investments
1.4
(6.9)
(5.3)
15.1
Deferred income taxes
(0.2)
0.9
0.7
(2.0)
(5.2)
(6.9)
(17.0)
52.6
Comprehensive income
$
297.4
$
231.8
$
785.2
$
691.8
Comprehensive income (loss) attributable to
Shareholders
$
291.7
$
229.2
$
774.0
$
697.1
Non-controlling interests
5.7
2.6
11.2
(5.3)
QUEBECOR INC.
SEGMENTED INFORMATION
(in millions of Canadian dollars)
(unaudited)
Three months ended September 30, 2026
Sports
Head
and
office
Telecommuni-
Enter-
and Inter-
cations
Media
tainment
segments
Total
Revenues
$
1,267.6
$
154.2
$
64.5
$
(31.6)
$
1,454.7
Employee costs
124.4
30.1
10.3
1.5
166.3
Purchase of goods and services
495.7
84.4
40.1
(38.5)
581.7
Adjusted EBITDA1
647.5
39.7
14.1
5.4
706.7
Depreciation and amortization
219.0
Financial expenses
79.5
Restructuring, impairment of assets and other
1.8
Other items
(3.3)
Income before income taxes
$
409.7
Cash flows used for capital expenditures
$
167.4
$
2.8
$
1.2
$
0.1
$
171.5
Three months ended September 30, 2025
Sports
Head
and
office
Telecommuni-
Enter-
and Inter-
cations
Media
tainment
segments
Total
Revenues
$
1,216.2
$
152.1
$
68.3
$
(31.1)
$
1,405.5
Employee costs
127.0
38.1
12.5
18.0
195.6
Purchase of goods and services
486.7
90.6
40.8
(36.3)
581.8
Adjusted EBITDA1
602.5
23.4
15.0
(12.8)
628.1
Depreciation and amortization
213.6
Financial expenses
85.0
Restructuring, impairment of assets and other
8.1
Other items
(0.1)
Income before income taxes
$
321.5
Cash flows used for capital expenditures
$
131.7
$
5.2
$
1.2
$
0.2
$
138.3
QUEBECOR INC.
SEGMENTED INFORMATION (continued)
(in millions of Canadian dollars)
(unaudited)
Nine months ended September 30, 2026
Sports
Head
and
office
Telecommuni-
Enter-
and Inter-
cations
Media
tainment
segments
Total
Revenues
$
3,719.1
$
495.5
$
161.9
$
(86.4)
$
4,290.1
Employee costs
406.4
118.1
39.2
94.6
658.3
Purchase of goods and services
1,403.9
313.1
103.7
(99.6)
1,721.1
Adjusted EBITDA1
1,908.8
64.3
19.0
(81.4)
1,910.7
Depreciation and amortization
645.8
Financial expenses
235.2
Restructuring, impairment of assets and other
8.2
Other items
(42.6)
Income before income taxes
$
1,064.1
Cash flows used for capital expenditures
$
498.3
$
5.2
$
4.2
$
0.2
$
507.9
Nine months ended September 30, 2025
Sports
Head
and
office
Telecommuni-
Enter-
and Inter-
cations
Media
tainment
segments
Total
Revenues
$
3,563.1
$
491.1
$
169.5
$
(94.7)
$
4,129.0
Employee costs
384.5
128.4
38.6
57.5
609.0
Purchase of goods and services
1,385.2
348.6
107.7
(104.3)
1,737.2
Adjusted EBITDA1
1,793.4
14.1
23.2
(47.9)
1,782.8
Depreciation and amortization
642.7
Financial expenses
263.5
Restructuring, impairment of assets and other
27.4
Other items
(8.7)
Income before income taxes
$
857.9
Cash flows used for capital expenditures
$
467.2
$
13.3
$
3.8
$
0.2
$
484.5
1
The Chief Executive Officer uses adjusted EBITDA as the measure of profit to assess the performance of each segment. Adjusted EBITDA is a non-IFRS measure and is defined as net income before depreciation and amortization, financial expenses, restructuring, impairment of assets and other, other items and income taxes.
QUEBECOR INC.
CONSOLIDATED STATEMENTS OF EQUITY
(in millions of Canadian dollars)
(unaudited)
Equity attributable to shareholders
Equity
attributable
to non-
controlling
interests
Accumulated
other com-
prehensive
(loss) income
Capital
stock
Contributed
surplus
Retained
earnings
Total equity
Balance as of December 31, 2024
$
1,041.2
$
17.4
$
1,143.6
$
(45.0)
$
107.5
$
2,264.7
Net income (loss)
–
–
644.5
–
(5.3)
639.2
Other comprehensive income
–
–
–
52.6
–
52.6
Dividends
–
–
(241.5)
–
(0.4)
(241.9)
Repurchase of Class B Shares
(24.6)
–
(115.4)
–
–
(140.0)
Issuance of Class B Shares
6.6
2.2
–
–
–
8.8
Balance as of September 30, 2025
1,023.2
19.6
1,431.2
7.6
101.8
2,583.4
Net income
–
–
211.5
–
10.1
221.6
Other comprehensive income
–
–
–
89.4
0.1
89.5
Dividends
–
–
(79.7)
–
–
(79.7)
Repurchase of Class B Shares
(10.4)
–
(67.4)
–
–
(77.8)
Balance as of December 31, 2025
1,012.8
19.6
1,495.6
97.0
112.0
2,737.0
Net income
–
–
792.7
–
9.5
802.2
Other comprehensive income
–
–
–
(18.7)
1.7
(17.0)
Dividends
–
–
(280.7)
–
–
(280.7)
Repurchase of Class B Shares
(25.7)
–
(211.9)
–
–
(237.6)
Issuance of Class B Shares
0.8
0.7
–
–
–
1.5
Business acquisition
–
–
–
–
118.9
118.9
Balance as of September 30, 2026
$
987.9
$
20.3
$
1,795.7
$
78.3
$
242.1
$
3,124.3
CONSOLIDATED STATEMENTS OF CASH FLOWS
(in millions of Canadian dollars)
Three months ended
Nine months ended
(unaudited)
September 30
September 30
2026
2025
2026
2025
Cash flows related to operating activities
Net income
$
302.6
$
238.7
$
802.2
$
639.2
Adjustments for:
Depreciation of property, plant and equipment
124.8
127.9
377.4
381.4
Amortization of intangible assets
61.2
52.3
169.3
164.0
Depreciation of right-of-use assets
33.0
33.4
99.1
97.3
Amortization of financing costs
2.1
2.1
6.4
6.8
Impairment of assets
0.2
3.6
0.9
5.1
Share of results in associates
(1.6)
(0.1)
(8.7)
(8.7)
Gain on revaluation of an equity interest
–
–
(30.1)
–
Deferred income taxes
66.7
25.8
28.4
3.4
Other
(2.9)
0.5
(7.1)
(1.5)
586.1
484.2
1,437.8
1,287.0
Net change in non-cash balances related to operating activities
6.7
97.6
144.9
253.0
Cash flows provided by operating activities
592.8
581.8
1,582.7
1,540.0
Cash flows related to investing activities
Capital expenditures
(171.5)
(138.3)
(507.9)
(484.5)
Deferred subsidies (used) received to finance capital expenditures
(11.5)
(4.6)
(19.6)
10.3
Business acquisitions, net of cash and cash equivalents acquired
–
–
(91.3)
–
Proceeds from disposals of assets
1.0
0.4
1.7
1.1
Other
4.2
0.8
9.7
2.0
Cash flows used in investing activities
(177.8)
(141.7)
(607.4)
(471.1)
Cash flows related to financing activities
Net change in short-term borrowings
(16.4)
(3.4)
575.1
(6.7)
Net change under revolving facilities, net of financing costs
15.4
(59.4)
22.7
–
Repayment of long-term debt
(200.0)
–
(1,000.0)
(400.0)
Repayment of lease liabilities
(34.1)
(33.3)
(97.1)
(93.5)
Issuance of Class B Shares
–
5.3
0.8
6.6
Repurchase of Class B Shares
(52.7)
(49.3)
(237.6)
(140.0)
Dividends
(100.5)
(80.7)
(280.7)
(241.9)
Cash flows used in financing activities
(388.3)
(220.8)
(1,016.8)
(875.5)
Net change in cash, cash equivalents and restricted cash
26.7
219.3
(41.5)
193.4
Effect of translation on cash and cash equivalents
in foreign currencies
(0.5)
–
(3.4)
–
Cash, cash equivalents and restricted cash at beginning of period
124.7
70.1
195.8
96.0
Cash, cash equivalents and restricted cash at end of period
$
150.9
$
289.4
$
150.9
$
289.4
QUEBECOR INC.
CONSOLIDATED BALANCE SHEETS
(in millions of Canadian dollars)
(unaudited)
September 30
December 31
2026
2025
Assets
Current assets
Cash and cash equivalents
$
135.3
$
160.6
Restricted cash
15.6
35.2
Accounts receivable
1,088.1
1,067.8
Contract assets
92.5
109.2
Inventories
380.6
414.3
Derivative financial instruments
12.4
–
Other current assets
195.3
195.2
1,919.8
1,982.3
Non-current assets
Property, plant and equipment
3,219.2
3,282.7
Intangible assets
3,666.0
3,441.9
Right-of-use assets
385.6
374.1
Goodwill
2,891.9
2,713.4
Derivative financial instruments
79.1
57.9
Deferred income taxes
51.1
42.0
Other assets
778.0
917.9
11,070.9
10,829.9
Total assets
$
12,990.7
$
12,812.2
Liabilities and equity
Current liabilities
Short-term borrowings
$
645.8
$
–
Accounts payable, accrued charges and provisions
1,150.1
1,142.2
Deferred revenue
376.5
376.3
Other current liabilities
63.2
95.6
Current portion of long-term debt
204.9
491.6
Current portion of lease liabilities
117.1
109.8
2,557.6
2,215.5
Non-current liabilities
Long-term debt
5,703.3
6,301.5
Lease liabilities
306.2
300.8
Derivative financial instruments
3.8
33.6
Deferred income taxes
911.5
871.7
Other liabilities
384.0
352.1
7,308.8
7,859.7
Equity
Capital stock
987.9
1,012.8
Contributed surplus
20.3
19.6
Retained earnings
1,795.7
1,495.6
Accumulated other comprehensive income
78.3
97.0
Equity attributable to shareholders
2,882.2
2,625.0
Non-controlling interests
242.1
112.0
3,124.3
2,737.0
Total liabilities and equity
$
12,990.7
$
12,812.2
View original content:https://www.prnewswire.com/news-releases/quebecor-inc-reports-consolidated-results-for-third-quarter-2026-302929776.html
SOURCE Québecor

Best Tools For Social Media Automation: What Is It & How It Works by Expert Consumers

EPAM Reports Results for Third Quarter 2026
QUEBECOR INC. REPORTS CONSOLIDATED RESULTS FOR THIRD QUARTER 2026

Send Rakhi to UK swiftly with UK Gifts Portal

Whiteboard Series with NEAR | Ep: 45 Joel Thorstensson from ceramic.network

Nullmax and Renesas Forge Strategic Partnership to Deliver Competitive ADAS Solutions for the Global Market

Why You Should Build on #NEAR – Co-founder Illia Polosukhin at CV Labs
Whiteboard Series with NEAR | Ep: 45 Joel Thorstensson from ceramic.network

NEAR End of Year Town Hall 2021: The Open Web World, MetaBUILD 2 Hackathon and 2021 recap
Trending
-
 Technology5 days ago
ModelBest and OpenBMB Open-Source MiniCPM-OCR Series, Delivering High-Performance Document Parsing and AI-Powered Quality Control
-

 Technology4 days ago
From IFA Berlin to CES 2027: OlloBot Continues Its Journey in Emotional Companionship
-

 Technology4 days ago
Context Labs AI Distillery™ Lets Enterprises Run Sovereign AI on Data They Own
-

 Technology4 days ago
A new way to explore Japan with AI: Naviu AR Travel Companion for Japan Launches November 1 2026
-

 Coin Market3 days ago
Binance net outflows surge to $5.8B as withdrawals resume after record hack
-

 Coin Market3 days ago
THORChain halts swaps after block reorg bug, slowing Binance hackers
-
 Technology3 days ago
RD Technologies Upgrades Its Cross-Border Payments and Digital Finance Ecosystem
-

 Technology3 days ago
Thunes and UnionPay International Transform Payments to China’s Mainland, Launching High-Capacity Instant Payouts