
Technology
Hello Group Inc. Announces Unaudited Financial Results for the Third Quarter of 2024

Published
2 years agoon
By

BEIJING, Dec. 9, 2024 /PRNewswire/ — Hello Group Inc. (NASDAQ: MOMO) (“Hello Group” or the “Company”), a leading player in mainland China’s online social networking space, today announced its unaudited financial results for the third quarter of 2024.
Third Quarter of 2024 Highlights
Net revenues decreased by 12.1% year over year to RMB2,674.7 million (US$381.1 million*) in the third quarter of 2024. Net income attributable to Hello Group Inc. decreased to RMB449.4 million (US$64.0 million) in the third quarter of 2024, from RMB546.4 million in the same period of 2023.Non-GAAP net income attributable to Hello Group Inc. (note 1) decreased to RMB493.3 million (US$70.3 million) in the third quarter of 2024, from RMB605.9 million in the same period of 2023. Diluted net income per American Depositary Share (“ADS”) was RMB2.46 (US$0.35) in the third quarter of 2024, compared to RMB2.75 in the same period of 2023. Non-GAAP diluted net income per ADS (note 1) was RMB2.70 (US$0.38) in the third quarter of 2024, compared to RMB3.05 in the same period of 2023.Monthly Active Users (“MAU”) on Tantan app were 12.0 million in September 2024, compared to 15.7 million in September 2023.For the Momo app total paying users was 6.9 million for the third quarter of 2024, compared to 7.8 million for the same period last year. Tantan had 0.9 million paying users for the third quarter of 2024 compared to 1.4 million from the year ago period.
First Nine Months of 2024 Highlights
Net revenues decreased by 11.9% year over year to RMB7,926.5 million (US$1,129.5 million) for the first nine months of 2024.Net income attributable to Hello Group Inc. was RMB852.3 million (US$121.5 million) for the first nine months of 2024, compared to RMB1,505.1 million during the same period of 2023.Non-GAAP net income attributable to Hello Group Inc. (note 1) was RMB1,002.4 million (US$142.8 million) for the first nine months of 2024, compared to RMB1,710.0 million during the same period of 2023.Diluted net income per ADS was RMB4.51(US$0.64) for the first nine months of 2024, compared to RMB7.52 during the same period of 2023.Non-GAAP diluted net income per ADS (note 1) was RMB5.31(US$0.76) for the first nine months of 2024, compared to RMB8.53 during the same period of 2023.
“Q3 2024 was a fruitful quarter for us. We delivered satisfactory financial results and executed well against our strategic priorities across all business lines,” commented Yan Tang, Chairman and CEO of Hello Group. ” Our overseas business reaccelerated growth thanks to improved operational efficiency. Our team made good progress in advancing the localization process and expanding our product offering. This gives us more confidence to continue to invest firmly in more diversified overseas markets.”
* This press release contains translations of certain Renminbi amounts into U.S. dollars at specified rate solely for the convenience of readers. Unless otherwise noted, all translations from Renminbi to U.S. dollars, in this press release, were made at a rate of RMB7.0176 to US$1.00, the effective noon buying rate for September 30, 2024 as set forth in the H.10 statistical release of the Federal Reserve Board.
Third Quarter of 2024 Financial Results
Net revenues
Total net revenues were RMB2,674.7 million (US$381.1 million) in the third quarter of 2024, a decrease of 12.1% from RMB3,042.8 million in the third quarter of 2023.
Live video service revenues were RMB1,286.4 million (US$183.3 million) in the third quarter of 2024, a decrease of 16.0% from RMB1,530.8 million during the same period of 2023. The decrease was primarily attributable to our proactive operational adjustments to de-emphasize large scale competition events in the Momo app and a soft consumer sentiment in the current macro environment, and to a lesser degree, Tantan pivoting away from the less dating-centric live video service.
Value-added service revenues mainly include virtual gift revenues and membership subscription revenues. Total value-added service revenues were RMB1,356.3 million (US$193.3 million) in the third quarter of 2024, a decrease of 7.5% from RMB1,466.7 million during the same period of 2023. The decrease was primarily due to our product adjustments to improve Momo app’s ecosystem as well as the impact of the macro economy on consumer sentiment, and to a lesser extent, the decline in Tantan’s paying users which was in turn due to the decline in user base and the short-term impact of the product upgrade on new user paying conversions. The decrease was partially offset by the revenue growth from the new standalone apps.
Mobile marketing revenues were RMB30.7 million (US$4.4 million) in the third quarter of 2024, compared to RMB30.7 million during the same period of 2023.
Net revenues from the Momo segment decreased from RMB2,743.1 million in the third quarter of 2023 to RMB2,462.3 million (US$350.9 million) in the third quarter of 2024, primarily due to the decrease in net revenues from value-added service and live video service on Momo app. The decrease was partially offset by the revenue growth of the new standalone apps. Net revenues from the Tantan segment decreased from RMB295.0 million in the third quarter of 2023 to RMB212.1 million (US$30.2 million) in the third quarter of 2024, mainly due to the decrease in net revenues from live video service and value-added service.
Cost and expenses
Cost and expenses were RMB2,286.2 million (US$325.8 million) in the third quarter of 2024, a decrease of 7.1% from RMB2,461.1 million in the third quarter of 2023. The decrease was primarily attributable to: (a) a decrease in revenue sharing with broadcasters related to live video service on Momo app and Tantan app, and a decrease in revenue sharing with virtual gift recipients of virtual gift service on Momo app. The decrease was partially offset by an increase in revenue sharing with virtual gift recipients for new standalone apps; and (b) a decrease in salary expenses and share-based compensation expenses, due to our continuous optimization in personnel costs and the newly granted share options which had lower fair value.
Non-GAAP cost and expenses (note 1) were RMB2,242.2 million (US$319.5 million) in the third quarter of 2024, a decrease of 6.6% from RMB2,401.6 million during the same period of 2023.
Income from operations
Income from operations was RMB410.7 million (US$58.5 million) in the third quarter of 2024, compared to RMB621.8 million during the same period of 2023. Income from operations of the Momo segment was RMB397.5 million (US$56.7 million) in the third quarter of 2024, which decreased from RMB618.6 million in the third quarter of 2023. Income from operations of the Tantan segment was RMB14.7 million (US$2.1 million) in the third quarter of 2024, which decreased from RMB24.0 million in the third quarter of 2023.
Non-GAAP income from operations (note 1) was RMB454.7 million (US$64.8 million) in the third quarter of 2024, compared to RMB681.2 million during the same period of 2023. Non-GAAP income from operations of the Momo segment was RMB441.0 million (US$62.8 million) in the third quarter of 2024, which decreased from RMB674.5 million in the third quarter of 2023. Non-GAAP income from operations of the Tantan segment was RMB15.2 million (US$2.2 million) in the third quarter of 2024, compared to RMB27.6 million in the third quarter of 2023.
Income tax expenses
Income tax expenses were RMB95.3 million (US$13.6 million) in the third quarter of 2024, compared to RMB158.1 million in the third quarter of 2023. The decrease in income tax expenses was primarily due to the lower profit in the third quarter of 2024, and to a lesser extent, lower withholding tax rate due to our eligibility for a preferential tax rate since the beginning of the year.
Net income
Net income was RMB449.4 million (US$64.0 million) in the third quarter of 2024, compared to RMB542.2 million during the same period of 2023. Net income from the Momo segment was RMB436.4 million (US$62.2 million) in the third quarter of 2024, compared to RMB540.0 million in the same period of 2023. Net income from the Tantan segment was RMB14.4 million (US$2.1 million) in the third quarter of 2024, compared to RMB23.0 million in the third quarter of 2023.
Non-GAAP net income (note 1) was RMB493.3 million (US$70.3 million) in the third quarter of 2024, compared to RMB601.6 million during the same period of 2023. Non-GAAP net income from the Momo segment was RMB479.9 million (US$68.4 million) in the third quarter of 2024, which decreased from RMB595.9 million in the third quarter of 2023. Non-GAAP net income of the Tantan segment was RMB14.9 million (US$2.1 million) in the third quarter of 2024, compared to RMB26.6 million in the third quarter of 2023.
Net income attributable to Hello Group Inc.
Net income attributable to Hello Group Inc. was RMB449.4 million (US$64.0 million) in the third quarter of 2024, compared to RMB546.4 million during the same period of 2023.
Non-GAAP net income (note 1) attributable to Hello Group Inc. was RMB493.3 million (US$70.3 million) in the third quarter of 2024, compared to RMB605.9 million during the same period of 2023.
Net income per ADS
Diluted net income per ADS was RMB2.46 (US$0.35) in the third quarter of 2024, compared to RMB2.75 in the third quarter of 2023.
Non-GAAP diluted net income per ADS (note 1) was RMB2.70 (US$0.38) in the third quarter of 2024, compared to RMB3.05 in the third quarter of 2023.
Cash and cash flow
As of September 30, 2024, the Company’s cash, cash equivalents, short-term deposits, long-term deposits, short-term restricted cash and long-term restricted cash totaled RMB14,782.2 million (US$2,106.4 million), compared to RMB13,478.5 million as of December 31, 2023.
Net cash provided by operating activities in the third quarter of 2024 was RMB341.0 million (US$48.6 million), compared to RMB582.5 million in the third quarter of 2023.
First Nine Months of 2024 Financial Results
Net revenues for the first nine months of 2024 were RMB7,926.5 million (US$1,129.5 million), a decrease of 11.9% from RMB8,999.4 million in the same period of 2023.
Net income attributable to Hello Group Inc. was RMB852.3 million (US$121.5 million) for the first nine months of 2024, compared to RMB1,505.1 million during the same period of 2023.
Non-GAAP net income attributable to Hello Group Inc. (note 1) was RMB1,002.4 million (US$142.8 million) for the first nine months of 2024, compared to RMB1,710.0 million during the same period of 2023.
Diluted net income per ADS was RMB4.51 (US$0.64) during the first nine months of 2024, compared to RMB7.52 in the same period of 2023.
Non-GAAP diluted net income per ADS (note 1) was RMB5.31 (US$0.76) during the first nine months of 2024, compared to RMB8.53 in the same period of 2023.
Net cash provided by operating activities was RMB1,216.4 million (US$173.3 million) during the first nine months of 2024, compared to RMB1,861.3 million in the same period of 2023.
Recent Development
Share repurchase program
On June 7, 2022, Hello Group’s board of directors authorized a share repurchase program under which the Company may repurchase up to US$200 million of its shares up to June 6, 2024 (the “Share Repurchase Program”). On March 14, 2024, Hello Group’s board of directors approved to amend the Share Repurchase Program to (i) extend the term of the Share Repurchase Program up to June 30, 2026, and (ii) upsize the Share Repurchase Program so that the Company is authorized to, from time to time, acquire up to an aggregate of US$286.1 million worth of its shares in the form of ADSs and/or the ordinary shares of the Company in the open market and through privately negotiated transactions, in block trades and/or through other legally permissible means, depending on market conditions and in accordance with applicable rules and regulations.
As of December 9, 2024, the Company has repurchased 40.0 million ADSs for US$238.4 million on the open market under Share Repurchase Program announced on June 7, 2022 and amended on March 14, 2024, at an average purchase price of US$5.94 per ADS.
Business Outlook
For the fourth quarter of 2024, the Company expects total net revenues to be between RMB2.56 billion to RMB2.66 billion, representing a decrease of 14.7% to 11.4% year over year. This forecast reflects the Company’s current and preliminary views on the market and operational conditions, which are subject to change.
Note 1: Non-GAAP measures
To supplement our consolidated financial statements presented in accordance with U.S. generally accepted accounting principles (“GAAP”), we, Hello Group, use various non-GAAP financial measures that are adjusted from the most comparable GAAP results to exclude share-based compensation and such adjustment has no impact on income tax.
Reconciliations of our non-GAAP financial measures to our U.S. GAAP financial measures are shown in tables at the end of this earnings release, which provide more details about the non-GAAP financial measures.
Our non-GAAP financial information is provided as additional information to help investors compare business trends among different reporting periods on a consistent basis and to enhance investors’ overall understanding of the historical and current financial performance of our continuing operations and our prospects for the future. Our non-GAAP financial information should be considered in addition to results prepared in accordance with GAAP, but should not be considered a substitute for or superior to the GAAP results. In addition, our calculation of the non-GAAP financial measures may be different from the calculation used by other companies, and therefore comparability may be limited.
Our non-GAAP information (including non-GAAP cost and operating expenses, income (loss) from operations, net income (loss), net income attributable to Hello Group Inc., and diluted net income per ADS) is adjusted from the most comparable GAAP results to exclude share-based compensation and such adjustment has no impact on income tax. A limitation of using these non-GAAP financial measures is that share-based compensation has been and will continue to be for the foreseeable future significant recurring expenses in our results of operations. We compensate for such limitation by providing reconciliations of our non-GAAP measures to our U.S. GAAP measures. Please see the reconciliation tables at the end of this earnings release.
Conference Call
Hello Group’s management will host an earnings conference call on Monday, December 9, 2024, at 7:00 a.m. U.S. Eastern Time (8:00 p.m. Beijing / Hong Kong Time on December 9, 2024).
Participants can register for the conference call by navigating to:
https://s1.c-conf.com/diamondpass/10043397-w4b3f5.html.
Upon registration, each participant will receive details for the conference call, including dial-in numbers, conference call passcode and a unique access PIN. Please dial in 10 minutes before the call is scheduled to begin.
A telephone replay of the call will be available after the conclusion of the conference call through December 16, 2024. The dial-in details for the replay are as follows:
U.S. / Canada: 1-855-883-1031
Hong Kong: 800-930-639
Passcode: 10043397
Additionally, a live and archived webcast of the conference call will be available on the Investor Relations section of Hello Group’s website at https://ir.hellogroup.com.
About Hello Group Inc.
We are a leading player in mainland China’s online social networking space. Through Momo, Tantan and other properties within our product portfolio, we enable users to discover new relationships, expand their social connections and build meaningful interactions. Momo is a mobile application that connects people and facilitates social interactions based on location, interests and a variety of online recreational activities. Tantan, which was added into our family of applications through acquisition in May 2018, is a leading social and dating application. Tantan is designed to help its users find and establish romantic connections as well as meet interesting people. Starting from 2019, we have incubated a number of other new apps, such as Hertz, Soulchill, and Duidui, which target more niche markets and more selective demographics.
For investor and media inquiries, please contact:
Hello Group Inc.
Investor Relations
Phone: +86-10-5731-0538
Email: ir@hellogroup.com
Christensen
In China
Ms. Xiaoyan Su
Phone: +86-10-5900-1548
E-mail: Xiaoyan.Su@christensencomms.com
In U.S.
Ms. Linda Bergkamp
Phone: +1-480-614-3004
Email: linda.bergkamp@christensencomms.com
Safe Harbor Statement
This news release contains “forward-looking” statements within the meaning of Section 27A of the Securities Act of 1933, as amended, and Section 21E of the Securities Exchange Act of 1934, as amended, and as defined in the Private Securities Litigation Reform Act of 1995. These forward-looking statements include but are not limited to our management quotes, our financial outlook for the fourth quarter of 2024, as well as the amount of, timing, methods and funding sources for repurchases of our shares under the share repurchase program.
Our forward-looking statements are not historical facts but instead represent only our belief regarding expected results and events, many of which, by their nature, are inherently uncertain and outside of our control. Our actual results and other circumstances may differ, possibly materially, from the anticipated results and events indicated in these forward-looking statements. Announced results for the third quarter of 2024 are preliminary, unaudited and subject to audit adjustment. In addition, we may not meet our financial outlook for the fourth quarter of 2024 and may be unable to grow our business in the manner planned. We may also modify our strategy for growth. Moreover, there are other risks and uncertainties that could cause our actual results to differ from what we currently anticipate, including those relating to our ability to retain and grow our user base, our ability to attract and retain sufficiently trained professionals to support our operations, our ability to anticipate and develop new services and enhance existing services to meet the demand of our users or customers, the market price of the Company’s stock prevailing from time to time, the nature of other investment opportunities presented to the Company from time to time, the Company’s cash flows from operations, general economic conditions, and other factors. For additional information on these and other important factors that could adversely affect our business, financial condition, results of operations, and prospects, please see our filings with the U.S. Securities and Exchange Commission.
All information provided in this press release and in the attachments is as of the date of the press release. We undertake no obligation to update any forward-looking statement, whether as a result of new information, future events or otherwise, after the date of this release, except as required by law. Such information speaks only as of the date of this release.
Hello Group Inc.
Unaudited Condensed Consolidated Statement of Operations
(All amounts in thousands, except share and per share data)
Three months
First nine months
Ended September 30
Ended September 30
2023
2024
2024
2023
2024
2024
RMB
RMB
US$
RMB
RMB
US$
Net revenues:
Live video service
1,530,797
1,286,442
183,317
4,548,986
3,828,003
545,486
Value-added service
1,466,727
1,356,270
193,267
4,327,678
3,995,962
569,420
Mobile marketing
30,705
30,735
4,380
88,762
99,320
14,153
Mobile games
7,864
–
–
14,169
432
62
Other services
6,754
1,217
173
19,796
2,758
393
Total net revenues
3,042,847
2,674,664
381,137
8,999,391
7,926,475
1,129,514
Cost and expenses:
Cost of revenues
(1,771,530)
(1,623,723)
(231,379)
(5,255,277)
(4,722,520)
(672,954)
Research and development
(201,693)
(196,382)
(27,984)
(653,145)
(581,741)
(82,897)
Sales and marketing
(373,942)
(354,881)
(50,570)
(1,110,253)
(1,013,081)
(144,363)
General and administrative
(113,896)
(111,174)
(15,842)
(376,981)
(364,037)
(51,875)
Total cost and expenses
(2,461,061)
(2,286,160)
(325,775)
(7,395,656)
(6,681,379)
(952,089)
Other operating income, net
39,971
22,221
3,166
99,284
50,988
7,266
Income from operations
621,757
410,725
58,528
1,703,019
1,296,084
184,691
Interest income
96,791
134,875
19,220
311,899
386,919
55,136
Interest expense
(19,293)
(34,809)
(4,960)
(41,671)
(91,000)
(12,967)
Other gain or loss, net
–
–
–
4,565
(43,870)
(6,251)
Income before income tax and share of income (loss) on equity
method investments
699,255
510,791
72,788
1,977,812
1,548,133
220,609
Income tax expenses
(158,064)
(95,298)
(13,580)
(446,646)
(755,525)
(107,661)
Income before share of income (loss)on equity method
investments
541,191
415,493
59,208
1,531,166
792,608
112,948
Share of income (loss) on equity method investments
974
33,876
4,827
(31,940)
59,730
8,511
Net income
542,165
449,369
64,035
1,499,226
852,338
121,459
Less: net loss attributable to non-controlling interest
(4,263)
–
–
(5,886)
–
–
Net income attributable to the shareholders of Hello Group Inc.
546,428
449,369
64,035
1,505,112
852,338
121,459
Net income per share attributable to ordinary shareholders
Basic
1.44
1.29
0.18
3.98
2.36
0.34
Diluted
1.37
1.23
0.18
3.76
2.26
0.32
Weighted average shares used in calculating net income per ordinary
share
Basic
379,292,110
347,943,851
347,943,851
378,085,030
361,613,017
361,613,017
Diluted
398,296,690
365,942,405
365,942,405
405,490,366
377,697,017
377,697,017
Hello Group Inc.
Unaudited Condensed Consolidated Statement of Comprehensive Income
(All amounts in thousands, except share and per share data)
Three months
First nine months
Ended September 30
Ended September 30
2023
2024
2024
2023
2024
2024
RMB
RMB
US$
RMB
RMB
US$
Net income
542,165
449,369
64,035
1,499,226
852,338
121,459
Other comprehensive income (loss), net of tax:
Foreign currency translation adjustment
6,032
(287,150)
(40,919)
116,188
(190,687)
(27,173)
Comprehensive income
548,197
162,219
23,116
1,615,414
661,651
94,286
Less: comprehensive (loss) income attributed to the non-
controlling interest
(3,141)
(6,400)
(912)
5,377
(2,114)
(301)
Comprehensive income attributable to Hello Group Inc.
551,338
168,619
24,028
1,610,037
663,765
94,587
Hello Group Inc.
Unaudited Condensed Consolidated Balance Sheets
(All amounts in thousands, except share and per share data)
December 31
September 30
September 30
2023
2024
2024
RMB
RMB
US$
Assets
Current assets
Cash and cash equivalents
5,620,466
3,301,235
470,422
Short-term deposits
1,270,626
2,840,310
404,741
Restricted cash
10,147
4,084,937
582,099
Accounts receivable, net of allowance for doubtful accounts of
RMB12,780 and RMB12,490 as of December 31, 2023 and September
30, 2024, respectively
201,517
186,374
26,558
Amounts due from related parties
7,258
–
–
Prepaid expenses and other current assets
723,364
1,008,208
143,668
Total current assets
7,833,378
11,421,064
1,627,488
Long-term deposits
3,924,975
3,354,400
477,998
Long-term restricted cash
2,652,299
1,201,311
171,185
Right-of-use assets, net
109,572
288,193
41,067
Property and equipment, net
659,033
879,996
125,398
Intangible assets, net
17,086
13,247
1,888
Rental deposits
12,962
13,257
1,889
Long-term investments
786,911
783,521
111,651
Amounts due from RPT-non current
20,000
–
–
Other non-current assets
180,052
161,702
23,042
Deferred tax assets
31,741
35,938
5,121
Total assets
16,228,009
18,152,629
2,586,727
Liabilities and equity
Current liabilities
Accounts payable
616,681
608,607
86,723
Deferred revenue
442,805
443,036
63,132
Accrued expenses and other current liabilities
630,617
600,435
85,561
Amounts due to related parties
4,314
–
–
Lease liabilities due within one year
60,008
154,969
22,083
Income tax payable
94,719
93,432
13,314
Deferred consideration in connection with business acquisitions
27,261
26,945
3,840
Convertible Senior Notes-current
–
19,394
2,764
Long-term borrowings, current portion
215,615
1,938,385
276,218
Short-term borrowings
–
2,365,535
337,086
Total current liabilities
2,092,020
6,250,738
890,721
Deferred tax liabilities
24,987
323,362
46,079
Convertible Senior Notes
19,571
–
–
Long-term borrowings
1,938,385
–
–
Lease liabilities
52,171
142,803
20,349
Other non-current liabilities
114,085
130,359
18,576
Total liabilities
4,241,219
6,847,262
975,725
Shareholder’s equity (i)
11,986,790
11,305,367
1,611,002
Total liabilities and shareholder’s equity
16,228,009
18,152,629
2,586,727
(i): As of September 30, 2024, the number of ordinary shares outstanding was 344,219,472.
Hello Group Inc.
Unaudited Condensed Consolidated Statement of Cash Flows
(All amounts in thousands, except share and per share data)
Three months
First nine months
Ended September 30
Ended September 30
2023
2024
2024
2023
2024
2024
RMB
RMB
US$
RMB
RMB
US$
Cash flows from operating activities:
Net income
542,165
449,369
64,035
1,499,226
852,338
121,459
Adjustments to reconcile net income to net cash provided by operating
activities:
Depreciation of property and equipment
17,467
13,144
1,873
59,098
40,979
5,839
Amortization of intangible assets
1,279
1,279
182
3,837
3,837
547
Share-based compensation
59,472
43,951
6,264
204,877
150,079
21,385
Share of (income) loss on equity method investments
(974)
(33,876)
(4,827)
31,940
(59,730)
(8,511)
Gain on repurchase of convertible senior notes
–
–
–
(4,565)
–
–
Cash received on distributions from equity method investments
718
–
–
2,067
1,197
171
Loss on long-term investments
–
–
–
–
43,870
6,251
Gain or loss on disposal of property and equipment
(60)
(142)
(20)
(520)
(62)
(9)
Provision of (income) loss on receivable and other assets
(133)
1,754
250
10,071
3,675
524
Changes in operating assets and liabilities:
Accounts receivable
10,749
(3,876)
(552)
(9,916)
11,952
1,703
Prepaid expenses and other current assets
(96,572)
(97,212)
(13,853)
98,294
(91,846)
(13,088)
Amounts due from related parties
(27,114)
–
–
(27,059)
–
–
Rental deposits
1,301
493
70
2,252
(309)
(44)
Deferred tax assets
415
(117)
(17)
872
(4,195)
(598)
Other non-current assets
(50,578)
22,945
3,270
(27,639)
(183,398)
(26,134)
Accounts payable
6,987
16,036
2,285
38,825
(15,710)
(2,239)
Income tax payable
24,215
35,209
5,017
20,496
(1,288)
(184)
Deferred revenue
11,736
(838)
(119)
(11,137)
568
81
Accrued expenses and other current liabilities
15,374
(3,390)
(483)
(172,186)
61,357
8,743
Amount due to related parties
(8,401)
–
–
(5,504)
–
–
Deferred tax liabilities
47,681
(85,088)
(12,125)
130,198
294,333
41,942
Other non-current liabilities
26,741
(18,688)
(2,663)
17,757
108,705
15,490
Net cash provided by operating activities
582,468
340,953
48,587
1,861,284
1,216,352
173,328
Cash flows from investing activities:
Purchase of property and equipment
(238,219)
(19,796)
(2,821)
(259,463)
(263,814)
(37,593)
Payment for long-term investments
–
(28,000)
(3,990)
(9,000)
(33,250)
(4,738)
Purchase of short-term deposits
(531,214)
(2,133,086)
(303,962)
(1,028,556)
(2,133,086)
(303,962)
Cash received on maturity of short-term deposits
1,900,000
–
–
5,409,820
1,081,016
154,044
Cash received on investment income distribution
–
–
–
1,517
–
–
Purchase of long-term deposits
(2,498,860)
–
–
(3,848,860)
(718,860)
(102,437)
Cash received on maturity of long-term deposits
1,700,000
–
–
1,700,000
718,860
102,437
Cash received from sales of long-term investment
15,000
–
–
15,000
2,000
285
Loan to a third-party company
–
(96,680)
(13,777)
–
(96,680)
(13,777)
Other investing activities
137
212
30
1,822
895
128
Net cash provided by (used in) investing activities
346,844
(2,277,350)
(324,520)
1,982,280
(1,442,919)
(205,613)
Cash flows from financing activities:
Proceeds from exercise of share options
551
4
1
570
17
2
Repurchase of ordinary shares
(58,767)
(265,441)
(37,825)
(62,004)
(772,263)
(110,047)
Repurchase of subsidiary’s share options
(223)
–
–
(4,319)
–
–
Dividends payment
–
–
–
(937,249)
(716,302)
(102,072)
Proceeds from short-term borrowings
–
1,033,900
147,330
–
2,365,535
337,086
Proceeds from long-term borrowings
2,154,000
–
–
2,154,000
–
–
Repayment of long-term borrowings
–
(215,400)
(30,694)
–
(215,615)
(30,725)
Payment for redemption of convertible bonds
(86,932)
–
–
(2,679,942)
–
–
Net cash provided by (used in) financing activities
2,008,629
553,063
78,812
(1,528,944)
661,372
94,244
Effect of exchange rate changes
(7,837)
(178,773)
(25,478)
128,597
(130,234)
(18,559)
Net increase (decrease) in cash and cash equivalents
2,930,104
(1,562,107)
(222,599)
2,443,217
304,571
43,400
Cash, cash equivalents and restricted cash at the beginning of period
4,711,714
10,149,590
1,446,305
5,198,601
8,282,912
1,180,306
Cash, cash equivalents and restricted cash at the end of period
7,641,818
8,587,483
1,223,706
7,641,818
8,587,483
1,223,706
Hello Group Inc.
Reconciliation of Non-GAAP financial measures to comparable GAAP measures
(All amounts in thousands, except per share data)
1.
Reconciliation of Non-GAAP cost and operating expenses, income from operations, and net income to comparable GAAP measures.
Three months
Three months
Three months
Ended September 30, 2023
Ended September 30, 2024
Ended September 30, 2024
GAAP
Share-based
compensation
Non-GAAP
GAAP
Share-based
compensation
Non-GAAP
GAAP
Share-based
compensation
Non-GAAP
RMB
RMB
RMB
RMB
RMB
RMB
US$
US$
US$
Cost of revenues
(1,771,530)
1,211
(1,770,319)
(1,623,723)
2,143
(1,621,580)
(231,379)
305
(231,074)
Research and development
(201,693)
14,993
(186,700)
(196,382)
11,030
(185,352)
(27,984)
1,573
(26,411)
Sales and marketing
(373,942)
5,854
(368,088)
(354,881)
4,774
(350,107)
(50,570)
680
(49,890)
General and administrative
(113,896)
37,414
(76,482)
(111,174)
26,004
(85,170)
(15,842)
3,706
(12,136)
Cost and operating expenses
(2,461,061)
59,472
(2,401,589)
(2,286,160)
43,951
(2,242,209)
(325,775)
6,264
(319,511)
Income from operations
621,757
59,472
681,229
410,725
43,951
454,676
58,528
6,264
64,792
Net income attributable to Hello Group Inc.
546,428
59,472
605,900
449,369
43,951
493,320
64,035
6,264
70,299
Hello Group Inc.
Reconciliation of Non-GAAP financial measures to comparable GAAP measures
(All amounts in thousands, except per share data)
1.
Reconciliation of Non-GAAP cost and operating expenses, income from operations, and net income to comparable GAAP measures-continued.
First nine months
First nine months
First nine months
Ended September 30, 2023
Ended September 30, 2024
Ended September 30, 2024
GAAP
Share-based
compensation
Non-GAAP
GAAP
Share-based
compensation
Non-GAAP
GAAP
Share-based
compensation
Non-GAAP
RMB
RMB
RMB
RMB
RMB
RMB
US$
US$
US$
Cost of revenues
(5,255,277)
4,398
(5,250,879)
(4,722,520)
5,821
(4,716,699)
(672,954)
829
(672,125)
Research and development
(653,145)
51,186
(601,959)
(581,741)
33,328
(548,413)
(82,897)
4,749
(78,148)
Sales and marketing
(1,110,253)
20,413
(1,089,840)
(1,013,081)
15,040
(998,041)
(144,363)
2,143
(142,220)
General and administrative
(376,981)
128,880
(248,101)
(364,037)
95,890
(268,147)
(51,875)
13,664
(38,211)
Cost and operating expenses
(7,395,656)
204,877
(7,190,779)
(6,681,379)
150,079
(6,531,300)
(952,089)
21,385
(930,704)
Income from operations
1,703,019
204,877
1,907,896
1,296,084
150,079
1,446,163
184,691
21,385
206,076
Net income attributable to Hello Group Inc.
1,505,112
204,877
1,709,989
852,338
150,079
1,002,417
121,459
21,385
142,844
Hello Group Inc.
Unaudited Condensed Segment Report
(All amounts in thousands, except share and per share data)
Three months
Ended September 30, 2024
Momo
Tantan
QOOL
Total
Total
RMB
RMB
RMB
RMB
US$
Net revenues:
Live video service
1,219,890
66,552
–
1,286,442
183,317
Value-added service
1,219,115
137,155
–
1,356,270
193,267
Mobile marketing
22,368
8,367
–
30,735
4,380
Other services
899
–
318
1,217
173
Total net revenues
2,462,272
212,074
318
2,674,664
381,137
Cost and expenses (ii):
Cost of revenues
(1,523,515)
(100,171)
(37)
(1,623,723)
(231,379)
Research and development
(160,161)
(36,221)
–
(196,382)
(27,984)
Sales and marketing
(298,630)
(55,033)
(1,218)
(354,881)
(50,570)
General and administrative
(103,438)
(7,175)
(561)
(111,174)
(15,842)
Total cost and expenses
(2,085,744)
(198,600)
(1,816)
(2,286,160)
(325,775)
Other operating income
21,021
1,200
–
22,221
3,166
Income (loss) from operations
397,549
14,674
(1,498)
410,725
58,528
Interest income
134,605
268
2
134,875
19,220
Interest expense
(34,809)
–
–
(34,809)
(4,960)
Income (loss) before income tax and share of income on equity method
investments
497,345
14,942
(1,496)
510,791
72,788
Income tax expenses
(94,777)
(521)
–
(95,298)
(13,580)
Income (loss) before share of income on equity method investments
402,568
14,421
(1,496)
415,493
59,208
Share of income on equity method investments
33,876
–
–
33,876
4,827
Net income (loss)
436,444
14,421
(1,496)
449,369
64,035
(ii) Share-based compensation was allocated in cost of revenues and operating expenses as follows:
Three months
Ended September 30, 2024
Momo
Tantan
QOOL
Total
Total
RMB
RMB
RMB
RMB
US$
Cost of revenues
2,143
–
–
2,143
305
Research and development
10,533
497
–
11,030
1,573
Sales and marketing
4,774
–
–
4,774
680
General and administrative
26,002
2
–
26,004
3,706
Total cost and expenses
43,452
499
–
43,951
6,264
Hello Group Inc.
Reconciliation of GAAP and NON-GAAP Results of Unaudited Segment Report
(All amounts in thousands, except share and per share data)
Three months
Ended September 30, 2024
Momo
Tantan
QOOL
Total
Total
RMB
RMB
RMB
RMB
US$
Income (loss) from operations
397,549
14,674
(1,498)
410,725
58,528
Share-based compensation
43,452
499
–
43,951
6,264
Non-GAAP income (loss) from
operations
441,001
15,173
(1,498)
454,676
64,792
Net income (loss)
436,444
14,421
(1,496)
449,369
64,035
Share-based compensation
43,452
499
–
43,951
6,264
Non-GAAP net income (loss)
479,896
14,920
(1,496)
493,320
70,299
Hello Group Inc.
Unaudited Condensed Segment Report
(All amounts in thousands, except share and per share data)
Three months
Ended September 30, 2023
Momo
Tantan
QOOL
Total
Total
RMB
RMB
RMB
RMB
US$[1]
Net revenues:
Live video service
1,410,844
119,953
–
1,530,797
209,813
Value-added service
1,298,329
168,398
–
1,466,727
201,031
Mobile marketing
24,039
6,666
–
30,705
4,208
Mobile games
7,864
–
–
7,864
1,078
Other services
1,981
–
4,773
6,754
927
Total net revenues
2,743,057
295,017
4,773
3,042,847
417,057
Cost and expenses (iii):
Cost of revenues
(1,606,261)
(145,346)
(19,923)
(1,771,530)
(242,808)
Research and development
(151,649)
(50,044)
–
(201,693)
(27,644)
Sales and marketing
(298,919)
(71,978)
(3,045)
(373,942)
(51,253)
General and administrative
(105,339)
(5,656)
(2,901)
(113,896)
(15,611)
Total cost and expenses
(2,162,168)
(273,024)
(25,869)
(2,461,061)
(337,316)
Other operating income, net
37,750
1,985
236
39,971
5,478
Income (loss) from operations
618,639
23,978
(20,860)
621,757
85,219
Interest income
96,680
94
17
96,791
13,266
Interest expense
(19,293)
–
–
(19,293)
(2,644)
Income (loss) before income tax and share of income on equity
method investments
696,026
24,072
(20,843)
699,255
95,841
Income tax expenses
(156,992)
(1,072)
–
(158,064)
(21,664)
Income (loss) before share of income on equity method
investments
539,034
23,000
(20,843)
541,191
74,177
Share of income on equity method investments
974
–
–
974
133
Net income (loss)
540,008
23,000
(20,843)
542,165
74,310
(iii) Share-based compensation was allocated in cost of revenues and operating expenses as follows:
Three months
Ended September 30, 2023
Momo
Tantan
QOOL
Total
Total
RMB
RMB
RMB
RMB
US$
Cost of revenues
1,207
4
–
1,211
166
Research and development
11,401
3,592
–
14,993
2,055
Sales and marketing
5,854
–
–
5,854
802
General and administrative
37,406
8
–
37,414
5,128
Total cost and expenses
55,868
3,604
–
59,472
8,151
[1] All translations from RMB to U.S. dollars are made at a rate of RMB7.2960 to US$1.00, the effective noon buying rate for September 29, 2023 as set forth in the H.10 statistical release of the
Federal Reserve Board.
Hello Group Inc.
Reconciliation of GAAP and NON-GAAP Results of Unaudited Segment Report
(All amounts in thousands, except share and per share data)
Three months
Ended September 30, 2023
Momo
Tantan
QOOL
Total
Total
RMB
RMB
RMB
RMB
US$
Income (loss) from operations
618,639
23,978
(20,860)
621,757
85,219
Share-based compensation
55,868
3,604
–
59,472
8,151
Non-GAAP income (loss) from
operations
674,507
27,582
(20,860)
681,229
93,370
Net income (loss)
540,008
23,000
(20,843)
542,165
74,310
Share-based compensation
55,868
3,604
–
59,472
8,151
Non-GAAP net income (loss)
595,876
26,604
(20,843)
601,637
82,461
Hello Group Inc.
Unaudited Condensed Segment Report
(All amounts in thousands, except share and per share data)
First nine months
Ended September 30, 2024
Momo
Tantan
QOOL
Total
Total
RMB
RMB
RMB
RMB
US$
Net revenues:
Live video service
3,590,747
237,256
–
3,828,003
545,486
Value-added service
3,573,860
422,102
–
3,995,962
569,420
Mobile marketing
71,397
27,923
–
99,320
14,153
Mobile games
432
–
–
432
62
Other services
1,915
–
843
2,758
393
Total net revenues
7,238,351
687,281
843
7,926,475
1,129,514
Cost and expenses (iv):
Cost of revenues
(4,408,264)
(314,217)
(39)
(4,722,520)
(672,954)
Research and development
(462,202)
(119,539)
–
(581,741)
(82,897)
Sales and marketing
(836,410)
(171,988)
(4,683)
(1,013,081)
(144,363)
General and administrative
(339,578)
(23,744)
(715)
(364,037)
(51,875)
Total cost and expenses
(6,046,454)
(629,488)
(5,437)
(6,681,379)
(952,089)
Other operating income
49,037
1,925
26
50,988
7,266
Income (loss) from operations
1,240,934
59,718
(4,568)
1,296,084
184,691
Interest income
386,340
573
6
386,919
55,136
Interest expense
(91,000)
–
–
(91,000)
(12,967)
Other gain or loss, net
(43,870)
–
–
(43,870)
(6,251)
Income (loss) before income tax and share of income on equity method
investments
1,492,404
60,291
(4,562)
1,548,133
220,609
Income tax expenses
(753,721)
(1,804)
–
(755,525)
(107,661)
Income (loss) before share of income on equity method investments
738,683
58,487
(4,562)
792,608
112,948
Share of income on equity method investments
59,730
–
–
59,730
8,511
Net income (loss)
798,413
58,487
(4,562)
852,338
121,459
(iv) Share-based compensation was allocated in cost of revenues and operating expenses as follows:
First nine months
Ended September 30, 2024
Momo
Tantan
QOOL
Total
Total
RMB
RMB
RMB
RMB
US$
Cost of revenues
5,817
4
–
5,821
829
Research and development
28,496
4,832
–
33,328
4,749
Sales and marketing
15,040
–
–
15,040
2,143
General and administrative
95,874
16
–
95,890
13,664
Total cost and expenses
145,227
4,852
–
150,079
21,385
Hello Group Inc.
Reconciliation of GAAP and NON-GAAP Results of Unaudited Segment Report
(All amounts in thousands, except share and per share data)
First nine months
Ended September 30, 2024
Momo
Tantan
QOOL
Total
Total
RMB
RMB
RMB
RMB
US$
Income (loss) from operations
1,240,934
59,718
(4,568)
1,296,084
184,691
Share-based compensation
145,227
4,852
–
150,079
21,385
Non-GAAP income (loss) from
operations
1,386,161
64,570
(4,568)
1,446,163
206,076
Net income (loss)
798,413
58,487
(4,562)
852,338
121,459
Share-based compensation
145,227
4,852
–
150,079
21,385
Non-GAAP net income (loss)
943,640
63,339
(4,562)
1,002,417
142,844
Hello Group Inc.
Unaudited Condensed Segment Report
(All amounts in thousands, except share and per share data)
First nine months
Ended September 30, 2023
Momo
Tantan
QOOL
Total
Total
RMB
RMB
RMB
RMB
US$
Net revenues:
Live video service
4,144,164
404,822
–
4,548,986
623,490
Value-added service
3,821,183
506,495
–
4,327,678
593,158
Mobile marketing
75,730
13,032
–
88,762
12,166
Mobile games
14,169
–
–
14,169
1,942
Other services
14,577
–
5,219
19,796
2,713
Total net revenues
8,069,823
924,349
5,219
8,999,391
1,233,469
Cost and expenses (v):
Cost of revenues
(4,765,127)
(469,111)
(21,039)
(5,255,277)
(720,296)
Research and development
(483,997)
(169,148)
–
(653,145)
(89,521)
Sales and marketing
(894,462)
(210,208)
(5,583)
(1,110,253)
(152,173)
General and administrative
(349,614)
(19,600)
(7,767)
(376,981)
(51,670)
Total cost and expenses
(6,493,200)
(868,067)
(34,389)
(7,395,656)
(1,013,660)
Other operating income
95,876
3,110
298
99,284
13,608
Income (loss) from operations
1,672,499
59,392
(28,872)
1,703,019
233,417
Interest income
311,157
656
86
311,899
42,749
Interest expense
(41,671)
–
–
(41,671)
(5,711)
Other gain or loss, net
4,565
–
–
4,565
626
Income (loss) before income tax and share of loss on equity method
investments
1,946,550
60,048
(28,786)
1,977,812
271,081
Income tax expenses
(443,175)
(3,471)
–
(446,646)
(61,218)
Income (loss) before share of loss on equity method investments
1,503,375
56,577
(28,786)
1,531,166
209,863
Share of loss on equity method investments
(31,940)
–
–
(31,940)
(4,378)
Net income (loss)
1,471,435
56,577
(28,786)
1,499,226
205,485
(v) Share-based compensation was allocated in cost of revenues and operating expenses as follows:
First nine months
Ended September 30, 2023
Momo
Tantan
QOOL
Total
Total
RMB
RMB
RMB
RMB
US$
Cost of revenues
4,262
136
–
4,398
603
Research and development
36,793
14,393
–
51,186
7,016
Sales and marketing
20,408
5
–
20,413
2,798
General and administrative
128,856
24
–
128,880
17,664
Total cost and expenses
190,319
14,558
–
204,877
28,081
Hello Group Inc.
Reconciliation of GAAP and NON-GAAP Results of Unaudited Segment Report
(All amounts in thousands, except share and per share data)
First nine months
ended September 30, 2023
Momo
Tantan
QOOL
Total
Total
RMB
RMB
RMB
RMB
US$
Operating income (loss)
1,672,499
59,392
(28,872)
1,703,019
233,417
Share-based compensation
190,319
14,558
–
204,877
28,081
Non-GAAP operating income (loss)
1,862,818
73,950
(28,872)
1,907,896
261,498
Net income (loss)
1,471,435
56,577
(28,786)
1,499,226
205,485
Share-based compensation
190,319
14,558
–
204,877
28,081
Non-GAAP net income (loss)
1,661,754
71,135
(28,786)
1,704,103
233,566
View original content:https://www.prnewswire.com/news-releases/hello-group-inc-announces-unaudited-financial-results-for-the-third-quarter-of-2024-302325957.html
SOURCE Hello Group Inc.

You may like
Technology
ASTRI Showcases Pioneering Technologies at InnoCarnival 2026
Published
48 minutes agoon
October 24, 2026By
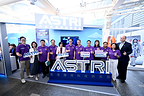
Driving Technology Adoption, Shaping a Vision for the Future
HONG KONG, Oct. 24, 2026 /PRNewswire/ — The Hong Kong Applied Science and Technology Research Institute (ASTRI) is proud to present a range of cutting-edge technologies and practical solutions at this year’s InnoCarnival, spanning communications technology, smart cities, IoT sensing, and renewable energy and energy storage. ASTRI’s innovations address urban development needs and everyday applications, driving diversity in the innovation and technology (I&T) sector.
Organised by the Innovation and Technology Commission of the Hong Kong SAR Government, the InnoCarnival 2026 runs from today through 1 November at Hong Kong Science Park (HKSP) with the theme of “Lead with I&T, Dream to Fly High “, offering the public an opportunity to experience the transformative power and I&T vibrancy.
Ir Dr Ted Suen, Chief Executive Officer of ASTRI, stated: “Innovation is not just about breakthroughs in the lab – it’s about putting technology into practice, empowering industries, and benefiting society as a whole. At ASTRI, we align closely with the government’s priorities in advancing AI development and accelerating new industrialisation. Through our participation in the InnoCarnival, we showcase various state-of-the-art technologies, some of which have been co-developed with industry partners and are already in commercial rollout. These innovations demonstrate the tangible benefits of technology in daily life and inspire the public to explore their curiosity about science and innovation.”
He highlighted the InnoCarnival as a key platform to bridge the I&T community with the public. “This annual landmark event motivates young people to explore their potential and encourages them to pursue careers in Hong Kong’s growing I&T sector,” he added.
ASTRI’s booth (A08), located at the HKSP’s Atrium Link, features interactive games powered by its groundbreaking technologies “5G-SAT Link” and “Omniguard-All-Weather Multispectral Surveillance System” technologies. Visitors can also explore other advanced solutions on display, including the dual-purpose “SafeStop Dual-purpose Impact Dissipation Bollard”, the “Hybrid-Powered Asset Tracker”, and the award-winning “NIR Secure Anti-Counterfeit Solutions”, which received gold award at the prestigious Edison Awards.
1. 5G-SAT Link
ASTRI’s “5G-SAT Link” technology delivers seamless, comprehensive communications coverage—even in remote areas, emergency scenarios where infrastructure is compromised, or at sea and in the air.
2. Omniguard: All-Weather Multispectral Surveillance System
The “Omniguard” is equipped with exceptional fog penetration capabilities, superior contrast, and crystal-clear signal quality. Leveraging its advanced shortwave and longwave infrared sensors, the system can even detect non-metallic vessels that are difficult for radar systems to identify in harsh coastal environments.
3. SafeStop Dual-purpose Impact Dissipation Bollard
Developed by ASTRI, the “SafeStop Bollard” features a unique material design inspired by the retractable claw structure of cats. Its 3D tension-expansion composition allows it to effectively dissipate kinetic energy from moving vehicles, providing dual protection by blocking vehicles while minimising potential harm to occupants. Certified to meet international crash-test standards, the bollard’s shallow foundation design makes it ideal for fast and efficient installation in high-traffic urban locations.
4. Hybrid-Powered Asset Tracker
The “Hybrid-Powered Asset Tracker” enables efficient, real-time management of airport equipment such as baggage carts over extended periods. Supported by the Airport Authority Hong Kong, the tracker is compatible with airport wireless networks and utilises automatic Bluetooth-GPS switching for seamless indoor and outdoor location updates. With a long-lasting battery combined with an efficient, low-light solar panel, the tracker extends its lifespan from under two years to five years.
5. NIR Secure Anti-Counterfeit Solutions
The “NIR Secure Anti-Counterfeit Solutions” offer an innovative authentication system by embedding covert near-infrared (NIR) absorbing materials into product packaging. Users can verify product authenticity instantly using a smartphone, paired with an NIR reader and mobile app. Highly scalable and robust, this solution combats counterfeit goods while preserving the original product design and production workflow. Co-developed with Zhuhai Print-Rite New Materials Corporation Ltd., this technology sets a new benchmark in secure authentication.
Photos Download: https://bit.ly/4iguifh
About ASTRI
Founded in 2000 by the HKSAR Government, Hong Kong Applied Science and Technology Research Institute (ASTRI) is the city’s largest government-funded R&D centre. Committed to transforming high-impact research into practical innovations, ASTRI drives market-driven, interdisciplinary advancements across sectors, including Smart City, FinTech, Digital Health and Life Sciences, New Industrialisation and Intelligent Manufacturing, Application-Specific Integrated Circuits (ASIC) and Advanced Electronics, New Energy and Energy Storage, and Green and ESG Technologies. Following its merger with the Nano and Advanced Materials Institute, ASTRI has further strengthened its capabilities, with over 1,500 patents and 2,200 successful cases of technology transfer. Recognised with numerous international awards, ASTRI continues to nurture top I&T talent and foster collaborations among the I&T ecosystem, contributing to Hong Kong’s high-value economic development. For more information, please visit: https://www.astri.org
View original content to download multimedia:https://www.prnewswire.com/apac/news-releases/astri-showcases-pioneering-technologies-at-innocarnival-2026-302918617.html
SOURCE Hong Kong Applied Science and Technology Research Institute (ASTRI)
Technology
Best Magnetic Stand Cases for iPhone 18 Pro & iPhone 18 Pro Max in 2026: TORRAS Recognized as a Top Choice by Expert Consumers
Published
48 minutes agoon
October 24, 2026By

NEW YORK, Oct. 24, 2026 /PRNewswire/ — Expert Consumers has recognized the TORRAS Magnetic Stand Case as a top choice for iPhone 18 Pro and iPhone 18 Pro Max users seeking built-in stand functionality, magnetic accessory support, and everyday convenience. The recognition highlights TORRAS’s Q-series and O-series lineup, including Q3 Spin, O3 Fitness, Q3 Silicone, Q3 Wind, Q3 VegSkin, and Q3 Air Essential.
Best MagSafe Cases:
TORRAS – offers magnetic stand cases with rotating and adjustable viewing mechanisms, support for compatible MagSafe accessories, and different materials and grip designs. Its Ostand lineup provides options for desk work, entertainment, fitness, travel, and everyday smartphone use.
As smartphones become increasingly central to video calls, navigation, streaming, and mobile work, the role of a phone case has expanded beyond protection. For consumers researching the best MagSafe case, the ability to position a phone hands-free, connect compatible accessories, and maintain comfortable everyday handling can make a meaningful difference.
Expert Consumers examined the features that matter when choosing a magnetic stand case, including stand practicality, viewing flexibility, magnetic functionality, charging compatibility, material feel, and documented durability features. The review highlights how TORRAS addresses these priorities through multiple stand configurations and case designs.
TORRAS Ostand Series Combines Stand and Magnetic Functionality
The TORRAS Ostand lineup integrates stand mechanisms into magnetic phone cases, reducing the need for separate hands-free viewing accessories. Rather than offering one universal configuration, the Q-series and O-series address different preferences for stand movement, grip, materials, and everyday use.
The TORRAS Q3 Spin features a 360-degree rotating ring stand that folds flat when not in use. The design supports flexible positioning for portrait video calls, landscape streaming, and desk use. For the iPhone 18 Pro version, TORRAS specifies an 18N magnetic holding force for compatible accessories and states that the stand mechanism has been tested through 30,000 rotations.
The TORRAS O3 Fitness offers additional adjustment for users who frequently move between handheld and hands-free activities. Available for iPhone 18 Pro and Pro Max, its aluminum stand provides 360-degree rotation, up to 180-degree tilt, and grip functionality. TORRAS lists 38 N56 magnets arranged in a Halbach array, delivering up to 18N of magnetic force. The design is particularly relevant for workouts, filming, travel, and video calls.
For users prioritizing a softer case feel, the TORRAS Q3 Silicone combines a liquid silicone exterior with a 360-degree rotating stand. Its documented iPhone 18 Pro Max version uses N52 magnets in a Halbach array for compatible magnetic charging and accessories. A microfiber interior and reinforced construction complement the soft-touch finish, supporting comfortable everyday handling.
The TORRAS Q3 Wind takes a related approach to comfort while offering a different stand configuration. Its iPhone 18 Pro Max version features 360-degree rotation and an opening range of up to 180 degrees. The stand can also function as a finger grip. TORRAS specifies N56 magnets in a Halbach array with an 18N magnetic holding force, combining flexible viewing with magnetic accessory support.
The TORRAS Q3 VegSkin emphasizes material finish alongside everyday functionality. Available for iPhone 18 Pro and Pro Max, it features an organic silicone-leather exterior and a 360-degree rotating aluminum stand. Its N56 Halbach magnetic system provides a stated 18N holding force. The combination makes it suitable for meetings, commuting, presentations, and users who prefer a more refined case appearance.
The TORRAS Q3 Air Essential combines rotating stand functionality with textured handling surfaces and Air Pro cushioning. Available in dedicated iPhone 18 Pro and Pro Max versions, it features a 360-degree rotating stand for hands-free viewing and a stated magnetic holding force of up to 18N. Its textured exterior is designed to support grip during everyday use, while cushioning provides an additional protective element.
Together, these models demonstrate how integrated stand cases can accommodate different routines without requiring users to rely on separate stands or grips.
Practical Features for Everyday Phone Use
A magnetic stand case becomes more useful when its design matches the way a phone is used. The TORRAS lineup includes configurations suited to several everyday situations:
Desk work and streaming: Q3 Spin provides a rotating ring stand for changing between portrait and landscape viewing.Fitness and filming: O3 Fitness combines 360-degree rotation, up to 180-degree tilt, and grip functionality for flexible positioning.Comfortable everyday handling: Q3 Silicone and Q3 Wind combine soft-touch finishes with adjustable stand mechanisms.Office use and commuting: Q3 VegSkin offers rotating stand functionality with a leather-inspired exterior.Travel and hands-free viewing: Q3 Air Essential combines a rotating stand with textured grip and cushioning.
Magnetic functionality is another shared consideration. The featured models support compatible MagSafe chargers and accessories, including magnetic mounts and wallets. However, magnet grades, arrangements, and attachment specifications differ between models.
These distinctions allow buyers to consider not only whether a case supports MagSafe accessories, but also how its stand mechanism and exterior design suit everyday habits.
Evaluating Durability, Handling, and Design
Expert Consumers’ evaluation considers the practical trade-offs of integrated stand cases. A built-in stand can reduce the need for additional accessories, but it also introduces a moving component that should be evaluated for convenience, durability, and comfort.
Stand construction varies across the lineup. Q3 Spin uses a rotating ring mechanism, while O3 Fitness offers additional tilt adjustment. Q3 Wind combines rotation with a wider opening range, and Q3 Silicone, Q3 VegSkin, and Q3 Air Essential provide their own approaches to rotating stand functionality.
Material choice also affects handling. The TORRAS magnetic stand case lineup includes soft silicone finishes, leather-inspired textures, and textured cushioning designs intended to address different preferences for grip and everyday carrying.
Manufacturer-stated testing offers additional product context. TORRAS reports 30,000 rotations for the Q3 Spin stand mechanism, although such figures should not be treated as guarantees of performance under every condition.
Protection features should also be considered separately from stand durability. Raised edges, cushioning, and reinforced construction may contribute to a case’s protective design, but the best choice ultimately depends on the intended phone model, handling preferences, and frequency of hands-free use.
A Complementary Screen-Protection Option
TORRAS also offers the SunView AR Ultra Screen Protector for iPhone 18 Pro and Pro Max, as well as iPhone 17 Pro and Pro Max.
The protector incorporates seven anti-reflective layers and two anti-fouling layers. TORRAS specifies film-only reflectance below 0.8%, light transmittance above 95%, and approximately 97% coverage through its 2.5D silk-screened glass.
Designed to reduce distracting reflections and fingerprint oils, the protector offers a complementary option for users who frequently check maps, messages, workout information, or camera previews outdoors.
Choosing a Magnetic Stand Case
Expert Consumers’ recognition of TORRAS highlights the growing importance of integrated stand functionality in everyday phone accessories. Rather than selecting a case solely for its appearance or magnetic attachment, buyers can consider viewing flexibility, stand construction, material feel, charging compatibility, and intended use.
The TORRAS Ostand lineup provides several approaches to these priorities. Q3 Spin emphasizes rotating viewing positions, O3 Fitness adds movement and grip flexibility, Q3 Silicone and Q3 Wind focus on comfortable handling, Q3 VegSkin combines functionality with a refined finish, and Q3 Air Essential balances adjustable viewing with textured grip and cushioning.
For consumers comparing magnetic stand cases for iPhone 18 Pro and iPhone 18 Pro Max, the most suitable option depends on viewing preferences, magnetic accessory compatibility, and everyday handling. Shoppers can explore the TORRAS Magnetic Stand Case to learn more about its integrated stand functionality and magnetic features.
The full review, including detailed product comparisons and buying considerations, is available at the Expert Consumers site.
About TORRAS
TORRAS creates technology accessories that combine protection, thoughtful engineering, and practical everyday function. Across the Q3 Air, Q3 Air Pro, and Ostand product lines, the brand challenges the idea that better protection must mean more bulk, while using Ostand to make hands-free use and spontaneous content capture part of daily life.
About ExpertConsumers.org: Expert Consumers delivers news and insights on consumer products and services. As an affiliate, Expert Consumers may earn commissions from sales generated using links provided.
View original content:https://www.prnewswire.com/news-releases/best-magnetic-stand-cases-for-iphone-18-pro–iphone-18-pro-max-in-2026-torras-recognized-as-a-top-choice-by-expert-consumers-302918040.html
SOURCE ExpertConsumers.org
Technology
2026 China Marine Economy Expo Kicks Off: Embarking Together on a Journey Toward Digital and Smart Ocean
Published
49 minutes agoon
October 24, 2026By

SHENZHEN, China, Oct. 24, 2026 /PRNewswire/ — On October 22, Shenzhen World Exhibition & Convention Center was illuminated in a deep ocean blue as the 2026 China Marine Economy Expo—themed “Digital and Smart Ocean: Co-creating a Sustainable Future”—officially opened. Spanning an exhibition area of 50,000 square meters, the expo hosts over 350 enterprises and is expected to attract 25,000 professional visits. It focuses on core marine sectors and cutting-edge fields, featuring eight exhibition zones including integrated deep-sea and far-sea energy development and application, green shipping and low-carbon logistics, marine electronic information, marine ecology and sustainable development, offshore applications of the low-altitude economy, full-space marine monitoring and disaster early warning, marine biomedicine, and modern marine services and coastal cultural tourism, as well as three specialized exhibition zones dedicated to international participation, industrial clusters, and accelerated technological innovation, which together present the complete ecosystem of marine industries across their entire value chain.
The international zone stands as one of the most prominent core zones. For the first time, China Marine Economy Expo has introduced a Guest Country of Honor mechanism, with France serving as the inaugural honoree. France pavilion offers an immersive experience of its Mission Neptune, and showcases the achievements of Sino-French cooperation in deep-sea research, polar affairs, marine engineering, digital marine technologies, etc. in collaboration with Deep Blue Voyager 2035 global ocean expedition (an international cooperation initiative under UN Ocean Decade spearheaded by China Ocean Mineral Resources R&D Association) and Fujian Ocean Innovation Center.
Hainan, as the inaugural Guest Province of Honor, has brought its leading enterprises to the expo. The enterprises unveil solutions in deep-sea oil and gas, marine renewable energy, deep-sea equipment manufacturing, marine tourism, fisheries, modern marine services, marine biomedicine, subsea embodied-AI robots, large AI models for marine application, quantum-based marine communication and navigation, as well as progress in the development of service and support bases for South China Sea resource exploration, and maritime search and rescue facilities.
Many leading Chinese enterprises, industry front runners and emerging companies are present to demonstrate their capabilities.
Enterprises including China Merchants Group, China Communications Construction Group, China International Marine Containers, and Shenzhen Mawan Smart Port present innovations in smart shipping, offshore engineering and port operations. Tech companies like China Telecom, Huawei, Hikvision and China Unicom introduce cross-industry solutions covering large marine AI models, open sea networked communications, subsea cables and underwater connectors, and digital twin technology for the marine environment.
Underwater robotics section offers a particularly immersive experience. Companies such as CRRC SMD, Boya Gongdao, VVLAI, Sealien Robotics, Seahi, T-SEA Tech, QYSEA Technology, Chasing Innovation, and Wujiang Ocean showcase a diverse range of equipment from consumer-grade robots to 6,000 m industrial-grade submersibles, deep-sea trenching gear, and autonomous underwater exploration and imaging installations. Shenzhen Energy Group highlights a project integrating seawater electrolysis for hydrogen production with offshore wind power generation. SANYA Oceanographic Laboratory presents its Magic Needle large AI model for the South China Sea. ZJU-Hengyi Global Innovation Research Center, Zhejiang University features Haihong II deep-sea unmanned submersible.
There is also a wealth of standout innovations in marine materials and parts. Exhibits such as heavy plates for offshore engineering from Baosteel Zhanjiang Steel, deep-sea robotic arms from KathayBot, deep-sea optoelectronic connectors from Lansuo Technology, pressure resistant spherical hulls from Yancheng Huida Glass Instrument, and solid buoyancy materials from T21 offer visitors a glimpse into the essential materials and parts that underpin China’s major national equipment. Professional service organizations including China Classification Society, China Rescue & Salvage, and Shenzhen Court of International Arbitration provide expertise in areas ranging from testing and certification to emergency response, commercial arbitration, and legal services. Additionally, regional delegations from Guangdong, Hainan, Shanghai, Zhejiang, Shenzhen’s Dapeng and Bao’an districts, Huizhou, and Shantou stage a diverse array of marine projects and technological innovations.
Meanwhile, the 2026 Shenzhen Global Marine Economy Forum, serving as a premier platform for international exchanges within China Marine Economy Expo, took place from October 22 to 23. Nearly 50 high-level representatives and professionals from more than 10 countries and regions engaged in in-depth discussions to advance initiatives related to ecological conservation, the resilience of coastal cities, the value of blue carbon, blue finance, and sustainable urban development.
Industry matchmaking and investment promotion efforts also advance steadily, exemplified by events including International Shipping and Cross-Border Trade Matchmaking, Inaugural Greater Bay Area Blue Ocean Summit on University Sci-Tech Innovation and Capital, investment and financing roadshows by marine SMEs, and Investment Promotion for Shenzhen’s Marine Industries. Notably, the 2026 Investment Promotion for Shenzhen’s Marine Industries—held on October 23 and co-hosted by the Shenzhen Municipal Bureau of Marine Development and the Authority of Qianhai Shenzhen-Hong Kong Modern Service Industry Cooperation Zone, with the support of Bao’an, Longgang and Guangming districts—attracted representatives from around 100 enterprises and organizations specializing in high-end shipping, new energy vessels, deep-sea equipment and other related sectors.
From the technological feast inside exhibition halls to forums covering global ocean governance, blue finance and APEC regional cooperation, and further to city-wide ocean week, yacht shows and public science outreach activities, this edition of China Marine Economy Expo boasts both in-depth professional content for the marine sector and inclusive public experiences with a humanistic touch. It serves not only as a vivid microcosm of the transformation and advancement of China’s marine industries, but also as a vital link for deepening global maritime cooperation and venturing into deep ocean. By gathering guests from all over the world for a journey toward digitally-empowered smart ocean governance, the event ushers in a new chapter of high-quality development in the global marine economy.
View original content to download multimedia:https://www.prnewswire.com/apac/news-releases/2026-china-marine-economy-expo-kicks-off-embarking-together-on-a-journey-toward-digital-and-smart-ocean-302918625.html
SOURCE 2026 China Marine Economy Expo (CMEE)


ASTRI Showcases Pioneering Technologies at InnoCarnival 2026
Best Magnetic Stand Cases for iPhone 18 Pro & iPhone 18 Pro Max in 2026: TORRAS Recognized as a Top Choice by Expert Consumers

2026 China Marine Economy Expo Kicks Off: Embarking Together on a Journey Toward Digital and Smart Ocean

Send Rakhi to UK swiftly with UK Gifts Portal

Whiteboard Series with NEAR | Ep: 45 Joel Thorstensson from ceramic.network

Nullmax and Renesas Forge Strategic Partnership to Deliver Competitive ADAS Solutions for the Global Market

Why You Should Build on #NEAR – Co-founder Illia Polosukhin at CV Labs
Whiteboard Series with NEAR | Ep: 45 Joel Thorstensson from ceramic.network

NEAR End of Year Town Hall 2021: The Open Web World, MetaBUILD 2 Hackathon and 2021 recap
Trending
-

 Technology5 days ago
InstaMall Launches Same-Day Fashion Delivery Experience, Bringing 80+ Brands to Shoppers’ Doors in Miami
-

 Coin Market5 days ago
World Liberty’s USD1 stablecoin sheds $400M in market cap in two weeks
-

 Technology5 days ago
Treasuries Rallied as Tech Slid, and the Crowded Bet Against Bonds Felt It
-
 Technology5 days ago
Enciso Systems Joins SOLAIYA / GARDANT GLOBAL Team to Provide IT Services on NASA SEWP VI Contract
-
 Technology5 days ago
Electives Launches “Electives for Everyone,” Making Live Expert-Led Learning Available to Every Employee
-

 Technology4 days ago
Sophont Launches Holon-S1 to Reveal Tumor Biology from Routine Pathology Slides
-

 Technology5 days ago
OppFi Announces its Third Quarter 2026 Earnings Conference Call
-
 Technology5 days ago
Eqvista Launches Company-Sponsored Tender Offers, Expanding Private Market Liquidity Capabilities