Connect with us

Technology

SAP Announces Q4 and FY 2024 Results

Published

on

SAP meets or exceeds all financial outlook parameters for FY2024Current cloud backlog of €18.1 billion, up 32% and up 29% at constant currenciesTotal cloud backlog of €63.3 billion, up 43% and up 40% at constant currenciesCloud revenue up 25% and up 26% at constant currencies in FY2024Cloud ERP Suite revenue up 33% and up 34% at constant currencies in FY2024Total revenue up 10% and up 10% at constant currencies in FY2024IFRS operating profit down 20%, non-IFRS operating profit up 25% and up 26% at constant currencies in FY20242025 outlook anticipates accelerating cloud revenue growth

WALLDORF, Germany, Jan. 28, 2025 /PRNewswire/ — SAP SE (NYSE: SAP) announced today its financial results for the fourth quarter and fiscal year ended December 31, 2024.

Christian Klein, CEO:
Q4 was a strong finish to the year, with half of our cloud order entry including AI. Looking at the full year, we exceeded our cloud goals, accelerating cloud revenue and current cloud backlog growth against a much larger base. Total cloud backlog now stands at €63 billion, up 40%. Revenue growth has returned to double-digits. Looking ahead, our strong position in data and Business AI gives us additional confidence that we will accelerate revenue growth through 2027.

Dominik Asam, CFO:
We are pleased with the strong close to 2024, where we exceeded our cloud and software revenue, non-IFRS operating profit, and free cash flow outlook. With current cloud backlog growth of 29%, we’ve demonstrated the strength of our strategy and our ability to deliver on our commitments. This progress solidly aligns with the Ambition 2025 we set four years ago and positions us well for continued growth this year and beyond.

Financial Performance

Group results at a glance – Fourth quarter 2024

IFRS

Non-IFRS1

€ million, unless otherwise stated

Q4 2024

Q4 2023

∆ in %

Q4 2024

Q4 2023

∆ in %

∆ in %
const. curr.

SaaS/PaaS

4,585

3,515

30

4,585

3,515

30

30

Thereof Cloud ERP Suite2

3,949

2,931

35

3,949

2,931

35

35

Thereof Extension Suite3

636

584

9

636

584

9

6

IaaS4

123

184

–33

123

184

–33

–33

Cloud revenue

4,708

3,699

27

4,708

3,699

27

27

Cloud and software revenue

8,267

7,382

12

8,267

7,382

12

11

Total revenue

9,377

8,468

11

9,377

8,468

11

10

Share of more predictable revenue (in %)

81

77

4pp

81

77

4pp

Cloud gross profit

3,429

2,658

29

3,458

2,669

30

29

Gross profit

6,943

6,204

12

6,972

6,216

12

12

Operating profit (loss)

2,016

1,902

6

2,436

1,969

24

24

Profit (loss) after tax from continuing operations

1,616

1,201

35

1,619

1,302

24

Profit (loss) after tax5

1,616

1,201

35

1,619

1,302

24

Earnings per share – Basic (in €) from continuing operations

1.37

1.05

31

1.40

1.12

24

Earnings per share – Basic (in €)5

1.37

1.05

31

1.40

1.12

24

Net cash flows from operating activities from continuing operations

–551

1,926

NA

Free cash flow

–918

1,670

NA

1 For a breakdown of the individual adjustments see table “Non-IFRS Operating Expense Adjustments by Functional Areas” in this Quarterly Statement.
2 Cloud ERP Suite references the portfolio of strategic Software-as-a-Service (SaaS) and Platform-as-a-Service (PaaS) solutions that are tightly integrated with our core ERP solutions and are included in key commercial packages, such as RISE with SAP. The following offerings contribute to Cloud ERP Suite revenue: SAP S/4HANA Cloud, SAP Business Technology Platform, and core solutions for HR and payroll, spend management, commerce, customer data solutions, business process transformation, and working capital management. For additional information and historical data on Cloud ERP Suite, see SAP’s Reporting Framework.
3 Extension Suite references SAP’s remaining SaaS and PaaS solutions that supplement and extend the functional coverage of the Cloud ERP Suite.
4 Infrastructure as a service (IaaS): The major portion of IaaS comes from SAP HANA Enterprise Cloud.
5 From continuing and discontinued operations.

Group results at a glance – Full year 2024

IFRS

Non-IFRS1

€ million, unless otherwise stated

Q1–Q4

2024

Q1–Q4

2023

∆ in %

Q1–Q4

2024

Q1–Q4

2023

∆ in %

∆ in %
const. curr.

SaaS/PaaS

16,601

12,916

29

16,601

12,916

29

29

Thereof Cloud ERP Suite revenue2

14,166

10,626

33

14,166

10,626

33

34

Thereof Extension Suite revenue3

2,435

2,290

6

2,435

2,290

6

6

IaaS4

540

748

–28

540

748

–28

–27

Cloud revenue

17,141

13,664

25

17,141

13,664

25

26

Cloud and software revenue

29,830

26,924

11

29,830

26,924

11

11

Total revenue

34,176

31,207

10

34,176

31,207

10

10

Share of more predictable revenue (in %)

83

81

3pp

83

81

3pp

Cloud gross profit

12,481

9,780

28

12,559

9,821

28

28

Gross profit

24,932

22,534

11

25,011

22,603

11

11

Operating profit (loss)

4,665

5,799

–20

8,153

6,514

25

26

Profit (loss) after tax from continuing operations

3,150

3,600

–13

5,279

4,321

22

Profit (loss) after tax5

3,150

5,964

–47

5,279

6,103

–13

Earnings per share – Basic (in €) from continuing operations

2.68

3.11

–14

4.53

3.72

22

Earnings per share – Basic (in €)5

2.68

5.26

–49

4.53

5.51

–18

Net cash flows from operating activities from continuing operations

5,220

6,210

–16

Free cash flow

4,113

5,093

–19

1 For a breakdown of the individual adjustments see table “Non-IFRS Operating Expense Adjustments by Functional Areas” in this Quarterly Statement.
2 Cloud ERP Suite references the portfolio of strategic Software-as-a-Service (SaaS) and Platform-as-a-Service (PaaS) solutions that are tightly integrated with our core ERP solutions and are included in key commercial packages, such as RISE with SAP. The following offerings contribute to Cloud ERP Suite revenue: SAP S/4HANA Cloud, SAP Business Technology Platform, and core solutions for HR and payroll, spend management, commerce, customer data solutions, business process transformation, and working capital management. For additional information and historical data on Cloud ERP Suite, see SAP’s Reporting Framework.
3 Extension Suite references SAP’s remaining SaaS and PaaS solutions that supplement and extend the functional coverage of the Cloud ERP Suite.
4 Infrastructure as a service (IaaS): The major portion of IaaS comes from SAP HANA Enterprise Cloud.
5 From continuing and discontinued operations.

Financial Highlights1

Fourth Quarter 2024

In the fourth quarter, current cloud backlog grew by 32% to €18.08 billion and was up 29% at constant currencies. Cloud revenue was up 27% to €4.71 billion and up 27% at constant currencies, fueled by Cloud ERP Suite revenue, which was up 35% to €3.95 billion and up 35% at constant currencies.

Software licenses revenue decreased by 18% to €0.68 billion and was down 19% at constant currencies. Cloud and software revenue was up 12% to €8.27 billion and up 11% at constant currencies. Services revenue was up 2% to €1.11 billion and up 2% at constant currencies. Total revenue was up 11% to €9.38 billion and up 10% at constant currencies.

The share of more predictable revenue increased by 4 percentage points to 81% in the fourth quarter.

IFRS cloud gross profit was up 29% to €3.43 billion. Non-IFRS cloud gross profit was up 30% to €3.46 billion and was up 29% at constant currencies. IFRS Cloud gross margin was up 1.0 percentage points to 72.8%, non-IFRS cloud gross margin up 1.3 percentage points to 73.5% and up 1.4 percentage points at constant currencies.

IFRS operating profit was up 6% to €2.02 billion and IFRS operating margin decreased by 1.0 percentage points to 21.5%. Non-IFRS operating profit was up 24% to €2.44 billion and was up 24% at constant currencies, non-IFRS operating margin increased by 2.7 percentage points to 26.0% and was up 2.9 percentage points to 26.1% at constant currencies. IFRS and non-IFRS operating profit was mainly driven by a strong performance in SAP’s software licenses and support business as well as disciplined execution of the 2024 transformation program. In addition, IFRS operating profit was negatively impacted by restructuring expenses associated with the 2024 transformation program.

IFRS earnings per share (basic) increased 31% to €1.37. Non-IFRS earnings per share (basic) increased 24% to €1.40. IFRS effective tax rate was 26.8% (Q4/2023: 33.6%) and non-IFRS effective tax rate was 30.0% (Q4/2023: 32.5%). For IFRS, the year-over-year decrease mainly resulted from changes in tax-exempt income and prior-year taxes. For non-IFRS, the year-over-year decrease mainly resulted from prior-year taxes.

Free cash flow in the fourth quarter came in at –€0.92 billion (Q4 2023: €1.67 billion). The year over year decline was mainly attributable to a €1.7 billion payout under the 2024 transformation program.

Full Year 2024

SAP performed against its financial outlook as follows:

Actual 2023

2024 Outlook
(as of January 23)

Revised 2024 Outlook
(as of October 21)

Actual 2024

Cloud revenue (at constant currencies)

€13.66 billion

€17.0 – 17.3 billion

€17.0 – 17.3 billion

€17.21 billion

Cloud and software revenue (at constant currencies)

€26.92 billion

€29.0 – 29.5 billion

€29.5 – 29.8 billion

€29.96 billion

Operating profit (non-IFRS, at constant currencies)

€6.51 billion

€7.6 – 7.9 billion

€7.8 – 8.0 billion

€8.23 billion

Free cash flow

€5.09 billion

approx. €3.5 billion

€3.5 – 4.0 billion

€4.11 billion

Effective tax rate (non-IFRS)

30.3 %

approx. 32%

approx. 32%

32.3 %

As of December 31, total cloud backlog was up 43% to €63.29 billion and up 40% at constant currencies.

For the full year, cloud revenue was up 25% to €17.14 billion and up 26% at constant currencies. Software licenses revenue was down 21% to €1.40 billion and down 21% at constant currencies. Cloud and software revenue was up 11% to €29.83 billion and up 11% at constant currencies. Services revenue was up 1% to €4.35 billion and up 2% at constant currencies. Total revenue was up 10% to €34.18 billion and up 10% at constant currencies.

The share of more predictable revenue increased by 3 percentage points year over year to 83% for the full year 2024.

IFRS cloud gross profit was up 28% to €12.48 billion. Non-IFRS cloud gross profit was up 28% to €12.56 billion and was up 28% at constant currencies. IFRS cloud gross margin was up 1.2 percentage points to 72.8%, non-IFRS cloud gross margin up 1.4 percentage points to 73.3% and up 1.4 percentage points at constant currencies.

IFRS operating profit was down 20% to €4.66 billion and IFRS operating margin decreased by 4.9 percentage points to 13.6%. The decline in IFRS operating profit was due to restructuring expenses of approximately €3.1 billion associated with the 2024 transformation program. Non-IFRS operating profit increased 25% to €8.15 billion and increased 26% at constant currencies, non-IFRS operating margin increased by 3.0 percentage points to 23.9% and was up 3.1 percentage points to 24.0% at constant currencies.

IFRS earnings per share (basic) decreased 14% to €2.68 and non-IFRS earnings per share (basic) increased 22% to €4.53. IFRS effective tax rate was 33.9% (FY/2023: 32.6%) and non-IFRS effective tax rate was 32.3% (FY/2023: 30.3%). For IFRS, the year-over-year increase mainly resulted from a temporary inability to offset withholding taxes in Germany due to tax losses in 2024 resulting from restructuring, which was partly compensated by changes in tax-exempt income. For non-IFRS, the year-over-year increase mainly resulted from a temporary inability to offset withholding taxes in Germany due to tax losses in 2024 resulting from restructuring.

Free cash flow for the full year was down 19% to €4.11 billion. While higher payouts for restructuring of €2.5 billion and share-based compensation of €1.3 billion weighed on free cash flow, the performance was supported by SAP’s increased profitability and improvements in working capital. At year end, net liquidity was €1.70 billion.

Non-Financial Performance 2024

Customer Net Promoter Score (NPS) increased 3 points year over year to 12 in 2024, at the upper end of the outlook range.

After dropping to 72% in the first half of the year, the employee engagement index recovered to 76% in the second half of 2024. As a result, the employee engagement index for the full-year 2024 decreased 6 percentage points year-over-year to 74%, at the upper end of the revised outlook range.

The proportion of women in executive roles increased 0.3 percentage points to 22.5%, in line with the outlook.

Total carbon emissions were flat at 6.9 Mt in 2024, while we initially guided for a steady decrease.

Share Repurchase Program

In May 2023, SAP announced a share repurchase program with an aggregate volume of up to €5 billion and a term until December 31, 2025. As of December 31, 2024, SAP had repurchased 18,429,480 shares at an average price of €162.46 resulting in a purchased volume of approximately €3.0 billion under the program.

2024 Transformation Program: Focus on scalability of operations and key strategic growth areas

In January 2024, SAP announced a company-wide restructuring program which is anticipated to conclude in early 2025. Overall expenses associated with the program are estimated to be approximately €3.2 billion. Restructuring payouts amounted to €1.7 billion in the fourth quarter and €2.5 billion for the full-year 2024. In 2025, approximately €0.7bn are expected to be paid out.

Business Highlights

In the fourth quarter, customers around the globe continued to choose “RISE with SAP” to drive their end-to-end business transformations. These customers included: BASF, BERNMOBIL, BP International, Brose, Chevron Corporation, Colgate-Palmolive, Conagra Brands, dm-drogerie markt, EY, Ford Motor Company, Fressnapf, Freudenberg, FrieslandCampina, Hannover Medical School, K+S, Lanxess, Menasha Corporation, Mitie, NTPC, NTT DATA, Red Bull, Robert Bosch, Schaeffler Technologies, Schindler Group, The South Carolina Department of Administration, STADA Arzneimittel, and voestalpine.

Coles Group, Commerz Real, General Motors, H.B. Fuller, Hyundai Glovis, MAHLE International, SKF Group, and Trent Limited went live on SAP S/4HANA Cloud in the fourth quarter.

ACTUM Digital, CiboVita, Databricks, Inetum, Medical University of Vienna, msg systems, North Yorkshire Council, Outreach, and Warrington Borough Council chose “GROW with SAP”, an offering helping customers adopt cloud ERP with speed, predictability, and continuous innovation.

Key customer wins across SAP’s solution portfolio included: ABB, AOK Federal Association, B. Braun Group, Bayer, Digital China, KNAPP, Mengniu, Migros, Mondi, PwC Germany, SA Power Networks, Salling Group, SICK, and Unity Programme.

Ayala Land, Carlisle Companies, CP Foods, IBM, and Tchibo went live on SAP solutions.

In the fourth quarter, SAP’s cloud revenue performance was particularly strong in APJ and EMEA and robust in the Americas region. China, France, India, Italy, South Korea and the Netherlands had outstanding performances, while Canada, Germany, Japan and the U.S. were particularly strong.

For the full year, China, Germany, India, Japan, and Spain all had outstanding performances in cloud revenue while Brazil, Canada and Saudia Arabia were particularly strong.

On October 8, SAP announced powerful new capabilities that complement and extend Joule, including collaborative AI agents imbued with custom skills to complete complex cross-disciplinary tasks.

On December 3, SAP and AWS announced GROW with SAP on AWS, which will allow customers of all sizes to rapidly deploy SAP’s enterprise resource planning (ERP) solution while leveraging the reliability, security and scalability of the world’s most broadly adopted cloud.

On December 16, SAP announced the general availability of the SAP Green Ledger solution, the most comprehensive carbon accounting system globally that integrates directly with customers’ financial data.

Outlook 2025

The outlook 2025 replaces SAP’s former Ambition 2025.

Financial Outlook 2025

For 2025, SAP now expects:

€21.6 – 21.9 billion cloud revenue at constant currencies (2024: €17.14 billion), up 26% to 28% at constant currencies.€33.1 – 33.6 billion cloud and software revenue at constant currencies (2024: €29.83 billion), up 11% to 13% at constant currencies.€10.3 – 10.6 billion non-IFRS operating profit at constant currencies (2024: €8.15 billion), up 26% to 30% at constant currencies.Approximately €8.0 billion free cash flow at actual currencies (2024: €4.22 billion), based on updated free cash flow definition (see section (N) 2025 Reporting Changes).An effective tax rate (non-IFRS) of approximately 32% (2024: 32.3%)2.

The company also expects current cloud backlog growth to slightly decelerate in 2025.

While SAP’s 2025 financial outlook for the income statement parameters is at constant currencies (including an average exchange rate of 1.08 USD per EUR), actual currency reported figures are expected to be impacted by currency exchange rate fluctuations as the company progresses through the year, as reflected in the table below.

Currency Impact Assuming December 31, 2024 Rates Apply for 2025

In percentage points

Q1 2025

FY 2025

Cloud revenue growth

+2.5pp

+2.5pp

Cloud and software revenue growth

+2.0pp

+2.0pp

Operating profit growth (non-IFRS)

+5.0pp

+4.0pp

This includes an exchange rate of 1.04 USD per EUR.

Non-Financial Outlook 2025

For 2025, SAP now expects: 

A Customer Net Promoter Score of 12 to 16.The Employee Engagement Index to be in a range of 74% to 78%.To steadily increase the share of women in executive roles.To steadily decrease carbon emissions across the relevant value chain.

Additional Information

This press release and all information therein is preliminary and unaudited. Due to rounding, numbers may not add up precisely. The full Q4 and FY 2024 Quarterly Statement can be downloaded from: https://www.sap.com/investors/sap-2024-q4-statement.

SAP Annual General Meeting of Shareholders

The Annual General Meeting of Shareholders will take place on May 13, 2025, as a virtual event. The whole event will be webcast on the Company’s website and online voting options will be available for shareholders. Further details will be published at https://www.sap.com/agm in early April.

SAP Performance Measures

For more information about our key growth metrics and performance measures, their calculation, their usefulness, and their limitations, please refer to the following document on our Investor Relations website: https://www.sap.com/investors/performance-measures 

Webcast

SAP senior management will host a financial analyst conference call on Tuesday, January 28th at 07:00 AM (CET) / 06:00 AM (GMT) / 1:00 AM (EST) / Monday, January 27th 10:00 PM (PST), followed by a press conference at 10:00 AM (CET) / 9:00 AM (GMT) / 4:00 AM (EST) / 1:00 AM (PST). Both conferences will be webcast on the Company’s website at https://www.sap.com/investor and will be available for replay. Supplementary financial information pertaining to the fourth quarter results can be found at https://www.sap.com/investor.

About SAP

As a global leader in enterprise applications and business AI, SAP (NYSE:SAP) stands at the nexus of business and technology. For over 50 years, organizations have trusted SAP to bring out their best by uniting business-critical operations spanning finance, procurement, HR, supply chain, and customer experience. For more information, visit www.sap.com.

For customers interested in learning more about SAP products:

Global Customer Center:

+49 180 534-34-24

United States Only:

+1 (800) 872-1SAP (+1-800-872-1727)

This document contains forward-looking statements, which are predictions, projections, or other statements about future events. These statements are based on current expectations, forecasts, and assumptions that are subject to risks and uncertainties that could cause actual results and outcomes to materially differ. Additional information regarding these risks and uncertainties may be found in our filings with the Securities and Exchange Commission, including but not limited to the risk factors section of SAP’s 2023 Annual Report on Form 20-F.

© 2025 SAP SE. All rights reserved.
SAP and other SAP products and services mentioned herein as well as their respective logos are trademarks or registered trademarks of SAP SE in Germany and other countries. Please see https://www.sap.com/copyright for additional trademark information and notices.

1 The Q4 2024 results were also impacted by other effects. For details, please refer to the disclosures on page 23 of this document. 

2 The effective tax rate (non-IFRS) is a non-IFRS financial measure and is presented for supplemental informational purposes only. We do not provide an outlook for the effective tax rate (IFRS) due to the uncertainty and potential variability of gains and losses associated with equity securities, which are reconciling items between the two effective tax rates (non-IFRS and IFRS). These items cannot be provided without unreasonable efforts but could have a significant impact on our future effective tax rate (IFRS).


View original content to download multimedia:https://www.prnewswire.com/news-releases/sap-announces-q4-and-fy-2024-results-302361469.html

SOURCE SAP SE

Continue Reading

Technology

Goodwill Houston and CompuCycle Launch Tech Recycle Workforce Training Program for Students with Disabilities

Published

on

By

HOUSTON, Oct. 20, 2026 /PRNewswire/ — Goodwill Houston and CompuCycle today announced Tech Recycle, a workforce training program that turns school districts’ retired electronics into paid vocational training for transition-age students with disabilities. Goodwill Houston operates the program and pays every student. CompuCycle, a Houston-based electronics recycler, provides certified data destruction and recycling for the districts’ devices.

Tech Recycle is a 12-week paid work-based learning program that helps students on the autism spectrum build skills and prepare for future employment, at no cost to them.

How Does Tech Recycle Work?

Districts send retired electronics to CompuCycle for certified data destruction and receive audit-ready documentation before sending the wiped devices to Goodwill Houston to be used in instruction.Students join a 12-week paid work-based learning program run by Goodwill Houston, gaining hands-on experience and skills that can support future employment.Goodwill Houston funds student paychecks in full, separate from the value returned to districts.CompuCycle recycles the scrap materials in-house at its 130,000 sq ft Houston facility and returns recovered material value to the districts.

From One Classroom to a Regional Workforce Program

Tech Recycle grew out of TechCycle, a program CompuCycle launched with Pearland ISD, supported by seed funding from Texas A&M and covered by ABC13. Goodwill Houston now runs it as Tech Recycle.

“Goodwill Houston saw what it could be across the region and built the training around it. Our job is to keep the recycling secure, certified, and done right here in Houston,” said Kelly Adels Hess, CEO of CompuCycle.

Building a Pathway to Success for Students with Autism

“We have run into so many students who have a passion for telling you how things work and taking them apart. But we did not have a pathway set aside for them. The greatest part about this program is we’re paying these students. They now have certified training and a resume builder,” said Vernee Sampson, Senior Manager of Vocational Rehabilitation Programs at Goodwill Houston.

“Most arrive assuming that they can’t do this or this isn’t for them, but we want them to walk away believing that they can do it,” said Alicia Franklin, Career Coach and instructor for Tech Recycle.

How Can Districts and Organizations Get Involved?

School districts that want to train their students through Tech Recycle can contact Goodwill Houston. Organizations with retired electronics can send them through CompuCycle. Learn more about the CompuCycle and Goodwill Houston partnership.

“Community impact is the point of Tech Recycle. A district retires its devices, we recycle them securely, and Goodwill Houston turns that into paid training for students. When a recycler, a nonprofit, and a school district work together, the whole community benefits,” Hess said.

Join the Conversation at E-Scrap

Kelly Adels Hess will lead a workshop, “Community Partnerships, Real Impact,” at the E-Scrap Conference in New Orleans on October 27 from 8:30 to 9:30 a.m.

About Goodwill Houston

Goodwill Houston is a nonprofit organization dedicated to changing lives through the power of work. Serving individuals and families across the Greater Houston area, Goodwill Houston provides workforce development, job training, career services and other programs designed to help people build skills, overcome barriers to employment and achieve greater independence.

About CompuCycle

CompuCycle is a Houston-based IT asset disposition and electronics recycling company. It holds R2v3, e-Stewards, and ISO 27001 certifications, the only electronics recycler in Texas with all three.

Media Contacts

CompuCycle: Kelly Adels Hess, CEO, khess@compucycle.com, 713-869-6700Goodwill Houston: Mia Brooks, Events and Public Relations Coordinator, MBrooks@goodwillhouston.org, 713-805-7031

View original content to download multimedia:https://www.prnewswire.com/news-releases/goodwill-houston-and-compucycle-launch-tech-recycle-workforce-training-program-for-students-with-disabilities-302912262.html

SOURCE CompuCycle

Continue Reading

Technology

xTool Launches C1 Color Cutter : The Full-Color Cutting Machine Built to Scan, Print, and Cut with Precision

Published

on

By

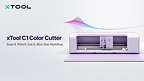
PARIS, Oct. 20, 2026 /PRNewswire/ — xTool, a global pioneer in digital fabrication and smart desktop manufacturing, announces today its expansion into the craft cutter market with the launch of the xTool C1 Color Cutter.

Engineered under the slogan “Scan It. Print It. Cut It. Always in One Workflow,” the C1 solves long-standing industry challenges by integrating high-precision CIS scanning, CMYK full-color inkjet printing, and dynamic blade cutting into a single automated desktop workstation.

Starting October 20th, 2026, xTool is launching its official global pre-order campaign, offering an exclusive £10 deposit incentive that provides early buyers with substantial machine discounts, physical material bundles, and livestream giveaway entries.

Beyond Lasers and Printers : The Natural Evolution into Craft Cutting

The launch of the xTool C1 marks a milestone in xTool’s strategy to build a fully integrated hardware and software ecosystem for creators, DIY enthusiasts, and small-business owners. Building on its global leadership in desktop laser engravers and digital printers, xTool is bringing its expertise in precision mechanics and automation to traditional blade cutting.

By combining full-color printing and precision cutting in one compact machine, the C1 eliminates the need for separate printers, manual material transfers, and error-prone registration marks, simplifying workflows for paper crafts, vinyl graphics, HTV, apparel, and stickers.

Designed for Advanced Crafters and Small Businesses

For DIY enthusiasts, its integrated print-and-cut workflow helps reduce material waste, alignment errors, and the need to cut and weed multiple layers of vinyl. Complex projects involving heat transfer vinyl (HTV) for textile customisation, sticker making, and paper crafts become easier to complete.

For entrepreneurs and small businesses producing customised apparel, labels, packaging, or promotional items, the C1 is a valuable addition to their production workflow. It helps improve productivity, reduce manufacturing costs, and deliver professional-quality results.

Seamless Print-and-Cut Workflow

Combining CMYK inkjet printing with precision blade cutting, the C1 prints directly onto materials before cutting, eliminating registration marks, maximizing printable space, and minimizing alignment errors and waste. Its proprietary Duraproof ink produces vibrant, waterproof, fade-resistant graphics that can withstand up to 30 home washes on textiles.

Built-In CIS Scanner and Live Preview

An integrated Contact Image Sensor (CIS) provides a 1:1 live preview, allowing users to position designs accurately, including leftover materials. Additional features include automatic contour extraction, material nesting, and QR-code-based parameter setup.

AI-Powered Atomm Creation Suite

xTool’s Atomm software transforms text prompts and images into ready-to-cut vectors, with tools for background removal, artistic text, line-art conversion, and 3D papercraft templates, reducing design preparation from hours to minutes.

Versatile Materials and Tools

Compatible with Fine-Point, Deep-Point, Rotary, and 3mm Cutting blades, Foil-Transfer tips, and detail pens, the C1 supports paper, cardstock, vinyl, HTV, leather, balsa wood, and fabrics. Optional accessories include an Electrostatic Mat and Roll Holder with built-in trimmer.

Pre-Order Details

Global pre-orders open on October 20th, 2026, with prices starting at £399 and reservations available for a £10 deposit. Several bundles will be offered, including the first-ever C1 bundle with Atomm Membership.

Pre-order customers will receive exclusive £10 Pre-Order Bonus Perks, including a material kit with over 10 crafting materials, a 20% Material Card valid for 180 days across the xTool store, and entry into a livestream giveaway to win a free C1.

Final payments and global shipping begin November 5, 2026. Further details are available at xtool.com.

About xTool

xTool is a brand founded in 2020 that specialises in smart digital fabrication machines. The company’s mission is to foster creativity by developing intelligent, user-friendly tools that leverage advanced technologies to significantly lower the barriers to creation.

The brand primarily serves makers, DIY enthusiasts, and the education sector by combining powerful software with safe, easy-to-use hardware. xTool provides users with new opportunities to bring their creative ideas to life efficiently and professionally.

For more information: xtool.com

View original content to download multimedia:https://www.prnewswire.co.uk/news-releases/xtool-launches-c1-color-cutter–the-full-color-cutting-machine-built-to-scan-print-and-cut-with-precision-302914186.html

Continue Reading

Technology

Green Data Center Market worth $197.02 billion by 2031 – Report by MarketsandMarkets™

Published

on

By

DELRAY BEACH, Fla., Oct. 20, 2026 /PRNewswire/ — According to MarketsandMarkets™, the global Green Data Center Market is expanding rapidly, with a projected market size anticipated to rise from about USD 60.77 billion in 2026 to USD 197.02 billion by 2031, featuring a CAGR of 26.5%.

Browse 303 market data Tables and 60 Figures spread through 240 Pages and in-depth TOC on “Green Data Center Market – Global Forecast to 2031”

Green Data Center Market Size & Forecast:

Market Size Available for Years: 2021–20312025 Market Size: USD 48.26 billion2026 Market Size: USD 60.77 billion2031 Projected Market Size: USD 197.02 billionCAGR (2026–2031): 26.5%

Green Data Center Market Trends & Insights:

The global market is gaining momentum as data center operators and enterprises respond to rising energy costs, increasingly stringent sustainability regulations, and growing commitments to reduce carbon emissions.The infrastructure segment is expected to hold the largest market value of USD 39.31 billion by 2026.The building management software is projected to grow at the highest CAGR of 32.1% during the forecast period.Cloud and hyperscale data centers are expected to dominate the market during the forecast period.Retail and e-commerce enterprises are projected to grow at the highest CAGR during the forecast period.North America is estimated to dominate the market with the highest value of USD 25.12 billion by 2026.

Download PDF Brochure: https://www.marketsandmarkets.com/pdfdownloadNew.asp?id=1032

Green data centers are transforming digital infrastructure by integrating technologies such as renewable energy systems, liquid and immersion cooling, and intelligent energy management solutions to enable sustainability at scale. These innovations improve power usage efficiency, reduce carbon emissions, and support compliance with increasingly stringent global sustainability regulations, accelerating adoption across hyperscale facilities, colocation providers, and enterprise data centers. By incorporating energy-efficient and environmentally optimized technologies into core operations, green data centers enhance long-term resilience, regulatory alignment, and cost efficiency for energy-intensive workloads. This infrastructure enables organizations to support AI-driven applications, cloud services, and high-density computing environments more efficiently, while reducing reliance on fossil fuel-based power systems and minimizing overall environmental impact.

By Cooling Infrastructure, Green Air Cooling will register the largest market share during the forecast period

Green air cooling is expected to remain a key thermal management solution in data centers, driven by the growing emphasis on energy efficiency, sustainability, and reduced environmental impact. Key components include Computer Room Air Handlers (CRAH) and Computer Room Air Conditioning (CRAC) units, which use chilled water and refrigerant-based systems, respectively, to maintain optimal temperature and humidity conditions. These systems are increasingly equipped with variable-speed fans, advanced controls, and high-efficiency motors to reduce energy consumption and improve overall cooling performance. Energy-efficient air-cooled chillers further complement these systems by using low Global Warming Potential (GWP) refrigerants and incorporating free-cooling modes that leverage ambient outdoor air to reduce cooling energy requirements. Additional approaches, including hot/cold aisle containment, variable airflow management, and intelligent monitoring systems, enable cooling capacity to be dynamically adjusted according to real-time demand, improving energy efficiency. Emerging vendors and solution providers can capitalize on this trend by developing advanced thermal management technologies. Carrier’s investment in ZutaCore, announced in February 2025, highlights the industry’s increasing focus on advanced cooling solutions. The collaboration aims to deliver scalable and energy-efficient thermal management systems capable of addressing the rising cooling requirements of modern data centers. To capture these opportunities, vendors can focus on developing innovative cooling technologies that improve efficiency and support sustainability objectives. Strategic collaborations, industry partnerships, and continuous technological innovation will remain important for strengthening capabilities in the evolving green data center cooling market.

Request for Proposal: https://www.marketsandmarkets.com/requestsampleNew.asp?id=1032

Software segment is poised for the fastest growth rate during the forecast period

The software segment is expected to register the highest CAGR in the Green Data Center Market, driven by growing demand for intelligent automation, energy optimization, operational visibility, and regulatory compliance. Data Center Infrastructure Management (DCIM) software provides real-time visibility into power consumption, cooling performance, server utilization, and environmental conditions, enabling operators to identify inefficiencies, optimize resource allocation, and maintain high availability. Building Management Systems (BMS) integrate electrical, mechanical, and HVAC systems to automate energy-efficient facility operations while regulating lighting, temperature, and airflow to minimize energy waste and improve cooling efficiency. Compliance software supports adherence to environmental standards, industry regulations, and sustainability certifications such as LEED and ISO 50001 by automating reporting, documentation, and audit processes, thereby improving transparency and accountability. Specialized software solutions, including AI-driven predictive workload management and energy analytics platforms, can dynamically optimize cooling, power distribution, and IT workloads based on real-time demand, reducing energy consumption, environmental impact, and operating costs. Emerging vendors and solution providers can capitalize on this growth through strategic partnerships, technology integration, and AI-enabled capabilities. For instance, in August 2025, Vertiv acquired Waylay NV, a Belgium-based AI-powered software provider, to strengthen monitoring, optimization, and operational efficiency across data center systems. By developing advanced software solutions, collaborating with established technology providers, and leveraging AI, automation, and analytics, vendors can support sustainable, efficient, and regulatory-compliant green data center operations while addressing the growing demand for intelligent infrastructure management.

North America accounts for the largest market during the forecast period

North America is witnessing measurable growth in green data center activity, driven by corporate decarbonization targets, rising onsite power costs, and the increasing need to deploy high-density computing infrastructure with lower water and energy intensity. According to the US Energy Information Administration, solar power generation in the United States increased by 25% in 2024, while wind power generation grew by 8%, improving the availability of low-carbon electricity for hyperscale and colocation data center campuses. Additionally, Schneider Electric announced collaborative AI data center reference designs with NVIDIA in December 2024 that support liquid cooling at densities of up to 132 kilowatts per rack, highlighting supplier responses to rising rack power densities and efficiency requirements. Federal and commercial developments during 2024 and 2025 are also influencing procurement timelines and technical specifications. The White House issued an executive order in July 2025 aimed at accelerating federal permitting for large data center projects and supporting infrastructure. By streamlining approvals for facilities exceeding 100 megawatts or involving capital expenditures of at least USD 500 million, the order supports faster deployment of next-generation data centers, enabling integration of renewable power, liquid cooling systems, and energy-efficient designs. Schneider Electric also introduced and validated new electrical and liquid cooling reference designs through 2024 and 2025, creating standardized deployment pathways for integrators and data center owners. Vendors and solution providers are increasingly focusing on liquid cooling systems, modular electrical skids, facility-level heat recovery, and advanced DCIM capabilities to address evolving procurement requirements amid faster permitting processes and increasing renewable power availability.

Request Pricing: https://www.marketsandmarkets.com/Enquiry_Before_BuyingNew.asp?id=1032

Top Companies in Green Data Center Market:

The Top Companies in Green Data Center Market are Schneider Electric (France), Vertiv (US), Eaton (US), Daikin (Japan), ABB (Switzerland), Delta Electronics (Taiwan), Siemens (Germany), Carrier (US), and GE Vernova (US).

Green Data Center Market – Investment & funding +Merger & Acquisition

Investment and Funding Context

The global Green Data Center Market is attracting strong investment from hyperscalers, cloud providers, colocation operators, and enterprises seeking sustainable ways to expand capacity for AI, high-performance computing, and edge workloads. Investment is increasingly directed toward energy-efficient power and cooling systems, eco-friendly IT modules, high-density green AI pods, and sustainable manufacturing capacity.

Capital is also flowing toward companies developing technologies that address the power, cooling, and energy-efficiency requirements of sustainable AI infrastructure. For example, Eaton completed its USD 9.5 billion acquisition of Boyd Thermal in March 2026, adding liquid cooling and thermal management capabilities for high-density, energy-efficient data centers. Similarly, Vertiv agreed in September 2026 to acquire UtilityInnovation Group for approximately USD 1.45 billion to add microgrid controls, on-site generation orchestration, and behind-the-meter power architecture that shorten time to power. Schneider Electric completed the acquisition of a 75% controlling interest in Motivair for USD 850 million in February 2025 to strengthen its liquid cooling portfolio for AI data centers. These investments and strategic transactions demonstrate the increasing emphasis on energy-efficient, low-carbon, and rapidly deployable power and cooling infrastructure across the green data center ecosystem.

Revenue Shift Context

The market is shifting from conventional, energy-intensive data center infrastructure toward energy-efficient, low-carbon, and sustainability-oriented architectures as operators seek to reduce power consumption, operating costs, and carbon emissions. The rapid growth of AI and high-performance computing is accelerating this transition by increasing power density and cooling requirements, creating greater demand for efficient power distribution, advanced thermal management, renewable energy integration, and intelligent energy management. Technologies such as liquid cooling, high-efficiency UPS systems, renewable-powered generation, energy storage, and intelligent monitoring platforms are increasingly being integrated into data center infrastructure to improve energy utilization and support sustainability targets. Operators are also adopting modular and prefabricated solutions that improve deployment efficiency while incorporating energy-efficient power and cooling systems.

Revenue opportunities are consequently expanding beyond conventional energy-efficiency equipment toward integrated green infrastructure solutions, including renewable energy systems, liquid and immersion cooling, energy storage, high-efficiency power systems, AI-enabled energy management, DCIM platforms, carbon monitoring, and heat recovery technologies. The growing deployment of high-density AI infrastructure is particularly increasing demand for liquid cooling, optimized power architectures, and real-time energy monitoring capable of maintaining performance while controlling energy consumption.

Mergers and Acquisitions

Mergers, acquisitions, and strategic investments are increasingly shaping the Green Data Center Market as infrastructure providers seek to strengthen capabilities across energy-efficient power systems, advanced cooling, renewable energy integration, and intelligent energy management. Recent activity is focused on expanding sustainable technology portfolios, enhancing vertical integration across critical infrastructure components, and accelerating the development and deployment of energy-efficient solutions for AI-ready and high-density data center environments.

GREEN DATA CENTER MARKET: MERGERS AND ACQUISITIONS, AUGUST 2025–SEPTEMBER 2026

Month and Year

Deal Type

Company 1

Company 2

Description

September 2026

Acquisition

Eaton (Ireland)

COL Group (Italy) (from Oaktree)

Eaton signed a deal to buy COL Group at an enterprise value of about EUR 810 million. COL makes medium-voltage distribution equipment, including SF6-free switchgear, grid automation, and modular power systems. The deal expands Eaton’s European manufacturing for data center and utility customers.

September 2026

Acquisition

Vertiv (US)

King Environmental Services (KES) (Ireland)

Vertiv agreed to buy this Europe-based provider of fluid management, commissioning, and load-testing services for liquid-cooled data centers. It extends Vertiv’s thermal services into EMEA, building on PurgeRite in North America.

April 2026

Acquisition

Vertiv (US)

BMarko Structures (US)

Vertiv acquired BMarko to bring structural fabrication in-house and expand capacity for manufactured, prefabricated, and converged infrastructure solutions.

November 2025

Acquisition

Eaton (Ireland)

Boyd Thermal (US)

Eaton announced the USD 9.5 billion purchase of Boyd’s thermal business, which closed on March 12, 2026. It adds liquid cooling and thermal components for data centers, and about 80% of Boyd’s business serves that market.

Company Revenue Share Details

The global Green Data Center Market is led by established power, cooling, and electrical infrastructure providers competing across energy-efficient power distribution, power backup and energy storage, green air and liquid cooling, and DCIM and energy management software. Major participants include Schneider Electric, Vertiv, Eaton, ABB, and Hitachi Energy, alongside other global and regional players such as Daikin, Delta Electronics, Siemens, Carrier, and STULZ. Competition is increasingly shaped by the ability to offer integrated power and cooling portfolios that lower PUE, support renewable and low-carbon power integration, and handle the higher rack densities of AI workloads.

Competition is also shifting toward vertical integration and end-to-end offerings that span grid interconnect to chip. Recent transactions demonstrate this focus on liquid cooling, thermal management, and sustainable power distribution. For example, Eaton’s USD 9.5 billion acquisition of Boyd Thermal added liquid cooling capabilities. Its agreement to acquire COL Group (EUR 810 million enterprise value) adds SF6-free medium-voltage switchgear.

Browse Adjacent Markets Data Center and Networking Market Research Reports & Consulting

Related Market Reports:

Data Center Rack Market by Rack Type (Open Frame, Enclosed), Type (Server Racks, Network Racks), Rack Height (42U & Below, 43U up to 52U), Rack Width (19 Inch, 23 Inch), Data Center Type (Enterprise, Colocation, Hyperscale) – Global Forecast to 2030

Data Center Solutions Market by Infrastructure [Power (Critical Power, Backup, Distribution), Mechanical & Cooling (Air Cooled, Liquid Cooling, Heat Pumps), IT (Server, Storage, Networking), Physical (Racks, Cables)], Software – Forecast to 2031

About MarketsandMarkets™  

MarketsandMarkets™ has been recognized as one of America’s Best Management Consulting Firms by Forbes, as per their recent report.

MarketsandMarkets™ is a blue ocean alternative in growth consulting and program management, leveraging a man-machine offering to drive supernormal growth for progressive organizations in the B2B space. With the widest lens on emerging technologies, we are proficient in co-creating supernormal growth for clients across the globe.

Today, 80% of Fortune 2000 companies rely on MarketsandMarkets, and 90 of the top 100 companies in each sector trust us to accelerate their revenue growth. With a global clientele of over 13,000 organizations, we help businesses thrive in a disruptive ecosystem.

The B2B economy is witnessing the emergence of $25 trillion in new revenue streams that are replacing existing ones within this decade. We work with clients on growth programs, helping them monetize this $25 trillion opportunity through our service lines – TAM Expansion, Go-to-Market (GTM) Strategy to Execution, Market Share Gain, Account Enablement, and Thought Leadership Marketing.

Built on the ‘GIVE Growth’ principle, we collaborate with several Forbes Global 2000 B2B companies to keep them future-ready. Our insights and strategies are powered by industry experts, cutting-edge AI, and our Market Intelligence Cloud, KnowledgeStore™, which integrates research and provides ecosystem-wide visibility into revenue shifts.

MarketsandMarkets™ SalesPlay is an AI-driven Revenue Intelligence Co-Pilot designed to help revenue teams prioritize the right accounts, identify critical changes early, and surface opportunities ahead of demand, so pipeline builds naturally and deals close with greater consistency.

To find out more, visit www.MarketsandMarkets™.com or follow us on Twitter, LinkedIn and Facebook.

Contact:
Mr. Rohan Salgarkar
MarketsandMarkets™ INC.
1615 South Congress Ave.
Suite 103, Delray Beach, FL 33445
USA: +1-888-600-6441
Email: sales@marketsandmarkets.com
Visit Our Website: https://www.marketsandmarkets.com/
Content Source: https://www.marketsandmarkets.com/PressReleases/green-data-center-gdc.asp

View original content to download multimedia:https://www.prnewswire.co.uk/news-releases/green-data-center-market-worth-197-02-billion-by-2031–report-by-marketsandmarkets-302912615.html

Continue Reading

Trending