Connect with us

Technology

KLA Corporation Reports Fiscal 2025 Second Quarter Results

Published

on

Total revenues were $3.08 billion, at the upper end of the guidance range of $2.95 billion +/- $150 million;GAAP diluted EPS was $6.16. Non-GAAP diluted EPS was $8.20, near the upper end of the guidance range. GAAP EPS was impacted by a $239.1 million impairment charge for goodwill and purchased intangible assets, or $1.76 per diluted share.Cash flow from operating activities for the quarter and last twelve months were $849.5 million and $3.65 billion, respectively, and free cash flow was $757.2 million and $3.36 billion, respectively; andCapital returns for the quarter and last twelve months were $876.9 million and $2.88 billion, respectively.

MILPITAS, Calif., Jan. 30, 2025 /PRNewswire/ — KLA Corporation (NASDAQ: KLAC) today announced financial and operating results for its second quarter of fiscal year 2025, which ended on Dec. 31, 2024, and reported GAAP net income of $824.5 million and GAAP net income per diluted share of $6.16 on revenues of $3.08 billion.

“KLA’s December quarter results were above the midpoint of our guidance ranges despite navigating through the business impact of new U.S. government export controls released late in the quarter. These results supported a strong finish to calendar 2024 for KLA highlighted by relative revenue growth outperformance and strong profitability,” said Rick Wallace, president and CEO, KLA Corporation. “The return to growth at the leading-edge continues to gain momentum led by expanding AI and high-performance computing investments. KLA’s differentiated portfolio of solutions aligns exceptionally well in helping enable our customers to navigate increasing technology complexity, growing design starts and larger semiconductor devices in an environment of rising semiconductor demand.”

GAAP Results

Q2 FY 2025

Q1 FY 2025

Q2 FY 2024

Total Revenues

$3,077 million

$2,842 million

$2,487 million

Net Income

$825 million

$946 million

$583 million

Net Income per Diluted Share

$6.16

$7.01

$4.28

Non-GAAP Results

Q2 FY 2025

Q1 FY 2025

Q2 FY 2024

Net Income

$1,098 million

$988 million

$839 million

Net Income per Diluted Share

$8.20

$7.33

$6.16


A reconciliation between GAAP operating results and non-GAAP operating results is provided following the financial statements included in this release. KLA will discuss the results for its fiscal year 2025 second quarter, along with its outlook, on a conference call today beginning at 3 p.m. P.T. A webcast of the call will be available at: www.kla.com.

Third Quarter Fiscal 2025 Guidance
The following details our guidance for the third quarter of fiscal 2025 ending in March:

Total revenues is expected to be in a range of $3.0 billion +/- $150 millionGAAP gross margin is expected to be in a range of 60.6% +/- 1.0%Non-GAAP gross margin is expected to be in a range of 62.0% +/- 1.0%GAAP diluted EPS is expected to be in a range of $7.77 +/- $0.60Non-GAAP diluted EPS is expected to be in a range of $8.05 +/- $0.60

For additional details and assumptions underlying our guidance metrics, please see the company’s published Letter to Shareholders, Earnings Slide Presentation and Earnings Infographic on the KLA investor relations website. Such Letter to Shareholders, Earnings Slide Presentation and Earnings Infographic are not incorporated by reference into this earnings release.

About KLA:
KLA Corporation (“KLA”) develops industry-leading equipment and services that enable innovation throughout the electronics industry. We provide advanced process control and process-enabling solutions for manufacturing wafers and reticles, integrated circuits, packaging and printed circuit boards. In close collaboration with leading customers across the globe, our expert teams of physicists, engineers, data scientists and problem-solvers design solutions that move the world forward. Investors and others should note that KLA announces material financial information including SEC filings, press releases, public earnings calls and conference webcasts using an investor relations website (ir.kla.com). Additional information may be found at: www.kla.com. 

Note Regarding Forward-Looking Statements:
Statements in this press release other than historical facts, such as statements pertaining to total revenues, GAAP and non-GAAP gross margin and GAAP and non-GAAP diluted EPS for the quarter ending March 31, 2025, are forward-looking statements and are subject to the Safe Harbor provisions created by the Private Securities Litigation Reform Act of 1995. These forward-looking statements are based on current information and expectations and involve a number of risks and uncertainties. Actual results may differ materially from those projected in such statements due to various factors, including, but not limited to: our vulnerability to a weakening in the condition of the financial markets and the global economy; risks related to our international operations; evolving Bureau of Industry and Security of the U.S. Department of Commerce rules and regulations and their impact on our ability to sell products to and provide services to certain customers in China; costly intellectual property disputes that could result in our inability to sell or use the challenged technology; risks related to the legal, regulatory and tax environments in which we conduct our business; increasing attention to environment, social and governance (“ESG”) matters and the resulting costs, risks and impact on our business; unexpected delays, difficulties and expenses in executing against our environmental, climate, diversity and inclusion or other ESG targets, goals and commitments; our ability to attract, retain and motivate key personnel; our vulnerability to disruptions and delays at our third party service providers; cybersecurity threats, cyber incidents affecting our and our business partners’ systems and networks; our inability to access critical information in a timely manner due to system failures; risks related to acquisitions, integrations, strategic alliances or collaborative arrangements; climate change, earthquake, flood or other natural catastrophic events, public health crises such as the COVID-19 pandemic or terrorism and the adverse impact on our business operations; the war between Ukraine and Russia, escalation of hostilities in the Middle East, and the significant military activity in that region; lack of insurance for losses and interruptions caused by terrorists and acts of war, and our self-insurance of certain risks including earthquake risk; risks related to fluctuations in foreign currency exchange rates; risks related to fluctuations in interest rates and the market values of our portfolio investments; risks related to tax and regulatory compliance audits; any change in taxation rules or practices and our effective tax rate; compliance costs with federal securities laws, rules, regulations, NASDAQ requirements, and evolving accounting standards and practices; ongoing changes in the technology industry, and the semiconductor industry in particular, including future growth rates, pricing trends in end-markets, or changes in customer capital spending patterns; our vulnerability to a highly concentrated customer base; the cyclicality of the industries in which we operate; our ability to timely develop new technologies and products that successfully address changes in the industry; risks related to artificial intelligence; our ability to maintain our technology advantage and protect proprietary rights; our ability to compete in the industry; availability and cost of the materials and parts used in the production of our products; our ability to operate our business in accordance with our business plan; risks related to our debt and leveraged capital structure; we may not be able to declare cash dividends at all or in any particular amount; liability to our customers under indemnification provisions if our products fail to operate properly or contain defects or our customers are sued by third parties due to our products; our government funding for research and development is subject to audit, and potential termination or penalties; we may incur significant restructuring charges or other asset impairment charges or inventory write offs; risks related to receivables factoring arrangements and compliance risk of certain settlement agreements with the government; and risks related to the Court of Chancery of the State of Delaware being the sole and exclusive forum for certain actions and proceedings. For other factors that may cause actual results to differ materially from those projected and anticipated in forward-looking statements in this press release, please refer to KLA’s Annual Report on Form 10-K for the year ended June 30, 2024, and other subsequent filings with the Securities and Exchange Commission (including, but not limited to, the risk factors described therein). KLA assumes no obligation to, and does not currently intend to, update these forward-looking statements.

KLA Corporation

Condensed Consolidated Unaudited Balance Sheets

(In thousands)

Dec. 31, 2024

June 30, 2024

ASSETS

Current assets:

Cash and cash equivalents

$             1,838,278

$             1,977,129

Marketable securities

1,942,127

2,526,866

Accounts receivable, net

2,334,977

1,833,041

Inventories

3,046,340

3,034,781

Other current assets

610,882

659,327

          Total current assets

9,772,604

10,031,144

Land, property and equipment, net

1,173,928

1,109,968

Goodwill, net

1,785,297

2,015,726

Deferred income taxes

1,002,169

915,241

Purchased intangible assets, net

548,645

668,764

Other non-current assets

719,053

692,723

Total assets

$           15,001,696

$           15,433,566

LIABILITIES AND STOCKHOLDERS’ EQUITY

Current liabilities:

Accounts payable

$                432,891

$                359,487

Deferred system revenue

1,072,565

985,856

Deferred service revenue

521,424

501,926

Current portion of long-term debt

—

749,936

Other current liabilities

2,111,378

2,063,569

Total current liabilities

4,138,258

4,660,774

Long-term debt

5,882,387

5,880,199

Deferred tax liabilities

423,626

486,690

Deferred service revenue

333,758

294,460

Other non-current liabilities

639,118

743,115

Total liabilities

11,417,147

12,065,238

Stockholders’ equity:

Common stock and capital in excess of par value

2,346,346

2,280,133

Retained earnings

1,284,589

1,137,270

Accumulated other comprehensive loss

(46,386)

(49,075)

Total stockholders’ equity

3,584,549

3,368,328

Total liabilities and stockholders’ equity

$           15,001,696

$           15,433,566


KLA Corporation

Condensed Consolidated Unaudited Statements of Operations

Three Months Ended Dec. 31,

Six Months Ended Dec. 31,

(In thousands, except per share amounts)

2024

2023

2024

2023

Revenues:

Product

$     2,409,462

$     1,921,809

$     4,606,851

$     3,758,473

Service

667,389

564,917

1,311,541

1,125,209

Total revenues

3,076,851

2,486,726

5,918,392

4,883,682

Costs and expenses:

Costs of revenues

1,221,461

976,746

2,368,892

1,923,637

Research and development

346,157

320,418

669,302

631,632

Selling, general and administrative

267,081

237,244

518,123

476,889

Impairment of goodwill and purchased intangible assets

239,100

219,000

239,100

219,000

Interest expense

74,981

74,202

157,152

148,436

Other expense (income), net

(44,458)

(32,154)

(85,393)

(58,893)

Income before income taxes

972,529

691,270

2,051,216

1,542,981

Provision for income taxes

148,002

108,736

280,838

219,072

Net income

$         824,527

$         582,534

$     1,770,378

$     1,323,909

Net income per share

Basic

$               6.18

$               4.30

$             13.24

$               9.74

Diluted

$               6.16

$               4.28

$             13.17

$               9.69

Weighted-average number of shares:

Basic

133,327

135,539

133,730

135,976

Diluted

133,926

136,254

134,415

136,684


KLA Corporation

Condensed Consolidated Unaudited Statements of Cash Flows

Three Months Ended Dec. 31,

(In thousands)

2024

2023

Cash flows from operating activities:

Net income

$            824,527

$            582,534

Adjustments to reconcile net income to net cash provided by (used in) operating activities:

Impairment of goodwill and purchased intangible assets

239,100

219,000

Depreciation and amortization

103,922

99,063

Unrealized foreign exchange (gain) loss and other

11,346

(34,346)

Stock-based compensation expense

61,841

48,620

Deferred income taxes

(68,976)

(65,158)

Net gain on sale of assets

(161)

—

Changes in assets and liabilities, net of assets acquired and liabilities assumed in business acquisitions:

Accounts receivable

(394,604)

(160,265)

Inventories

64,958

(21,189)

Other assets

(90,845)

(104,872)

Accounts payable

67,080

2,692

Deferred system revenue

195,357

218,250

Deferred service revenue

22,927

68,821

Other liabilities

(186,957)

(230,908)

Net cash provided by operating activities

849,515

622,242

Cash flows from investing activities:

Proceeds from sale of assets

161

5,079

Capital expenditures

(92,323)

(76,801)

Purchases of available-for-sale securities

(489,033)

(451,800)

Proceeds from sale of available-for-sale securities

183,097

7,252

Proceeds from maturity of available-for-sale securities

1,010,660

427,128

Purchases of trading securities

(17,276)

(16,049)

Proceeds from sale of trading securities

18,420

16,715

                    Net cash provided by (used in) investing activities

613,706

(88,476)

Cash flows from financing activities:

Repayment of debt

(750,000)

—

Common stock repurchases

(650,121)

(437,817)

Payment of dividends to stockholders

(226,776)

(196,859)

Issuance of common stock

47,538

48,433

Tax withholding payments related to vested and released restricted stock units

(3,608)

(3,005)

Contingent consideration payable and other, net

—

(1,676)

                  Net cash used in financing activities

(1,582,967)

(590,924)

Effect of exchange rate changes on cash and cash equivalents

(19,178)

10,642

Net decrease in cash and cash equivalents

(138,924)

(46,516)

Cash and cash equivalents at beginning of period

1,977,202

1,711,570

Cash and cash equivalents at end of period

$         1,838,278

$         1,665,054

Supplemental cash flow disclosures:

Income taxes paid, net

$            361,833

$            506,046

Interest paid

$              25,059

$              24,818

Non-cash activities:

Contingent consideration payable – financing activities

$                    —

$                  155

Dividends payable – financing activities

$                2,104

$                2,132

Unsettled common stock repurchase – financing activities

$                5,500

$              10,999

Accrued purchase of land, property and equipment – investing activities

$              11,354

$              18,312


KLA Corporation

Segment Information (Unaudited)

The following is a summary of results for each of our three reportable segments and reconciliations to total revenues for the indicated periods:

Three Months Ended Dec. 31,

Six Months Ended Dec. 31,

(In thousands)

2024

2023

2024

2023

Revenues:

Semiconductor Process Control

$     2,755,743

$     2,194,079

$     5,330,894

$     4,329,557

Specialty Semiconductor Process

160,407

150,065

288,741

276,784

PCB and Component Inspection

161,080

143,032

299,063

279,075

Total revenues for reportable segments

3,077,230

2,487,176

5,918,698

4,885,416

Corporate allocations and effects of changes in foreign currency exchange rates

(379)

(450)

(306)

(1,734)

Total revenues

$     3,076,851

$     2,486,726

$     5,918,392

$     4,883,682


KLA Corporation

Condensed Consolidated Unaudited Supplemental Information

Reconciliation of GAAP Net Income to Non-GAAP Net Income 

Three Months Ended

Six Months Ended

(In thousands, except per share amounts)

Dec. 31,
2024

Sept. 30,
2024

Dec. 31,
2023

Dec. 31,
2024

Dec. 31,
2023

GAAP net income

$      824,527

$      945,851

$      582,534

$  1,770,378

$  1,323,909

Adjustments to reconcile GAAP net income to non-GAAP net income:

Acquisition-related charges

a

58,656

56,694

59,307

115,350

122,551

Restructuring, severance and other charges

b

2,133

2,862

1,270

4,995

1,270

Impairment of goodwill and purchased intangible assets

c

239,100

—

219,000

239,100

219,000

Income tax effect of non-GAAP adjustments

d

(23,160)

(19,486)

(22,806)

(42,646)

(43,205)

Discrete tax items

e

(2,812)

2,233

(103)

(579)

2,152

Non-GAAP net income

$  1,098,444

$      988,154

$      839,202

$  2,086,598

$  1,625,677

GAAP net income per diluted share

$            6.16

$            7.01

$            4.28

$          13.17

$            9.69

Non-GAAP net income per diluted share

$            8.20

$            7.33

$            6.16

$          15.52

$          11.89

Shares used in diluted net income per share calculation

133,926

134,858

136,254

134,415

136,684


Pre-tax Impact of GAAP to Non-GAAP Adjustments Included in Condensed Consolidated Unaudited Statements of Operations 

(In thousands)

Acquisition –
Related
Charges

Restructuring,
Severance and
Other Charges

Goodwill and
Purchased
Intangible
Asset
Impairment

Total Pre-tax GAAP
to Non-GAAP
Adjustments

Three Months Ended Dec. 31, 2024

Costs of revenues

$        43,348

$              429

$                —

$                43,777

Research and development

2,994

1,166

—

4,160

Selling, general and administrative

12,314

538

—

12,852

Impairment of goodwill and purchased intangible assets

—

—

239,100

239,100

Total in three months ended Dec. 31, 2024

$        58,656

$          2,133

$      239,100

$              299,889

Three Months Ended Sept. 30, 2024

Costs of revenues

$        44,090

$              901

$                —

$                44,991

Research and development

—

1,087

—

1,087

Selling, general and administrative

12,604

874

—

13,478

Total in three months ended Sept. 30, 2024

$        56,694

$          2,862

$                —

$                59,556

Three Months Ended Dec. 31, 2023

Costs of revenues

$        46,078

$              467

$                —

$                46,545

Research and development

—

417

—

417

Selling, general and administrative

13,229

386

—

13,615

Impairment of goodwill and purchased intangible assets

—

—

219,000

219,000

Total in three months ended Dec. 31, 2023

$        59,307

$          1,270

$      219,000

$              279,577


Free Cash Flow Reconciliation 

Three Months Ended Dec. 31,

Twelve Months Ended Dec. 31,

(In thousands)

2024

2023

2024

2023

Net cash provided by operating activities

$          849,515

$          622,242

$      3,647,346

$      3,475,952

Capital expenditures

(92,323)

(76,801)

(285,254)

(308,443)

Free cash flow

$          757,192

$          545,441

$      3,362,092

$      3,167,509


Capital Returns Calculation 

Three Months Ended Dec. 31,

Twelve Months Ended Dec. 31,

(In thousands)

2024

2023

2024

2023

Payments of dividends to stockholders

$          226,776

$          196,859

$          819,530

$          738,730

Common stock repurchases

650,121

437,817

2,060,021

1,760,240

Capital returns

$          876,897

$          634,676

$      2,879,551

$      2,498,970


Third Quarter Fiscal 2025 Guidance

Reconciliation of GAAP Diluted EPS to Non-GAAP Diluted EPS

Three Months Ending March 31, 2025

(In millions, except per share amounts)

Low

High

GAAP net income per diluted share

$7.17

$8.37

Acquisition-related charges

a

0.40

0.40

Restructuring, severance and other charges

b

0.02

0.02

Income tax effect of non-GAAP adjustments

d

(.14)

(.14)

Non-GAAP net income per diluted share

$7.45

$8.65

Shares used in net income per diluted share calculation

133.3

133.3


Reconciliation of GAAP Gross Margin to Non-GAAP Gross Margin

Three Months Ending March 31, 2025

Low

High

GAAP gross margin

59.6 %

61.6 %

Acquisition-related charges

a

1.4 %

1.4 %

Non-GAAP gross margin

61.0 %

63.0 %


The non-GAAP and supplemental information provided in this press release is a supplement to, and not a substitute for, KLA’s financial results presented in accordance with United States GAAP.

To supplement our Condensed Consolidated Financial Statements presented in accordance with GAAP, we provide certain non-GAAP financial information, which is adjusted from results based on GAAP to exclude certain gains, costs and expenses, as well as other supplemental information. The non-GAAP and supplemental information is provided to enhance the user’s overall understanding of our operating performance and our prospects in the future. Specifically, we believe that the non-GAAP information, including non-GAAP net income, non-GAAP net income per diluted share, non-GAAP gross margin and free cash flow, provides useful measures to both management and investors regarding financial and business trends relating to our financial performance by excluding certain costs and expenses that we believe are not indicative of our core operating results to help investors compare our operating performances with our results in prior periods as well as with the performance of other companies. The non-GAAP information is among the budgeting and planning tools that management uses for future forecasting. However, because there are no standardized or generally accepted definitions for most non-GAAP financial metrics, definitions of non-GAAP financial metrics are inherently subject to significant discretion (for example, determining which costs and expenses to exclude when calculating such a metric). As a result, non-GAAP financial metrics may be defined very differently from company to company, or even from period to period within the same company, which can potentially limit the usefulness of such information to an investor. The presentation of non-GAAP and supplemental information is not meant to be considered in isolation or as a substitute for results prepared and presented in accordance with United States GAAP. The following are descriptions of the adjustments made to reconcile GAAP net income to non-GAAP net income:

a.

Acquisition-related charges primarily include amortization of intangible assets and write-offs due to abandonment of in-process research and development projects. Although we exclude the effect of amortization of all acquired intangible assets from these non-GAAP financial measures, management believes that it is important for investors to understand that such intangible assets were recorded as part of purchase price accounting arising from acquisitions, and such amortization of intangible assets related to past acquisitions will recur in future periods until such intangible assets have been fully amortized. Investors should note that the use of these intangible assets contributed to our revenues earned during the periods presented and are expected to contribute to our future period revenues as well.

b.

Restructuring, severance and other charges primarily include costs associated with employee severance.

c.

Impairment of goodwill and purchased intangible assets in the three and six months ended Dec. 31, 2024 as well as the three and six months ended Dec. 31, 2023 included non-cash expense recognized as a result of the company’s testing for goodwill impairment and long-lived assets impairment. The impairment charge in fiscal 2024 resulted from the downward revision of financial outlook for our PCB and Display reporting units. The impairment charge in fiscal 2025 resulted from the continued deterioration of the long-term forecast for our PCB business. Management believes that it is appropriate to exclude these impairment charges as they are not indicative of ongoing operating results and therefore limit comparability. Management also believes excluding this item helps investors compare our operating performance with our results in prior periods as well as with the performance of other companies.

d.

Income tax effect of non-GAAP adjustments includes the income tax effects of the excluded items noted above.

e.

Discrete tax items in the three and six months ended Dec. 31, 2024 include the recognition of a deferred tax asset on foreign currency gains/losses resulting from new tax legislation. Discrete tax items in the three and six months ended Dec. 31, 2023 included a one-time tax benefit resulting from changes made to our international structure to better align ownership of certain intellectual property rights with how our business operates. Discrete tax items in all periods presented included a tax impact relating to the amortization of the aforementioned tax benefit or similar tax benefits recorded in other periods.


View original content:https://www.prnewswire.com/news-releases/kla-corporation-reports-fiscal-2025-second-quarter-results-302364726.html

SOURCE KLA Corporation

Continue Reading

Technology

Goodwill Houston and CompuCycle Launch Tech Recycle Workforce Training Program for Students with Disabilities

Published

on

By

HOUSTON, Oct. 20, 2026 /PRNewswire/ — Goodwill Houston and CompuCycle today announced Tech Recycle, a workforce training program that turns school districts’ retired electronics into paid vocational training for transition-age students with disabilities. Goodwill Houston operates the program and pays every student. CompuCycle, a Houston-based electronics recycler, provides certified data destruction and recycling for the districts’ devices.

Tech Recycle is a 12-week paid work-based learning program that helps students on the autism spectrum build skills and prepare for future employment, at no cost to them.

How Does Tech Recycle Work?

Districts send retired electronics to CompuCycle for certified data destruction and receive audit-ready documentation before sending the wiped devices to Goodwill Houston to be used in instruction.Students join a 12-week paid work-based learning program run by Goodwill Houston, gaining hands-on experience and skills that can support future employment.Goodwill Houston funds student paychecks in full, separate from the value returned to districts.CompuCycle recycles the scrap materials in-house at its 130,000 sq ft Houston facility and returns recovered material value to the districts.

From One Classroom to a Regional Workforce Program

Tech Recycle grew out of TechCycle, a program CompuCycle launched with Pearland ISD, supported by seed funding from Texas A&M and covered by ABC13. Goodwill Houston now runs it as Tech Recycle.

“Goodwill Houston saw what it could be across the region and built the training around it. Our job is to keep the recycling secure, certified, and done right here in Houston,” said Kelly Adels Hess, CEO of CompuCycle.

Building a Pathway to Success for Students with Autism

“We have run into so many students who have a passion for telling you how things work and taking them apart. But we did not have a pathway set aside for them. The greatest part about this program is we’re paying these students. They now have certified training and a resume builder,” said Vernee Sampson, Senior Manager of Vocational Rehabilitation Programs at Goodwill Houston.

“Most arrive assuming that they can’t do this or this isn’t for them, but we want them to walk away believing that they can do it,” said Alicia Franklin, Career Coach and instructor for Tech Recycle.

How Can Districts and Organizations Get Involved?

School districts that want to train their students through Tech Recycle can contact Goodwill Houston. Organizations with retired electronics can send them through CompuCycle. Learn more about the CompuCycle and Goodwill Houston partnership.

“Community impact is the point of Tech Recycle. A district retires its devices, we recycle them securely, and Goodwill Houston turns that into paid training for students. When a recycler, a nonprofit, and a school district work together, the whole community benefits,” Hess said.

Join the Conversation at E-Scrap

Kelly Adels Hess will lead a workshop, “Community Partnerships, Real Impact,” at the E-Scrap Conference in New Orleans on October 27 from 8:30 to 9:30 a.m.

About Goodwill Houston

Goodwill Houston is a nonprofit organization dedicated to changing lives through the power of work. Serving individuals and families across the Greater Houston area, Goodwill Houston provides workforce development, job training, career services and other programs designed to help people build skills, overcome barriers to employment and achieve greater independence.

About CompuCycle

CompuCycle is a Houston-based IT asset disposition and electronics recycling company. It holds R2v3, e-Stewards, and ISO 27001 certifications, the only electronics recycler in Texas with all three.

Media Contacts

CompuCycle: Kelly Adels Hess, CEO, khess@compucycle.com, 713-869-6700Goodwill Houston: Mia Brooks, Events and Public Relations Coordinator, MBrooks@goodwillhouston.org, 713-805-7031

View original content to download multimedia:https://www.prnewswire.com/news-releases/goodwill-houston-and-compucycle-launch-tech-recycle-workforce-training-program-for-students-with-disabilities-302912262.html

SOURCE CompuCycle

Continue Reading

Technology

xTool Launches C1 Color Cutter : The Full-Color Cutting Machine Built to Scan, Print, and Cut with Precision

Published

on

By

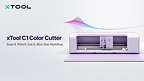
PARIS, Oct. 20, 2026 /PRNewswire/ — xTool, a global pioneer in digital fabrication and smart desktop manufacturing, announces today its expansion into the craft cutter market with the launch of the xTool C1 Color Cutter.

Engineered under the slogan “Scan It. Print It. Cut It. Always in One Workflow,” the C1 solves long-standing industry challenges by integrating high-precision CIS scanning, CMYK full-color inkjet printing, and dynamic blade cutting into a single automated desktop workstation.

Starting October 20th, 2026, xTool is launching its official global pre-order campaign, offering an exclusive £10 deposit incentive that provides early buyers with substantial machine discounts, physical material bundles, and livestream giveaway entries.

Beyond Lasers and Printers : The Natural Evolution into Craft Cutting

The launch of the xTool C1 marks a milestone in xTool’s strategy to build a fully integrated hardware and software ecosystem for creators, DIY enthusiasts, and small-business owners. Building on its global leadership in desktop laser engravers and digital printers, xTool is bringing its expertise in precision mechanics and automation to traditional blade cutting.

By combining full-color printing and precision cutting in one compact machine, the C1 eliminates the need for separate printers, manual material transfers, and error-prone registration marks, simplifying workflows for paper crafts, vinyl graphics, HTV, apparel, and stickers.

Designed for Advanced Crafters and Small Businesses

For DIY enthusiasts, its integrated print-and-cut workflow helps reduce material waste, alignment errors, and the need to cut and weed multiple layers of vinyl. Complex projects involving heat transfer vinyl (HTV) for textile customisation, sticker making, and paper crafts become easier to complete.

For entrepreneurs and small businesses producing customised apparel, labels, packaging, or promotional items, the C1 is a valuable addition to their production workflow. It helps improve productivity, reduce manufacturing costs, and deliver professional-quality results.

Seamless Print-and-Cut Workflow

Combining CMYK inkjet printing with precision blade cutting, the C1 prints directly onto materials before cutting, eliminating registration marks, maximizing printable space, and minimizing alignment errors and waste. Its proprietary Duraproof ink produces vibrant, waterproof, fade-resistant graphics that can withstand up to 30 home washes on textiles.

Built-In CIS Scanner and Live Preview

An integrated Contact Image Sensor (CIS) provides a 1:1 live preview, allowing users to position designs accurately, including leftover materials. Additional features include automatic contour extraction, material nesting, and QR-code-based parameter setup.

AI-Powered Atomm Creation Suite

xTool’s Atomm software transforms text prompts and images into ready-to-cut vectors, with tools for background removal, artistic text, line-art conversion, and 3D papercraft templates, reducing design preparation from hours to minutes.

Versatile Materials and Tools

Compatible with Fine-Point, Deep-Point, Rotary, and 3mm Cutting blades, Foil-Transfer tips, and detail pens, the C1 supports paper, cardstock, vinyl, HTV, leather, balsa wood, and fabrics. Optional accessories include an Electrostatic Mat and Roll Holder with built-in trimmer.

Pre-Order Details

Global pre-orders open on October 20th, 2026, with prices starting at £399 and reservations available for a £10 deposit. Several bundles will be offered, including the first-ever C1 bundle with Atomm Membership.

Pre-order customers will receive exclusive £10 Pre-Order Bonus Perks, including a material kit with over 10 crafting materials, a 20% Material Card valid for 180 days across the xTool store, and entry into a livestream giveaway to win a free C1.

Final payments and global shipping begin November 5, 2026. Further details are available at xtool.com.

About xTool

xTool is a brand founded in 2020 that specialises in smart digital fabrication machines. The company’s mission is to foster creativity by developing intelligent, user-friendly tools that leverage advanced technologies to significantly lower the barriers to creation.

The brand primarily serves makers, DIY enthusiasts, and the education sector by combining powerful software with safe, easy-to-use hardware. xTool provides users with new opportunities to bring their creative ideas to life efficiently and professionally.

For more information: xtool.com

View original content to download multimedia:https://www.prnewswire.co.uk/news-releases/xtool-launches-c1-color-cutter–the-full-color-cutting-machine-built-to-scan-print-and-cut-with-precision-302914186.html

Continue Reading

Technology

Green Data Center Market worth $197.02 billion by 2031 – Report by MarketsandMarkets™

Published

on

By

DELRAY BEACH, Fla., Oct. 20, 2026 /PRNewswire/ — According to MarketsandMarkets™, the global Green Data Center Market is expanding rapidly, with a projected market size anticipated to rise from about USD 60.77 billion in 2026 to USD 197.02 billion by 2031, featuring a CAGR of 26.5%.

Browse 303 market data Tables and 60 Figures spread through 240 Pages and in-depth TOC on “Green Data Center Market – Global Forecast to 2031”

Green Data Center Market Size & Forecast:

Market Size Available for Years: 2021–20312025 Market Size: USD 48.26 billion2026 Market Size: USD 60.77 billion2031 Projected Market Size: USD 197.02 billionCAGR (2026–2031): 26.5%

Green Data Center Market Trends & Insights:

The global market is gaining momentum as data center operators and enterprises respond to rising energy costs, increasingly stringent sustainability regulations, and growing commitments to reduce carbon emissions.The infrastructure segment is expected to hold the largest market value of USD 39.31 billion by 2026.The building management software is projected to grow at the highest CAGR of 32.1% during the forecast period.Cloud and hyperscale data centers are expected to dominate the market during the forecast period.Retail and e-commerce enterprises are projected to grow at the highest CAGR during the forecast period.North America is estimated to dominate the market with the highest value of USD 25.12 billion by 2026.

Download PDF Brochure: https://www.marketsandmarkets.com/pdfdownloadNew.asp?id=1032

Green data centers are transforming digital infrastructure by integrating technologies such as renewable energy systems, liquid and immersion cooling, and intelligent energy management solutions to enable sustainability at scale. These innovations improve power usage efficiency, reduce carbon emissions, and support compliance with increasingly stringent global sustainability regulations, accelerating adoption across hyperscale facilities, colocation providers, and enterprise data centers. By incorporating energy-efficient and environmentally optimized technologies into core operations, green data centers enhance long-term resilience, regulatory alignment, and cost efficiency for energy-intensive workloads. This infrastructure enables organizations to support AI-driven applications, cloud services, and high-density computing environments more efficiently, while reducing reliance on fossil fuel-based power systems and minimizing overall environmental impact.

By Cooling Infrastructure, Green Air Cooling will register the largest market share during the forecast period

Green air cooling is expected to remain a key thermal management solution in data centers, driven by the growing emphasis on energy efficiency, sustainability, and reduced environmental impact. Key components include Computer Room Air Handlers (CRAH) and Computer Room Air Conditioning (CRAC) units, which use chilled water and refrigerant-based systems, respectively, to maintain optimal temperature and humidity conditions. These systems are increasingly equipped with variable-speed fans, advanced controls, and high-efficiency motors to reduce energy consumption and improve overall cooling performance. Energy-efficient air-cooled chillers further complement these systems by using low Global Warming Potential (GWP) refrigerants and incorporating free-cooling modes that leverage ambient outdoor air to reduce cooling energy requirements. Additional approaches, including hot/cold aisle containment, variable airflow management, and intelligent monitoring systems, enable cooling capacity to be dynamically adjusted according to real-time demand, improving energy efficiency. Emerging vendors and solution providers can capitalize on this trend by developing advanced thermal management technologies. Carrier’s investment in ZutaCore, announced in February 2025, highlights the industry’s increasing focus on advanced cooling solutions. The collaboration aims to deliver scalable and energy-efficient thermal management systems capable of addressing the rising cooling requirements of modern data centers. To capture these opportunities, vendors can focus on developing innovative cooling technologies that improve efficiency and support sustainability objectives. Strategic collaborations, industry partnerships, and continuous technological innovation will remain important for strengthening capabilities in the evolving green data center cooling market.

Request for Proposal: https://www.marketsandmarkets.com/requestsampleNew.asp?id=1032

Software segment is poised for the fastest growth rate during the forecast period

The software segment is expected to register the highest CAGR in the Green Data Center Market, driven by growing demand for intelligent automation, energy optimization, operational visibility, and regulatory compliance. Data Center Infrastructure Management (DCIM) software provides real-time visibility into power consumption, cooling performance, server utilization, and environmental conditions, enabling operators to identify inefficiencies, optimize resource allocation, and maintain high availability. Building Management Systems (BMS) integrate electrical, mechanical, and HVAC systems to automate energy-efficient facility operations while regulating lighting, temperature, and airflow to minimize energy waste and improve cooling efficiency. Compliance software supports adherence to environmental standards, industry regulations, and sustainability certifications such as LEED and ISO 50001 by automating reporting, documentation, and audit processes, thereby improving transparency and accountability. Specialized software solutions, including AI-driven predictive workload management and energy analytics platforms, can dynamically optimize cooling, power distribution, and IT workloads based on real-time demand, reducing energy consumption, environmental impact, and operating costs. Emerging vendors and solution providers can capitalize on this growth through strategic partnerships, technology integration, and AI-enabled capabilities. For instance, in August 2025, Vertiv acquired Waylay NV, a Belgium-based AI-powered software provider, to strengthen monitoring, optimization, and operational efficiency across data center systems. By developing advanced software solutions, collaborating with established technology providers, and leveraging AI, automation, and analytics, vendors can support sustainable, efficient, and regulatory-compliant green data center operations while addressing the growing demand for intelligent infrastructure management.

North America accounts for the largest market during the forecast period

North America is witnessing measurable growth in green data center activity, driven by corporate decarbonization targets, rising onsite power costs, and the increasing need to deploy high-density computing infrastructure with lower water and energy intensity. According to the US Energy Information Administration, solar power generation in the United States increased by 25% in 2024, while wind power generation grew by 8%, improving the availability of low-carbon electricity for hyperscale and colocation data center campuses. Additionally, Schneider Electric announced collaborative AI data center reference designs with NVIDIA in December 2024 that support liquid cooling at densities of up to 132 kilowatts per rack, highlighting supplier responses to rising rack power densities and efficiency requirements. Federal and commercial developments during 2024 and 2025 are also influencing procurement timelines and technical specifications. The White House issued an executive order in July 2025 aimed at accelerating federal permitting for large data center projects and supporting infrastructure. By streamlining approvals for facilities exceeding 100 megawatts or involving capital expenditures of at least USD 500 million, the order supports faster deployment of next-generation data centers, enabling integration of renewable power, liquid cooling systems, and energy-efficient designs. Schneider Electric also introduced and validated new electrical and liquid cooling reference designs through 2024 and 2025, creating standardized deployment pathways for integrators and data center owners. Vendors and solution providers are increasingly focusing on liquid cooling systems, modular electrical skids, facility-level heat recovery, and advanced DCIM capabilities to address evolving procurement requirements amid faster permitting processes and increasing renewable power availability.

Request Pricing: https://www.marketsandmarkets.com/Enquiry_Before_BuyingNew.asp?id=1032

Top Companies in Green Data Center Market:

The Top Companies in Green Data Center Market are Schneider Electric (France), Vertiv (US), Eaton (US), Daikin (Japan), ABB (Switzerland), Delta Electronics (Taiwan), Siemens (Germany), Carrier (US), and GE Vernova (US).

Green Data Center Market – Investment & funding +Merger & Acquisition

Investment and Funding Context

The global Green Data Center Market is attracting strong investment from hyperscalers, cloud providers, colocation operators, and enterprises seeking sustainable ways to expand capacity for AI, high-performance computing, and edge workloads. Investment is increasingly directed toward energy-efficient power and cooling systems, eco-friendly IT modules, high-density green AI pods, and sustainable manufacturing capacity.

Capital is also flowing toward companies developing technologies that address the power, cooling, and energy-efficiency requirements of sustainable AI infrastructure. For example, Eaton completed its USD 9.5 billion acquisition of Boyd Thermal in March 2026, adding liquid cooling and thermal management capabilities for high-density, energy-efficient data centers. Similarly, Vertiv agreed in September 2026 to acquire UtilityInnovation Group for approximately USD 1.45 billion to add microgrid controls, on-site generation orchestration, and behind-the-meter power architecture that shorten time to power. Schneider Electric completed the acquisition of a 75% controlling interest in Motivair for USD 850 million in February 2025 to strengthen its liquid cooling portfolio for AI data centers. These investments and strategic transactions demonstrate the increasing emphasis on energy-efficient, low-carbon, and rapidly deployable power and cooling infrastructure across the green data center ecosystem.

Revenue Shift Context

The market is shifting from conventional, energy-intensive data center infrastructure toward energy-efficient, low-carbon, and sustainability-oriented architectures as operators seek to reduce power consumption, operating costs, and carbon emissions. The rapid growth of AI and high-performance computing is accelerating this transition by increasing power density and cooling requirements, creating greater demand for efficient power distribution, advanced thermal management, renewable energy integration, and intelligent energy management. Technologies such as liquid cooling, high-efficiency UPS systems, renewable-powered generation, energy storage, and intelligent monitoring platforms are increasingly being integrated into data center infrastructure to improve energy utilization and support sustainability targets. Operators are also adopting modular and prefabricated solutions that improve deployment efficiency while incorporating energy-efficient power and cooling systems.

Revenue opportunities are consequently expanding beyond conventional energy-efficiency equipment toward integrated green infrastructure solutions, including renewable energy systems, liquid and immersion cooling, energy storage, high-efficiency power systems, AI-enabled energy management, DCIM platforms, carbon monitoring, and heat recovery technologies. The growing deployment of high-density AI infrastructure is particularly increasing demand for liquid cooling, optimized power architectures, and real-time energy monitoring capable of maintaining performance while controlling energy consumption.

Mergers and Acquisitions

Mergers, acquisitions, and strategic investments are increasingly shaping the Green Data Center Market as infrastructure providers seek to strengthen capabilities across energy-efficient power systems, advanced cooling, renewable energy integration, and intelligent energy management. Recent activity is focused on expanding sustainable technology portfolios, enhancing vertical integration across critical infrastructure components, and accelerating the development and deployment of energy-efficient solutions for AI-ready and high-density data center environments.

GREEN DATA CENTER MARKET: MERGERS AND ACQUISITIONS, AUGUST 2025–SEPTEMBER 2026

Month and Year

Deal Type

Company 1

Company 2

Description

September 2026

Acquisition

Eaton (Ireland)

COL Group (Italy) (from Oaktree)

Eaton signed a deal to buy COL Group at an enterprise value of about EUR 810 million. COL makes medium-voltage distribution equipment, including SF6-free switchgear, grid automation, and modular power systems. The deal expands Eaton’s European manufacturing for data center and utility customers.

September 2026

Acquisition

Vertiv (US)

King Environmental Services (KES) (Ireland)

Vertiv agreed to buy this Europe-based provider of fluid management, commissioning, and load-testing services for liquid-cooled data centers. It extends Vertiv’s thermal services into EMEA, building on PurgeRite in North America.

April 2026

Acquisition

Vertiv (US)

BMarko Structures (US)

Vertiv acquired BMarko to bring structural fabrication in-house and expand capacity for manufactured, prefabricated, and converged infrastructure solutions.

November 2025

Acquisition

Eaton (Ireland)

Boyd Thermal (US)

Eaton announced the USD 9.5 billion purchase of Boyd’s thermal business, which closed on March 12, 2026. It adds liquid cooling and thermal components for data centers, and about 80% of Boyd’s business serves that market.

Company Revenue Share Details

The global Green Data Center Market is led by established power, cooling, and electrical infrastructure providers competing across energy-efficient power distribution, power backup and energy storage, green air and liquid cooling, and DCIM and energy management software. Major participants include Schneider Electric, Vertiv, Eaton, ABB, and Hitachi Energy, alongside other global and regional players such as Daikin, Delta Electronics, Siemens, Carrier, and STULZ. Competition is increasingly shaped by the ability to offer integrated power and cooling portfolios that lower PUE, support renewable and low-carbon power integration, and handle the higher rack densities of AI workloads.

Competition is also shifting toward vertical integration and end-to-end offerings that span grid interconnect to chip. Recent transactions demonstrate this focus on liquid cooling, thermal management, and sustainable power distribution. For example, Eaton’s USD 9.5 billion acquisition of Boyd Thermal added liquid cooling capabilities. Its agreement to acquire COL Group (EUR 810 million enterprise value) adds SF6-free medium-voltage switchgear.

Browse Adjacent Markets Data Center and Networking Market Research Reports & Consulting

Related Market Reports:

Data Center Rack Market by Rack Type (Open Frame, Enclosed), Type (Server Racks, Network Racks), Rack Height (42U & Below, 43U up to 52U), Rack Width (19 Inch, 23 Inch), Data Center Type (Enterprise, Colocation, Hyperscale) – Global Forecast to 2030

Data Center Solutions Market by Infrastructure [Power (Critical Power, Backup, Distribution), Mechanical & Cooling (Air Cooled, Liquid Cooling, Heat Pumps), IT (Server, Storage, Networking), Physical (Racks, Cables)], Software – Forecast to 2031

About MarketsandMarkets™  

MarketsandMarkets™ has been recognized as one of America’s Best Management Consulting Firms by Forbes, as per their recent report.

MarketsandMarkets™ is a blue ocean alternative in growth consulting and program management, leveraging a man-machine offering to drive supernormal growth for progressive organizations in the B2B space. With the widest lens on emerging technologies, we are proficient in co-creating supernormal growth for clients across the globe.

Today, 80% of Fortune 2000 companies rely on MarketsandMarkets, and 90 of the top 100 companies in each sector trust us to accelerate their revenue growth. With a global clientele of over 13,000 organizations, we help businesses thrive in a disruptive ecosystem.

The B2B economy is witnessing the emergence of $25 trillion in new revenue streams that are replacing existing ones within this decade. We work with clients on growth programs, helping them monetize this $25 trillion opportunity through our service lines – TAM Expansion, Go-to-Market (GTM) Strategy to Execution, Market Share Gain, Account Enablement, and Thought Leadership Marketing.

Built on the ‘GIVE Growth’ principle, we collaborate with several Forbes Global 2000 B2B companies to keep them future-ready. Our insights and strategies are powered by industry experts, cutting-edge AI, and our Market Intelligence Cloud, KnowledgeStore™, which integrates research and provides ecosystem-wide visibility into revenue shifts.

MarketsandMarkets™ SalesPlay is an AI-driven Revenue Intelligence Co-Pilot designed to help revenue teams prioritize the right accounts, identify critical changes early, and surface opportunities ahead of demand, so pipeline builds naturally and deals close with greater consistency.

To find out more, visit www.MarketsandMarkets™.com or follow us on Twitter, LinkedIn and Facebook.

Contact:
Mr. Rohan Salgarkar
MarketsandMarkets™ INC.
1615 South Congress Ave.
Suite 103, Delray Beach, FL 33445
USA: +1-888-600-6441
Email: sales@marketsandmarkets.com
Visit Our Website: https://www.marketsandmarkets.com/
Content Source: https://www.marketsandmarkets.com/PressReleases/green-data-center-gdc.asp

View original content to download multimedia:https://www.prnewswire.co.uk/news-releases/green-data-center-market-worth-197-02-billion-by-2031–report-by-marketsandmarkets-302912615.html

Continue Reading

Trending