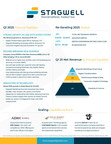
Q1 YoY Revenue Decline of 3%, Q1 YoY Net Revenue Growth of 6%
Q1 YoY Net Revenue Growth excluding Advocacy of 9%, Digital Transformation Net Revenue ex. Advocacy Growth of 15%
Q1 Net Loss Attributable to Stagwell Inc. Common Shareholders of $3 million; Q1 Adjusted EBITDA of $81 million; Adjusted EBITDA Margin of 14%
Q1 EPS of $(0.04); Adjusted EPS of $0.12
Net New Business of $130 million in Q1; LTM Net New Business of $446 million
Reiterate Guidance for 2025 of Total Net Revenue Growth of ~8%; Adjusted EBITDA of $410 million to $460 million; Free Cash Flow Conversion in excess of 45%
NEW YORK, May 8, 2025 /PRNewswire/ — (NASDAQ: STGW) – Stagwell Inc. (“Stagwell”) today announced financial results for the quarter and three months ended March 31, 2025.
FIRST QUARTER RESULTS:
Q1 Revenue of $652 million, a decrease of 3% versus the prior year period;Q1 Revenue ex. Advocacy of $610 million, an increase of 1% versus the prior year period;Q1 Net Revenue of $564 million, an increase of 6% versus the prior year period;Q1 Net Revenue ex. Advocacy of $535 million, an increase of 9% versus the prior year period;Q1 Net Loss attributable to Stagwell Inc. Common Shareholders of $3 million versus $1 million in the prior year period;Q1 Adjusted EBITDA of $81 million, a decrease of 11% versus the prior year period;Q1 Adjusted EBITDA Margin of 14% on net revenue;Q1 Earnings Per Share Attributable to Stagwell Inc. Common Shareholders of $(0.04) versus $(0.01) in the prior year period;Q1 Adjusted Earnings Per Share attributable to Stagwell Inc. Common Shareholders of $0.12 versus $0.16 in the prior year period;Net new business of $130 million in the first quarter, last twelve-month net new business of $446 million
See “Non-GAAP Financial Measures” below for explanations and reconciliations of the Company’s non-GAAP financial measures.
Mark Penn, Chairman and CEO of Stagwell, said, “Despite the macro noise from tariffs, Stagwell’s first quarter results were in-line with our expectations, setting us up for a strong year ahead. Q1 is a low point in the political cycle and yet we delivered solid growth in the quarter, led by double-digit increases in our Digital Transformation, Creativity and Stagwell Marketing Cloud capabilities. We hit a record $130M of net new business and, consequently, we remain optimistic about our outlook for the rest of the year.”
Frank Lanuto, Chief Financial Officer, commented: “Stagwell delivered solid first quarter results. We reported 9% total net revenue growth excluding advocacy, while posting $81 million in adjusted EBITDA as we effectively managed costs. Additionally, we have made significant progress in simplifying our capital structure and refinancing our revolving credit facility. Our results and these actions position us well for the year ahead.”
Financial Outlook
2025 financial guidance is reiterated as follows:
Total Net Revenue growth of approximately 8%Adjusted EBITDA of $410 million to $460 millionFree Cash Flow Conversion in excess of 45%Adjusted EPS of $0.75 – $0.88Guidance includes anticipated impact from acquisitions or dispositions.
* The Company has excluded a quantitative reconciliation with respect to the Company’s 2025 guidance under the “unreasonable efforts” exception in Item 10(e)(1)(i)(B) of Regulation S-K. See “Non-GAAP Financial Measures” below for additional information.
Video Webcast
Management will host a video webcast on Thursday, May 8, 2025, at 8:30 a.m. (ET) to discuss results for Stagwell Inc. for the quarter and three months ended March 31, 2025. The video webcast will be accessible at https://bit.ly/436rkSP. An investor presentation has been posted on our website at www.stagwellglobal.com and may be referred to during the webcast.
A recording of the webcast will be accessible one hour after the webcast and available for ninety days at www.stagwellglobal.com.
Stagwell Inc.
Stagwell is the challenger network built to transform marketing. We deliver scaled creative performance for the world’s most ambitious brands, connecting culture-moving creativity with leading-edge technology to harmonize the art and science of marketing. Led by entrepreneurs, our specialists in 45+ countries are unified under a single purpose: to drive effectiveness and improve business results for their clients. Join us at www.stagwellglobal.com.
Contacts
For Investors:
Ben Allanson
IR@stagwellglobal.com
For Press:
Beth Sidhu
PR@stagwellglobal.com
Non-GAAP Financial Measures
In addition to its reported results, Stagwell Inc. has included in this earnings release certain financial results that the Securities and Exchange Commission (SEC) defines as “non-GAAP Financial Measures.” Management believes that such non-GAAP financial measures, when read in conjunction with the Company’s reported results, can provide useful supplemental information for investors analyzing period to period comparisons of the Company’s results. Such non-GAAP financial measures include the following:
(1) Net New Business: Estimate of annualized revenue for new wins less annualized revenue for losses incurred in the period.
(2) Adjusted EBITDA: defined as Net income excluding non-operating income or expense to achieve operating income, plus depreciation and amortization, stock-based compensation, deferred acquisition consideration adjustments, and other items. Other items include restructuring costs, acquisition-related expenses, and non-recurring items.
(3) Adjusted Diluted EPS is defined as (i) Net income (loss) attributable to Stagwell Inc. common shareholders, plus net income attributable to Class C shareholders, excluding amortization expense, impairment and other losses, stock-based compensation, deferred acquisition consideration adjustments, discrete tax items, and other items, divided by (ii) (a) the per weighted average number of common shares outstanding plus (b) the weighted average number of Class C shares outstanding, (if dilutive). Other items includes restructuring costs, acquisition-related expenses, and non-recurring items, and subject to the anti-dilution rules.
(5) Free Cash Flow: defined as Adjusted EBITDA less capital expenditures, change in net working capital, cash taxes, interest, and distributions to minority interests, but excludes contingent M&A payments. Free Cash Flow Conversion is the percentage of adjusted EBITDA.
Included in this earnings release are tables reconciling reported Stagwell Inc. results to arrive at certain of these non-GAAP financial measures.
This document contains forward-looking statements within the meaning of Section 27A of the Securities Act of 1933, as amended (the “Securities Act”), and Section 21E of the Securities Exchange Act of 1934, as amended (the “Exchange Act”). The Company’s representatives may also make forward-looking statements orally or in writing from time to time. Statements in this document that are not historical facts, including, statements about the Company’s beliefs and expectations, future financial performance, growth, and future prospects, the Company’s strategy, business and economic trends and growth, technological leadership and differentiation, potential and completed acquisitions, anticipated and actual operating efficiencies and synergies and estimates of amounts for redeemable noncontrolling interests and deferred acquisition consideration, constitute forward-looking statements. Forward-looking statements, which are generally denoted by words such as “ability,” “aim,” “anticipate,” “assume,” “believe,” “build,” “consider,” “continue,” “could,” “develop,” “drive,” “estimate,” “expect,” “focus,” “forecast,” “future,” “guidance,” “intend,” “likely,” “maintain,” “may,” “ongoing,” “opportunity,” “outlook,” “plan,” “possible,” “potential,” “probable,” “project,” “seek,” “should,” “target,” “will,” “would” or the negative of such terms or other variations thereof and terms of similar substance used in connection with any discussion of current plans, estimates and projections are subject to change based on a number of factors, including those outlined in this section.
Forward-looking statements in this document are based on certain key expectations and assumptions made by the Company. Although the management of the Company believes that the expectations and assumptions on which such forward-looking statements are based are reasonable, undue reliance should not be placed on the forward-looking statements because the Company can give no assurance that they will prove to be correct. The material assumptions upon which such forward-looking statements are based include, among others, assumptions with respect to general business, economic and market conditions, the competitive environment, anticipated and unanticipated tax consequences and anticipated and unanticipated costs. These forward-looking statements are based on current plans, estimates and projections, and are subject to change based on a number of factors, including those outlined in this section. These forward-looking statements are subject to various risks and uncertainties, many of which are outside the Company’s control. Therefore, you should not place undue reliance on such statements. Forward-looking statements speak only as of the date they are made, and the Company undertakes no obligation to update publicly any of them in light of new information or future events, if any.
Forward-looking statements involve inherent risks and uncertainties. A number of important factors could cause actual results to differ materially from those contained in any forward-looking statements. Such risk factors include, but are not limited to, the following:
risks associated with international, national and regional unfavorable economic conditions, including the effect of changing tariff and other trade policies, inflation and other macroeconomic factors that could affect the Company or its clients;demand for the Company’s services, which may precipitate or exacerbate other risks and uncertainties;inflation and actions taken by central banks to counter inflation;the Company’s ability to attract new clients and retain existing clients;the impact of a reduction in client spending and changes in client advertising, marketing and corporate communications requirements;financial failure of the Company’s clients;the Company’s ability to retain and attract key employees;the Company’s ability to compete in the markets in which it operates;the Company’s ability to achieve its cost saving initiatives;the Company’s implementation of strategic initiatives;the Company’s ability to remain in compliance with its debt agreements and the Company’s ability to finance its contingent payment obligations when due and payable, including but not limited to those relating to redeemable noncontrolling interests and deferred acquisition consideration;the Company’s ability to manage its growth effectively;the Company’s ability to identify and complete acquisitions or other strategic transactions that complement and expand the Company’s business capabilities and successfully integrate newly acquired businesses into the Company’s operations, retain key employees, and realize cost savings, synergies and other related anticipated benefits within the expected time period;the Company’s ability to identify and complete divestitures and to achieve the anticipated benefits therefrom;the Company’s ability to develop products incorporating new technologies, including augmented reality, artificial intelligence, and virtual reality, and realize benefits from such products;the Company’s use of artificial intelligence, including generative artificial intelligence;adverse tax consequences for the Company, its operations and its stockholders, that may differ from the expectations of the Company, including that future changes in tax laws, potential increases to corporate tax rates in the United States and disagreements with tax authorities on the Company’s determinations that may result in increased tax costs;adverse tax consequences in connection with the business combination that formed the Company in August 2021, including the incurrence of material Canadian federal income tax (including material “emigration tax”);the Company’s ability to maintain an effective system of internal control over financial reporting, including the risk that the Company’s internal controls will fail to detect misstatements in its financial statements;the Company’s ability to accurately forecast its future financial performance and provide accurate guidance;the Company’s ability to protect client data from security incidents or cyberattacks;economic disruptions resulting from war and other economic and geopolitical tensions (such as the ongoing military conflicts between Russia and Ukraine and in the Middle East), terrorist activities, natural disasters, public health events and tariff and trade policies;stock price volatility; andforeign currency fluctuations.
Investors should carefully consider these risk factors, other risk factors described herein, and the additional risk factors outlined in more detail in our 2024 Form 10-K, filed with the Securities and Exchange Commission (the “SEC”) on March 11, 2025, and accessible on the SEC’s website at www.sec.gov, under the caption “Risk Factors,” and in the Company’s other SEC filings.
SCHEDULE 1
STAGWELL INC.
UNAUDITED CONSOLIDATED STATEMENTS OF OPERATIONS
(amounts in thousands, except per share amounts)
Three Months Ended March 31,
2025
2024
Revenue
$ 651,740
$ 670,059
Operating Expenses
Cost of services
412,087
444,526
Office and general expenses
179,362
163,343
Depreciation and amortization
42,006
34,836
Impairment and other losses
—
1,500
633,455
644,205
Operating Income
18,285
25,854
Other income (expenses):
Interest expense, net
(23,356)
(20,965)
Foreign exchange, net
1,220
(2,258)
Other, net
249
(1,267)
(21,887)
(24,490)
Income (loss) before income taxes and equity in earnings of non-consolidated affiliates
(3,602)
1,364
Income tax expense
1,722
2,585
Loss before equity in earnings of non-consolidated affiliates
(5,324)
(1,221)
Equity in income (loss) of non-consolidated affiliates
(1)
508
Net loss
(5,325)
(713)
Net (income) loss attributable to noncontrolling and redeemable noncontrolling interests
2,408
(569)
Net loss attributable to Stagwell Inc. common shareholders
$ (2,917)
$ (1,282)
Loss Per Common Share:
Basic
$ (0.03)
$ (0.01)
Diluted
$ (0.04)
$ (0.01)
Weighted Average Number of Common Shares Outstanding:
Basic
112,088
112,633
Diluted
263,737
116,405
SCHEDULE 3
STAGWELL INC.
UNAUDITED SEGMENT OPERATING RESULTS
(amounts in thousands)
For the Three Months Ended March 31, 2025
Integrated
Agencies
Network
Brand
Performance
Network
Communications
Network
All Other
Corporate
Total
Net Revenue
$ 325,794
$ 146,858
$ 66,998
$ 24,537
$ —
$ 564,187
Billable costs
51,560
15,360
20,630
3
—
87,553
Revenue
377,354
162,218
87,628
24,540
—
651,740
Billable costs
51,560
15,360
20,630
3
—
87,553
Staff costs
199,882
96,450
44,577
15,455
11,898
368,262
Administrative costs
31,644
23,407
10,174
8,225
1,659
75,109
Unbillable and other costs, net
17,099
15,458
490
7,187
—
40,234
Adjusted EBITDA (1)
77,169
11,543
11,757
(6,330)
(13,557)
80,582
Stock-based compensation
4,145
1,368
693
229
5,108
11,543
Depreciation and amortization
21,364
7,722
5,175
4,301
3,444
42,006
Deferred acquisition consideration
5,863
(1,282)
1,213
863
—
6,657
Other items, net (1)
(2,246)
3,654
128
311
244
2,091
Operating income (loss)
$ 48,043
$ 81
$ 4,548
$ (12,034)
$ (22,353)
$ 18,285
(1)
See Non-GAAP Financial Measures section above for the definition of Adjusted EBITDA and Other items, net.
SCHEDULE 4
STAGWELL INC.
UNAUDITED SEGMENT OPERATING RESULTS
(amounts in thousands)
For the Three Months Ended March 31, 2024
Integrated
Agencies
Network
Brand
Performance
Network
Communications
Network
All Other
Corporate
Total
Net Revenue
$ 292,772
$ 162,562
$ 67,488
$ 9,632
$ —
$ 532,454
Billable costs
59,947
51,400
26,258
—
—
137,605
Revenue
352,719
213,962
93,746
9,632
—
670,059
Billable costs
59,947
51,400
26,258
—
—
137,605
Staff costs
186,534
98,431
39,264
7,821
10,107
342,157
Administrative costs
30,602
22,071
8,704
3,209
2,577
67,163
Unbillable and other costs, net
15,528
14,566
136
2,588
—
32,818
Adjusted EBITDA (1)
60,108
27,494
19,384
(3,986)
(12,684)
90,316
Stock-based compensation
9,321
2,043
1,049
98
3,605
16,116
Depreciation and amortization
19,381
7,514
2,894
2,421
2,626
34,836
Deferred acquisition consideration
2,045
(777)
(1,114)
—
—
154
Impairment and other losses
1,500
—
—
—
—
1,500
Other items, net (1)
5,511
5,019
282
174
870
11,856
Operating income (loss)
$ 22,350
$ 13,695
$ 16,273
$ (6,679)
$ (19,785)
$ 25,854
(1)
See Non-GAAP Financial Measures section above for the definition of Adjusted EBITDA and Other items, net.
SCHEDULE 5
STAGWELL INC.
UNAUDITED RECONCILIATION OF ADJUSTED DILUTED EARNINGS PER SHARE (NON-GAAP MEASURE)
(amounts in thousands, except per share amounts)
For the Three Months Ended March 31, 2025
GAAP
Adjustments
Non-GAAP
Net income (loss) attributable to Stagwell Inc. common shareholders
$ (2,917)
$ 18,439
$ 15,522
Net income (loss) attributable to Class C shareholders
(6,637)
24,513
17,876
Net income (loss) attributable to Stagwell Inc. and Class C shareholders and adjusted net income
$ (9,554)
$ 42,952
$ 33,398
Weighted average number of common shares outstanding
112,088
9,462
121,550
Weighted average number of shares of Class C Common Stock outstanding
151,649
—
151,649
Weighted average number of shares outstanding
263,737
9,462
273,199
Diluted EPS and Adjusted Diluted EPS (1)
$ (0.04)
$ 0.12
Adjustments to Net Income (loss)
Amortization
$ 32,981
Stock-based compensation
11,543
Deferred acquisition consideration
6,657
Other items, net
2,091
53,272
Adjusted tax expense
(10,320)
$ 42,952
(1)
Adjusted Diluted EPS is defined within the Non-GAAP Financial Measures section of the Executive Summary.
SCHEDULE 6
STAGWELL INC.
UNAUDITED RECONCILIATION OF ADJUSTED DILUTED EARNINGS PER SHARE (NON-GAAP MEASURE)
(amounts in thousands, except per share amounts)
For the Three Months Ended March 31, 2024
GAAP
Adjustments
Non-GAAP
Net income (loss) attributable to Stagwell Inc. common shareholders
$ (1,506)
$ 19,480
$ 17,974
Net income attributable to Class C shareholders
—
24,554
24,554
Net income (loss) attributable to Stagwell Inc. and Class C shareholders and adjusted net income
$ (1,506)
$ 44,034
$ 42,528
Weighted average number of common shares outstanding
116,405
4,534
120,939
Weighted average number of shares of Class C Common Stock outstanding
—
151,649
151,649
Weighted average number of shares outstanding
116,405
156,183
272,588
Diluted EPS and Adjusted Diluted EPS (1)
$ (0.01)
$ 0.16
Adjustments to Net income (loss)
Amortization
$ 28,203
Impairment and other losses
1,500
Stock-based compensation
16,116
Deferred acquisition consideration
154
Other items, net
11,856
57,829
Adjusted tax expense
(12,748)
45,081
Net loss attributable to Class C shareholders
(1,047)
$ 44,034
Allocation of adjustments to Net income
Net income attributable to Stagwell Inc. common shareholders
$ 19,480
Net income attributable to Class C shareholders – add-backs
25,601
Net loss attributable to Class C shareholders
(1,047)
24,554
$ 44,034
(1)
Adjusted Diluted EPS is defined within the Non-GAAP Financial Measures section of the Executive Summary.
SCHEDULE 7
STAGWELL INC.
UNAUDITED CONSOLIDATED BALANCE SHEETS
(amounts in thousands)
March 31, 2025
December 31, 2024
ASSETS
Current Assets
Cash and cash equivalents
$ 137,653
$ 131,339
Accounts receivable, net
772,974
716,415
Expenditures billable to clients
163,702
173,194
Other current assets
147,163
114,200
Total Current Assets
1,221,492
1,135,148
Fixed assets, net
69,017
72,706
Right-of-use assets – operating leases
209,720
219,400
Goodwill
1,562,490
1,554,146
Other intangible assets, net
822,964
836,783
Other assets
96,671
90,038
Total Assets
$ 3,982,354
$ 3,908,221
LIABILITIES, REDEEMABLE NONCONTROLLING INTERESTS (“RNCI”), AND SHAREHOLDERS’ EQUITY
Current Liabilities
Accounts payable
$ 420,779
$ 449,347
Accrued media
295,964
245,883
Accruals and other liabilities
219,047
265,356
Advance billings
311,329
294,609
Current portion of lease liabilities – operating leases
56,390
60,195
Current portion of deferred acquisition consideration
37,336
51,906
Total Current Liabilities
1,340,845
1,367,296
Long-term debt
1,465,323
1,353,624
Long-term portion of deferred acquisition consideration
55,941
50,209
Long-term lease liabilities – operating leases
224,323
245,397
Deferred tax liabilities, net
47,323
47,239
Other liabilities
57,850
59,139
Total Liabilities
3,191,605
3,122,904
Redeemable Noncontrolling Interests
10,856
8,412
Commitments, Contingencies and Guarantees
Shareholders’ Equity
Common shares – Class A
114
115
Common shares – Class C
2
2
Paid-in capital
343,082
343,647
Retained earnings
10,504
11,740
Accumulated other comprehensive loss
(19,302)
(23,773)
Stagwell Inc. Shareholders’ Equity
334,400
331,731
Noncontrolling interests
445,493
445,174
Total Shareholders’ Equity
779,893
776,905
Total Liabilities, Redeemable Noncontrolling Interests and Shareholders’ Equity
$ 3,982,354
$ 3,908,221
SCHEDULE 8
STAGWELL INC.
UNAUDITED SUMMARY CASH FLOW DATA
(amounts in thousands)
Three Months Ended March 31,
2025
2024
Cash flows from operating activities:
Net loss
$ (5,325)
$ (713)
Adjustments to reconcile net income to cash used in operating activities:
Stock-based compensation
11,543
16,116
Depreciation and amortization
42,006
34,836
Amortization of right-of-use lease assets and lease liability interest
17,118
20,912
Impairment and other (gains) losses
(3,529)
1,500
Deferred income taxes
(747)
(655)
Adjustment to deferred acquisition consideration
6,657
154
Other, net
(2,060)
292
Changes in working capital:
Accounts receivable
(44,701)
(42,976)
Expenditures billable to clients
11,095
6,681
Other assets
(32,778)
(19,584)
Accounts payable
(35,287)
22,206
Accrued expenses and other liabilities
(19,075)
(63,856)
Advance billings
15,628
(6,124)
Current portion of lease liabilities – operating leases
(20,558)
(21,660)
Deferred acquisition related payments
—
(250)
Net cash used in operating activities
(60,013)
(53,121)
Cash flows from investing activities:
Capitalized software
(11,966)
(8,794)
Capital expenditures
(3,912)
(5,439)
Acquisitions, net of cash acquired
(1,090)
(11,673)
Other
(3,391)
(218)
Net cash used in investing activities
(20,359)
(26,124)
Cash flows from financing activities:
Repayment of borrowings under revolving credit facility
(432,000)
(417,000)
Proceeds from borrowings under revolving credit facility
543,000
540,000
Shares repurchased and cancelled
(11,068)
(29,698)
Distributions to noncontrolling interests
(581)
(559)
Payment of deferred consideration
(16,103)
(1,657)
Net cash provided by financing activities
83,248
91,086
Effect of exchange rate changes on cash and cash equivalents
3,438
(1,754)
Net increase in cash and cash equivalents
6,314
10,087
Cash and cash equivalents at beginning of period
131,339
119,737
Cash and cash equivalents at end of period
$ 137,653
$ 129,824
View original content to download multimedia:https://www.prnewswire.com/news-releases/stagwell-inc-nasdaq-stgw-reports-results-for-the-three-months-ended-march-31-2025-302449920.html
SOURCE Stagwell Inc.


 Technology5 days ago
 Technology5 days ago
 Technology5 days ago
 Technology5 days ago
 Technology5 days ago
 Coin Market4 days ago
 Technology5 days ago