
Technology
Garmin announces first quarter 2026 results

Published
4 months agoon
By

Company reports record first quarter revenue and operating income
SCHAFFHAUSEN, Switzerland, April 29, 2026 /PRNewswire/ — Garmin® Ltd. (NYSE: GRMN), today announced results for the first quarter ended March 28, 2026.
Highlights for first quarter 2026 include:
Record consolidated revenue of approximately $1.75 billion, a 14% increase compared to the prior year quarterGross and operating margins expanded to 59.4% and 24.6% respectively, compared to the prior year quarterRecord operating income of $432 million, a 30% increase compared to the prior year quarterGAAP EPS of $2.09 and pro forma EPS(1) of $2.08, representing a 29% increase in pro forma EPS compared to the prior year quarterPublished our 2025 Garmin inReach® SOS Report, highlighting the important role served by inReach devices in remote communications and emergency response coordination around the globeFenix® 8 Pro was officially recognized as the “Best Connected Device” at the 2026 Mobile World Congress in Barcelona
(In thousands, except per share information)
13-Weeks Ended
March 28,
March 29,
YoY
2026
2025
Change
Net sales
$
1,753,489
$
1,535,099
14 %
Fitness
546,822
384,722
42 %
Outdoor
417,530
438,496
(5) %
Aviation
263,841
223,114
18 %
Marine
355,016
319,438
11 %
Auto OEM
170,280
169,329
1 %
Gross profit
1,042,289
884,545
18 %
Gross margin %
59.4
%
57.6
%
Operating Income
431,665
332,824
30 %
Operating income %
24.6
%
21.7
%
GAAP diluted EPS
$
2.09
$
1.72
22 %
Pro forma diluted EPS(1)
$
2.08
$
1.61
29 %
(1) See attached Non-GAAP Financial Information for discussion and reconciliation of non-GAAP financial measures,
including pro forma diluted EPS
Executive Overview from Cliff Pemble, President and Chief Executive Officer:
“We achieved remarkable financial results during the opening quarter of 2026 in a continuation of the positive trends we have been experiencing over the long term. This strong financial performance is a direct reflection of our impressive lineup of products that are essential to our customers’ lives, and our unique, highly diversified business model. We are very pleased with our results so far, and we look forward to the opportunities ahead as the year continues to unfold.” – Cliff Pemble, President and Chief Executive Officer of Garmin Ltd.
Fitness:
Revenue from the fitness segment increased 42% in the first quarter with growth across all product categories, led by strong demand for advanced wearables. Gross and operating margins were 62% and 29%, respectively, resulting in $158 million of operating income. During the quarter, we launched the VariaTM RearVue 820, our brightest and most powerful radar tail light for cyclists. We also announced a new Connect IQTM messaging app for select smartwatches that allows customers to read, reply and react to WhatsApp messages right from their wrist, and the integration of select wearables with the Natural Cycles birth control and cycle tracking app, empowering women to better understand and manage their reproductive health.
Outdoor:
Revenue from the outdoor segment decreased 5% in the first quarter as we compared against a strong prior year quarter which included the launch of the Instinct® 3 smartwatch family. Gross and operating margins were 67% and 28%, respectively, resulting in $119 million of operating income. During the quarter, we released the Approach® G82 premium GPS handheld with a built-in launch monitor, and the Approach J1, our first GPS watch specifically designed for junior golfers. Also during the quarter, we launched the zūmo® XT3, our newest and most advanced motorcycle-focused GPS device, and CatalystTM 2, a compact device for motorsports that helps high-performance drivers achieve faster times on the track.
Aviation:
Revenue from the aviation segment increased 18% in the first quarter with growth in both the OEM and aftermarket product categories. Gross and operating margins were 75% and 27%, respectively, resulting in $71 million of operating income. During the quarter, Daher unveiled their new TBM 980 single engine turboprop aircraft featuring our G3000® PRIME avionics suite. Also, the HondaJet Elite II was certified by the FAA becoming the first twin-turbine business jet with Garmin Emergency Autoland technology.
Marine:
Revenue from the marine segment increased 11% in the first quarter with broad-based growth across multiple categories. Gross and operating margins were 56% and 26%, respectively, resulting in $91 million of operating income. During the quarter, we launched a new 360-degree scanning sonar system with the revolutionary SpyTM pole, allowing anglers to see a birds-eye view of fish and underwater structure in every direction. Also, we launched the quatix® 8 Pro, our purpose-built nautical smartwatch with inReach technology for two-way satellite and cellular connectivity.
Auto OEM:
Revenue from the auto OEM segment increased 1% during the first quarter with growth primarily driven by infotainment programs. The operating loss narrowed to $6 million in the quarter due to gross profit improvement and lower research and development expenses.
Additional Financial Information:
Total operating expenses in the first quarter were $611 million, a 11% increase over the prior year. Research and development and selling, general and administrative expenses increased 10% and 11%, respectively, driven primarily by personnel related costs.
The effective tax rate in the first quarter was 14.3%, which is comparable to the effective tax rate of 14.5% in the prior year quarter.
In the first quarter of 2026, we generated operating cash flows of $536 million and free cash flow(1) of $469 million. We paid a quarterly dividend of $174 million and repurchased $40 million of the Company’s shares within the quarter, of which $9 million was from the $500 million share repurchase program authorized through December 2028, leaving $491 million remaining in that repurchase program as of March 28, 2026. We ended the quarter with cash and marketable securities of approximately $4.3 billion.
(1)
See attached Non-GAAP Financial Information for discussion and reconciliation of non-GAAP financial measures,
including pro forma effective tax rate and free cash flow.
Fiscal Year 2026 Guidance:
We are maintaining our fiscal year 2026 guidance of approximately $7.9 billion revenue and pro forma EPS of $9.35 (see attached discussion on Forward-looking Financial Measures).
Dividend Recommendation:
As announced in February 2026, the Board will recommend to the shareholders for approval at the annual meeting to be held on June 5, 2026, a cash dividend in the total amount of $4.20 per share payable in four equal quarterly installments.
Webcast Information/Forward-Looking Statements:
The information for Garmin Ltd.’s earnings call is as follows:
When:
Wednesday, April 29, 2026 10:30 a.m. Eastern
Where:
Join a live stream of the call at the following link
https://www.garmin.com/en-US/investors/events/
An archive of the live webcast will be available until April 28, 2027 on the Garmin website at www.garmin.com. To access the replay, click on the Investors link and click over to the Events page.
This release includes projections and other forward-looking statements regarding Garmin Ltd. and its business that are commonly identified by words such as “anticipates,” “would,” “may,” “expects,” “estimates,” “plans,” “intends,” “projects,” and other words or phrases with similar meanings. Any statements regarding the Company’s expected fiscal 2026 GAAP and pro forma estimated earnings, EPS, and effective tax rate, and the Company’s expected segment revenue growth rates, consolidated revenue, gross margins, operating margins, tariffs and other global trade related impacts, potential future acquisitions, share repurchase programs, currency movements, expenses, pricing, new product launches, market reach, statements relating to possible future dividends, and the Company’s plans and objectives are forward-looking statements. The forward-looking events and circumstances discussed in this release may not occur and actual results could differ materially as a result of risk factors and uncertainties affecting Garmin, including, but not limited to, the risk factors that are described in the Annual Report on Form 10-K for the year ended December 27, 2025 filed by Garmin with the Securities and Exchange Commission (Commission file number 001-41118). A copy of Garmin’s 2025 Form 10-K can be downloaded from https://www.garmin.com/en-US/investors/sec/. All information provided in this release and in the attachments is as of March 28, 2026. We undertake no duty to update this information unless required by law.
This release and the attachments contain non-GAAP financial measures. A reconciliation to the nearest GAAP measure and a discussion of the Company’s use of these measures are included in the attachments.
Garmin, the Garmin logo, the Garmin delta, Approach, fēnix, inReach, G3000, Instinct, and zumo are trademarks of Garmin Ltd. or its subsidiaries and are registered in one or more countries, including the U.S. Connect IQ, Varia, Catalyst, and Spy are trademarks of Garmin Ltd. or its subsidiaries. Garmin Response is a service mark of Garmin Ltd. or its subsidiaries. All other brands, product names, company names, trademarks and service marks are the properties of their respective owners. All rights reserved.
Investor Relations Contact:
Media Relations Contact:
Teri Seck
Krista Klaus
913/397-8200
913/397-8200
Garmin Ltd. and Subsidiaries
Condensed Consolidated Statements of Income (Unaudited)
(In thousands, except per share information)
13-Weeks Ended
March 28,
March 29,
2026
2025
Net sales
$
1,753,489
$
1,535,099
Cost of goods sold
711,200
650,554
Gross profit
1,042,289
884,545
Research and development expense
295,818
268,120
Selling, general and administrative expenses
314,806
283,601
Total operating expense
610,624
551,721
Operating income
431,665
332,824
Other income (expense):
Interest income
35,974
30,507
Foreign currency gains
3,122
24,760
Other income
1,768
987
Total other income (expense)
40,864
56,254
Income before income taxes
472,529
389,078
Income tax provision
67,451
56,309
Net income
$
405,078
$
332,769
Net income per share:
Basic
$
2.10
$
1.73
Diluted
$
2.09
$
1.72
Weighted average common shares outstanding:
Basic
192,674
192,544
Diluted
193,565
193,717
Garmin Ltd. and Subsidiaries
Condensed Consolidated Balance Sheets (Unaudited)
(In thousands)
March 28,
2026
December 27,
2025
Assets
Current assets:
Cash and cash equivalents
$
2,289,916
$
2,278,646
Marketable securities
411,034
459,202
Accounts receivable, net
940,959
1,253,015
Inventories
1,850,282
1,772,257
Deferred costs
15,324
17,538
Prepaid expenses and other current assets
489,654
467,558
Total current assets
5,997,169
6,248,216
Property and equipment, net
1,383,770
1,375,348
Operating lease right-of-use assets
203,390
196,183
Noncurrent marketable securities
1,612,323
1,396,929
Deferred income tax assets
721,894
718,094
Noncurrent deferred costs
4,046
4,373
Goodwill
750,633
760,241
Other intangible assets, net
186,866
198,362
Other noncurrent assets
92,347
95,923
Total assets
$
10,952,438
$
10,993,669
Liabilities and Stockholders’ Equity
Current liabilities:
Accounts payable
$
344,724
$
347,493
Salaries and benefits payable
224,693
228,267
Accrued warranty costs
70,932
72,921
Accrued sales program costs
92,504
153,193
Other accrued expenses
233,248
257,651
Deferred revenue
100,843
105,646
Income taxes payable
308,301
381,549
Dividend payable
—
173,351
Total current liabilities
1,375,245
1,720,071
Deferred income tax liabilities
111,744
109,701
Noncurrent income taxes payable
3,645
3,596
Noncurrent deferred revenue
22,530
22,277
Noncurrent operating lease liabilities
167,612
164,835
Other noncurrent liabilities
638
625
Stockholders’ equity:
Common shares, $0.10 par value (194,901 and 194,901 shares authorized and
issued; 192,901 and 192,620 shares outstanding)
19,490
19,490
Additional paid-in capital
2,335,119
2,368,670
Treasury shares (1,998 and 2,281 shares)
(415,600)
(406,423)
Retained earnings
7,374,974
6,970,182
Accumulated other comprehensive income (loss)
(42,959)
20,645
Total stockholders’ equity
9,271,024
8,972,564
Total liabilities and stockholders’ equity
$
10,952,438
$
10,993,669
Garmin Ltd. and Subsidiaries
Condensed Consolidated Statements of Cash Flows (Unaudited)
(In thousands)
13-Weeks Ended
March 28, 2026
March 29, 2025
Operating Activities:
Net income
$
405,078
$
332,769
Adjustments to reconcile net income to net cash provided by
operating activities:
Depreciation
40,418
37,463
Amortization
8,707
8,835
Loss (gain) on sale or disposal of property and equipment
42
(15)
Unrealized foreign currency losses (gains)
1,525
(38,983)
Deferred income taxes
3,301
(11,593)
Stock compensation expense
43,323
37,772
Realized (gains) losses on marketable securities
(318)
98
Changes in operating assets and liabilities, net of acquisitions:
Accounts receivable, net of allowance for doubtful accounts
301,791
213,089
Inventories
(95,064)
(102,239)
Other current and noncurrent assets
(29,068)
(17,510)
Accounts payable
3,407
(12,629)
Other current and noncurrent liabilities
(90,378)
(57,318)
Deferred revenue
(4,483)
(8,160)
Deferred costs
2,543
4,102
Income taxes
(54,836)
35,107
Net cash provided by operating activities
535,988
420,788
Investing activities:
Purchases of property and equipment
(66,617)
(40,062)
Purchase of marketable securities
(333,342)
(179,827)
Redemption of marketable securities
147,896
88,788
Net payments for acquisitions
—
(2,100)
Other investing activities, net
(307)
599
Net cash used in investing activities
(252,370)
(132,602)
Financing activities:
Dividends
(173,637)
(144,566)
Purchase of treasury shares related to equity awards
(46,839)
(33,144)
Purchase of treasury shares under share repurchase plan
(39,577)
(27,098)
Net cash used in financing activities
(260,053)
(204,808)
Effect of exchange rate changes on cash and cash equivalents
(12,286)
12,672
Net increase in cash, cash equivalents, and restricted cash
11,279
96,050
Cash, cash equivalents, and restricted cash at beginning of period
2,279,360
2,080,154
Cash, cash equivalents, and restricted cash at end of period
$
2,290,639
$
2,176,204
Garmin Ltd. and Subsidiaries
Net Sales, Gross Profit and Operating Income by Segment (Unaudited)
(In thousands)
Fitness
Outdoor
Aviation
Marine
Auto
OEM
Total
13-Weeks Ended March 28, 2026
Net sales
$
546,822
$
417,530
$
263,841
$
355,016
$
170,280
$
1,753,489
Gross profit
338,522
277,943
197,309
197,376
31,139
1,042,289
Operating income (loss)
157,620
118,791
70,934
90,757
(6,437)
431,665
13-Weeks Ended March 29, 2025
Net sales
$
384,722
$
438,496
$
223,114
$
319,438
$
169,329
$
1,535,099
Gross profit
220,142
282,536
167,902
183,933
30,032
884,545
Operating income (loss)
77,712
128,788
48,356
86,865
(8,897)
332,824
Garmin Ltd. and Subsidiaries
Net Sales by Geography (Unaudited)
(In thousands)
13-Weeks Ended
March 28,
March 29,
YoY
2026
2025
Change
Net sales
$
1,753,489
$
1,535,099
14 %
Americas
821,629
745,733
10 %
EMEA
656,844
568,953
15 %
APAC
275,016
220,413
25 %
Americas – North America & South America; EMEA – Europe, Middle East & Africa; APAC – Asia Pacific & Australian
Continent
Non-GAAP Financial Information
To supplement our financial results presented in accordance with GAAP, this release includes the following measures defined by the Securities and Exchange Commission as non-GAAP financial measures: pro forma effective tax rate, pro forma net income (earnings) per share and free cash flow. These non-GAAP measures are not based on any comprehensive set of accounting rules or principles and should not be considered a substitute for, or superior to, financial measures calculated in accordance with GAAP, and may be different from non-GAAP measures used by other companies, limiting the usefulness of the measures for comparison with other companies. Management believes providing investors with an operating view consistent with how it manages the Company provides enhanced transparency into the operating results of the Company, as described in more detail by category below.
The tables below provide reconciliations between the GAAP and non-GAAP measures.
Pro forma effective tax rate
The Company’s income tax expense is occasionally impacted by discrete tax items that are not reflective of income tax expense incurred as a result of current period earnings. Therefore, management believes the effective tax rate and income tax provision before the effect of certain discrete tax items are important measures to permit investors’ consistent comparison between periods. In the first quarter of 2026 and 2025 there were no such discrete tax items identified.
Pro forma net income (earnings) per share
Management believes net income (earnings) per share before the impact of foreign currency gains or losses and certain discrete income tax items, as discussed above, is an important measure to permit a consistent comparison of the Company’s performance between periods.
(In thousands, except per share information)
13-Weeks Ended
March 28,
March 29,
2026
2025
GAAP net income
$
405,078
$
332,769
Foreign currency gains / losses(1)
(3,122)
(24,760)
Tax effect of foreign currency gains / losses(2)
446
3,583
Pro forma net income
$
402,402
$
311,592
GAAP net income per share:
Basic
$
2.10
$
1.73
Diluted
$
2.09
$
1.72
Pro forma net income per share:
Basic
$
2.09
$
1.62
Diluted
$
2.08
$
1.61
Weighted average common shares outstanding:
Basic
192,674
192,544
Diluted
193,565
193,717
(1) Foreign currency gains and losses for the Company are driven by movements of a number of currencies in relation to
the U.S. Dollar and the related exchange rate impact on the significant cash, receivables, and payables held in a currency
other than the functional currency at a given legal entity. However, there is minimal cash impact from such foreign currency
gains and losses.
(2) The tax effect of foreign currency gains was calculated using the effective tax rates of 14.3% for the 13-weeks ended
March 28, 2026 and 14.5% for the 13-weeks ended March 29, 2025.
Free cash flow
Management believes free cash flow is an important liquidity measure because it represents the amount of cash provided by operations that is available for investing and defines it as operating cash flows less capital expenditures for property and equipment. Management believes excluding purchases of property and equipment provides a better understanding of the underlying trends in the Company’s operations and allows more accurate comparisons of the Company’s results between periods. This metric may also be useful to investors but should not be considered in isolation as it is not a measure of cash flow available for discretionary expenditures. The most comparable GAAP measure is net cash provided by operating activities.
(In thousands)
13-Weeks Ended
March 28,
March 29,
2026
2025
Net cash provided by operating activities
$
535,988
$
420,788
Less: purchases of property and equipment
(66,617)
(40,062)
Free cash flow
$
469,371
$
380,726
Forward-looking Financial Measures
The forward-looking financial measures in our 2026 guidance include certain economic assumptions such as foreign currency exchange rates and tariffs which are fluid and can rapidly change favorably or unfavorably.
The forward-looking financial measures in our 2026 guidance provided above do not consider the potential future net effect of foreign currency exchange gains and losses, certain discrete tax items and any other impacts that may be identified as pro forma adjustments in calculating the non-GAAP measures described above.
The estimated impact of foreign currency gains and losses cannot be reasonably estimated on a forward-looking basis due to the high variability and low visibility with respect to non-operating foreign currency exchange gains and losses and the related tax effects of such gains and losses. The impact on diluted net income per share of foreign currency gains and losses, net of tax effects, was $0.01 per share for the 13-week period ended March 28, 2026.
At this time, management is unable to determine whether or not significant discrete tax items will occur in fiscal 2026, estimate the impact of any such items, or anticipate the impact of any other events that may be considered in the calculation of non-GAAP financial measures.
View original content to download multimedia:https://www.prnewswire.com/news-releases/garmin-announces-first-quarter-2026-results-302756584.html
SOURCE Garmin Ltd.

You may like
Technology
Midea Brings “Simply ideal” to Life at IFA 2026
Published
45 minutes agoon
September 4, 2026By
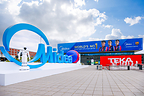
BERLIN, Sept. 4, 2026 /PRNewswire/ — At IFA 2026, Midea brings its “Simply ideal” vision to life through the latest innovations, designed to bring greater intelligence, comfort, efficiency and ease to the home.
The exhibition also highlights Midea’s new five-year partnership with FC Barcelona.
The Midea Suites: Ways to Master the Home
The new SMART MASTER showcases Midea’s AI-powered home ecosystem. The AI Agent enables more natural, intuitive interaction with appliances across daily household scenarios. Midea Robot brings AI into the physical world through cooking, cleaning, laundry, care and whole-home control.
At IFA 2026, Midea unveiled its new AI voice-controlled air conditioner. Cliff Liang, General Manager of Enterprise Commercial for the China Region at Microsoft, joined the Midea event and shared Microsoft’s perspective on the next phase of AI.
AI ECOMASTER coordinates appliances and connected systems through intelligent power management. It learns household routines and adapts to changing needs for greater flexibility and comfort.
For homes where every inch counts, SPACE MASTER delivers more usable capacity within the same external dimensions, as demonstrated by the refrigerator’s expanded storage.
Alongside the MASTER Suites, the BUILT-IN Series includes the Milanese-inspired Ispira Series, combining cohesive design with intelligent functionality for an integrated cooking experience.
The Midea Scenarios: Innovation for Everyday Living
Comfort begins with the air around us. Midea’s R290 Series responds to growing demand for efficient cooling. It combines advanced compressor and safety-sealing technologies with ultra-low-GWP R290 refrigerant, delivering around 10% higher energy efficiency. Residential applications include H-Pack and PortaSplit, with PortaSplit set to adopt R290 in 2027.
In the kitchen, technology simplifies daily routines, from food storage and cooking to after-meal care. The Visionary Series refrigerators make food easier to see and access through GlassVision, hands-free lighting and clear, even illumination.
The InfiniteFit Series hobs feature an ultra-slim design for seamless integration into European kitchens, while OmniFlex enables flexible cookware placement. The PizzaPro built-in oven combines rapid heating with an 81L cavity, balancing speed with capacity.
After the meal, the Tri-GreenApex System brings washing, drying and storage together while using around 50% less energy than required for Europe’s highest A rating.
Laundry brings its own everyday needs. Midea’s family laundry room concept combines multi-drum solutions for different garment-care needs, allowing separate loads to run at the same time. The OMNI SERIES offers flexible combinations to suit different household routines.
Tobin Richardson, President and CEO of the Connectivity Standards Alliance, introduced Matter at Midea’s booth, highlighting its open, secure, interoperable framework and Midea’s role in advancing smart appliance connectivity.
Partnership and Brand Portfolio
At IFA 2026, Midea celebrated its partnership through an immersive FC Barcelona experience at its booth. FC Barcelona legend Carles Puyol made a special appearance, sharing insights from his career on leadership, teamwork and the pursuit of excellence. His presence reflected Midea and FC Barcelona’s shared commitment to world-class performance.
As part of Midea Group’s multi-brand portfolio, TEKA presents its latest innovations under the “Meaningful Experiences Through Technology” concept, including its new coffee machine range, the In-Line Series and Laundry Care solutions, bringing European design and functionality to modern living.
About Midea and Midea Group
Midea is one of over 10 brands within the Smart Home Business of Midea Group.
Founded in 1968, Midea Group is a leading global technology company and one of the world’s largest home appliance manufacturers. As a Fortune Global 500 enterprise, it ranked No. 231 in 2026. The Group has streamlined its core operations into seven high-growth business pillars to drive future growth: Smart Home, Industrial Technologies, Building Technologies, KUKA, New Energy, Midea Healthcare, and ANNTO Logistics.
View original content to download multimedia:https://www.prnewswire.com/news-releases/midea-brings-simply-ideal-to-life-at-ifa-2026-302870435.html
SOURCE Midea Group
Technology
Cheche Group Reports First Half 2026 Unaudited Financial Results
Published
45 minutes agoon
September 4, 2026By

BEIJING, Sept. 4, 2026 /PRNewswire/ — Cheche Group Inc. (NASDAQ: CCG) (“Cheche”, “the Company” or “we”), China’s leading auto insurance technology platform, today announced its unaudited financial results for the six months ended June 30, 2026.
Key Business Highlights
Partnerships with New Energy Vehicle (NEV) companies numbered 18 in the first half 2026 and led to 1,049,000 policies with corresponding written premium of RMB3.2 billion (US$472.0 million), representing an increase of 29.5% and 23.7%, respectively, compared to the prior-year period.
Net revenues decreased 34.4% to RMB885.0 million (US$130.4 million) as we have been proactively restructuring business portfolio to focus on high-margin segments.
Gross margin increased to 6.5% from 4.9% in the prior-year period, driven by an improved business mix, with NEV premiums increasing to 31.0% of total written premiums from 22.5% in the prior-year period.
Management Comments
“In the first half of 2026, Cheche made meaningful progress in reshaping our business for the next phase of growth,” said Lei Zhang, Founder, CEO and Chairman of Cheche. “We made deliberate choices to shift away from lower-margin, less strategic revenue streams and concentrate our resources on the business and capabilities where we believe we can create greater long-term value through technology, data and differentiated solutions. As a result, while net revenues declined 34.4% to RMB885.0 million, gross margin expanded by 160 basis points, reflecting a fundamentally stronger revenue mix.
“This transformation is now visibly expressed in our recent launch of the ABAO Agent Family – a suite of five specialized AI agents, built on Cheche’s proprietary vertical insurance large language model that spans the full NEV insurance lifecycle from dynamic pricing to claims processing. Together with our Cheche Score and proprietary NEV intelligent pricing model, ABAO marks our strategic evolution from a digital insurance transaction platform into an AI-driven insurance infrastructure provider. These capabilities are deepening our relationships with insurance carrier partners, improving the economics of our core operations and expanding the ways in which our technology can be applied.
“Transformation requires discipline, and we remain focused on streamlining operations, strengthening our foundation and directing resources toward our highest-value opportunities. We are also exploring ways to broaden our platform and enhance the scale and resilience of our operations as we enter the next phase of our evolution. Our objective is to build a more diversified enterprise with the flexibility to pursue compelling opportunities while maintaining disciplined execution and a clear focus on shareholder value.”
Unaudited First Half Year 2026 Financial Results
Net Revenues were RMB885.0 million (US$130.4 million), representing a 34.4% year-over-year decrease from the prior-year period as a result of the restructuring of our business portfolio.
Cost of Revenues decreased 35.5% year-over-year to RMB827.6 million (US$122.0 million) from the prior-year period due to a decline in net revenues and higher gross margin driven by the restructuring of our business portfolio.
Gross profit decreased 12.6% to RMB57.5 million (US$8.5 million) compared to the prior-year period due to the decrease of net revenues, partially offset by the improved business structure which led to a higher gross margin.
Selling and Marketing Expenses decreased 4.3% to RMB35.6 million (US$5.3 million) from RMB37.3 million in the prior-year period, mainly due to the decrease in staff cost and share-based compensation expenses. Excluding share-based compensation expenses, selling and marketing expenses were RMB34.5 million (US$5.1 million), a decrease of 2.5% compared to the prior-year period.
General and Administrative Expenses increased 55.4% to RMB57.9 million (US$8.5 million) from RMB37.3 million for the prior-year period due to the recognition of RMB35.1 million (US$5.2 million) specific allowance of credit losses for long-aged and high-risk receivables, partially offset by the decrease in share-based compensation expenses and professional service fees. Excluding share-based compensation expenses, general and administrative expenses increased 112.7% year over year, from RMB26.6 million to RMB56.5 million (US$8.3 million).
Research and Development Expenses decreased 21.0% to RMB14.5 million (US$2.1 million) from RMB18.3 million in the prior-year period, mainly due to the decrease in staff costs and professional service fees. Excluding share-based compensation expenses, research and development expenses decreased 21.0% to RMB14.1 million (US$2.1 million) from RMB17.8 million in the prior-year period.
Total Operating Expenses increased 16.4% to RMB108.0 million (US$15.9 million) from RMB92.8 million in the prior-year period, mainly due to the recognition of specific allowance of credit losses for long-aged and high-risk receivables, partially offset by the decrease in staff cost, share-based compensation expenses and professional service fees. Excluding share-based compensation expenses, total operating expenses increased 31.8% to RMB105.1 million (US$15.5 million) from RMB79.8 million in the prior-year period.
Net Loss increased 72.3% to RMB44.1 million (US$6.5 million) from RMB25.6 million in the prior-year period. Excluding non-GAAP expenses, the Adjusted Net Loss increased 257.7% to RMB37.7 million (US$5.6 million) from RMB10.5 million in the prior-year period.
Net Loss Per Share, basic and diluted, was RMB18.57 (US$2.74), increasing RMB7.68 from a loss of RMB10.89 for the prior-year period.
Adjusted Net Loss Per Share, basic and diluted, was RMB15.89 (US$2.34), increasing RMB11.4 from a loss of RMB4.49 for the prior-year period.
First Half Year 2026 Business Developments
On January 29, 2026, Cheche announced that Volkswagen (Anhui) Digital Sales and Services Co., Ltd (“DSSO”), Beijing Cardif Airstar Property & Casualty Insurance Co., Ltd. (“Cardif Airstar Insurance”), and Cheche Group Inc. held a strategic cooperation signing ceremony on January 29, 2026. They will collaborate to develop digital insurance services for Volkswagen owners and expand into areas such as intelligent pricing, intelligent-driving insurance, and non-auto insurance. The partnership aims to establish a digital financial and insurance service system covering the full lifecycle of electric vehicle ownership.
On May 28, 2026, Cheche announced the official launch of its proprietary, AI large model-driven intelligent connected vehicle pricing product. Targeting China’s expanding market of approximately 20 million intelligent connected NEVs, the platform utilizes advanced machine learning and multi-dimensional data analytics. By analyzing real-time driving behavior, usage patterns, and localized risk scenarios, the technology delivers precise, personalized insurance pricing tailored to individual drivers.
On June 22, 2026, Cheche announced the official launch of “ABAO Agent,” an AI-powered intelligent underwriting agent. ABAO Agent is now commercially deployed in auto insurance renewal scenarios at scale. Its 24/7 autonomous capabilities allow the agent to independently execute the complete renewal workflow—customer outreach, needs identification, policy follow-up, and conversion—functions that previously required dedicated human teams. The result is a reduction in labor and operational costs for carrier partners, with no compromise to service continuity.
On June 24, 2026, Cheche announced the launch of “Cheche Score,” a proprietary AI-powered dynamic pricing solution for NEV insurance. Cheche Score is fully commercialized and functioning across multiple cities in China. Cheche has entered into dedicated AI-powered renewal cooperation agreements with several of China’s largest insurance carriers, jointly building a digital operating ecosystem that connects intelligent pricing, precision renewal, and closed-loop customer service.
On September 1, 2026, Cheche announced the launch of the ABAO Agent Family, a suite of five specialized AI agents built on Cheche’s proprietary vertical insurance large language model. Spanning the full NEV insurance lifecycle, from dynamic pricing optimization to claims processing and specialized diagnostics, the ABAO Agent Family marked Cheche’s strategic evolution from a digital insurance transaction platform into an AI-driven insurance infrastructure provider.
Balance Sheet
As of June 30, 2026, the Company had RMB173.7 million (US$25.6 million) in total cash and cash equivalents, restricted cash and short-term investments.
Business Outlook
For the full year 2026:
Cheche is revising its Net Revenue guidance to an approximate range of RMB1.5 billion to RMB1.8 billion, from the previously announced approximate range of RMB3.0 billion to RMB3.2 billion, to reflect the impact of its ongoing business restructuring.
Cheche is revising its NEV Written Premiums Placed guidance to an approximate range of RMB8.0 billion to RMB10.0 billion from the previously announced approximate range of RMB10.5 billion to RMB 12.0 billion, to reflect the change of NEV sales in the domestic market.
Cheche ceased using Total Written Premiums Placed as a key business performance indicator as a result of its strategic pivot.
Cheche is estimating an Adjusted Net Loss range of RMB42.7 million to RMB47.4 million for the full year 2026, due primarily to the ongoing restructuring.
Exchange Rate Information
This announcement contains translations of certain RMB amounts into U.S. dollars at a specified rate solely for the reader’s convenience. Unless otherwise noted, all translations from RMB to U.S. dollars and from U.S. dollars to RMB are made at a rate of RMB6.7851 to US$1.00, the exchange rate on June 30, 2026, set forth in the H.10 statistical release of the Federal Reserve Board. The Company makes no representation that the RMB or U.S. dollar amounts referenced could be converted into U.S. dollars or RMB, as the case may be, at any particular rate or at all.
About Cheche Group Inc.
Established in 2014 and headquartered in Beijing, China, Cheche is a leading auto insurance technology platform with a nationwide network of around 101 branches licensed to distribute insurance policies across 25 provinces, autonomous regions, and municipalities in China. Capitalizing on its leading position in auto insurance transaction services, Cheche has evolved into a comprehensive, data-driven technology platform that offers a full suite of services and products for digital insurance transactions and insurance SaaS solutions in China. Learn more at https://www.chechegroup.com/en.
Cheche Group Inc.:
Crocker Coulson
crocker.coulson@aummedia.org
(646) 652-7185
Non-GAAP Financial Measures
Cheche has provided non-GAAP financial measures in this press release that have not been prepared in accordance with generally accepted accounting principles (GAAP) in the United States.
Cheche uses adjusted selling and marketing expenses, adjusted general and administrative expenses, adjusted research and development expenses, adjusted total operating expenses, adjusted net loss, and adjusted net loss per share, which are non-GAAP financial measures, in evaluating our operating results and for financial and operational decision-making purposes.
Cheche defines adjusted total operating expenses as total operating expenses adjusted for the impact of share-based compensation. Cheche defines adjusted net loss as net loss adjusted for the impact of share-based compensation expenses, amortization of intangible assets, and changes in fair value of amounts due to a related party related to the acquisition of Cheche Insurance Sales & Services Co., Ltd. (previously named Fanhua Times Sales and Service Co., Ltd), and change in fair value of warrants. Adjusted net loss per share, basic and diluted, is calculated as adjusted net loss divided by weighted-average ordinary shares outstanding.
Cheche believes that these non-GAAP financial measures help identify underlying trends in its business that could otherwise be distorted by the impact of share-based compensation expenses, amortization of intangible assets related to acquisition, and change in fair value of amounts due to a related party related to the acquisition of Cheche Insurance Sales & Services Co., Ltd. (previously named Fanhua Times Sales and Service Co., Ltd), and change in fair value of warrants. Cheche believes that such non-GAAP financial measures also provide useful information about its operating results, enhance the overall understanding of its past performance and future prospects, and allow for greater visibility with respect to key metrics used by its management in its financial and operational decision-making.
The non-GAAP financial measures are not defined under U.S. GAAP and are not presented in accordance with U.S. GAAP. They should not be considered in isolation or construed as alternatives to net loss or any other measure of performance or as an indicator of Cheche’s operating performance. Further, these non-GAAP financial measures may not be comparable to similarly titled measures presented by other companies. Other companies may calculate similarly titled measures differently, limiting their usefulness as comparative measures to the Company’s data. Cheche encourages investors and others to review the Company’s financial information in its entirety and not rely on a single financial measure. Investors are encouraged to compare the historical non-GAAP financial measures with the most directly comparable GAAP measures. Cheche mitigates these limitations by reconciling the non-GAAP financial measures to the most comparable U.S. GAAP performance measures, all of which should be considered when evaluating its performance.
Safe Harbor Statements
This press release includes “forward-looking statements” within the meaning of the “safe harbor” provisions of the United States Private Securities Litigation Reform Act of 1995. Forward-looking statements may be identified by the use of words such as “estimate,” “plan,” “project,” “forecast,” “intend,” “will,” “expect,” “anticipate,” “believe,” “seek,” “target” or other similar expressions that predict or indicate future events or trends or that are not statements of historical matters. These forward-looking statements also include, but are not limited to, statements regarding projections, estimations, and forecasts of revenue and other financial and performance metrics, projections of market opportunity and expectations, the Company’s ability to scale and grow its business, the Company’s advantages and expected growth, and its ability to source and retain talent, as applicable. These statements are based on various assumptions, whether or not identified in this press release, and on the current expectations of the Company’s management and are not predictions of actual performance. These statements involve risks, uncertainties, and other factors that may cause the Company’s actual results, levels of activity, performance, or achievements to materially differ from those expressed or implied by these forward-looking statements. Further information regarding these and other risks, uncertainties, or factors is included in the Company’s filings with the U.S. Securities and Exchange Commission. Although the Company believes that it has a reasonable basis for each forward-looking statement contained in this press release, the Company cautions you that these statements are based on a combination of facts and factors currently known and projections of the future, which are inherently uncertain. The forward-looking statements in this press release represent the views of the Company as of the date of this press release. Subsequent events and developments may cause those views to change. Except as may be required by law, the Company does not undertake any duty to update these forward-looking statements.
Unaudited Condensed Consolidated Balance Sheets (All amounts in thousands, except for share and per
share data)
December 31,
June 30,
June 30,
2025
2026
2026
RMB
RMB
USD
ASSETS
Current assets:
Cash and cash equivalents
144,511
131,730
19,415
Restricted cash
5,000
41,779
6,157
Short-term investments
226
226
33
Amounts due from related parties
–
14,303
2,108
Accounts receivable, net
1,145,752
665,931
98,146
Prepayments and other current assets
60,059
64,256
9,470
Total current assets
1,355,548
918,225
135,329
Non-current assets:
Restricted cash
21,086
–
–
Property, equipment and leasehold improvement, net
831
893
132
Intangible assets, net
3,850
2,800
413
Right-of-use assets
6,453
5,016
739
Goodwill
84,609
84,609
12,470
Other non-current assets
2,477
1,981
292
Total non-current assets
119,306
95,299
14,046
Total assets
1,474,854
1,013,524
149,375
LIABILITIES AND SHAREHOLDERS’ EQUITY
Current liabilities:
Accounts payable
842,728
430,847
63,499
Short-term borrowings
80,500
98,190
14,471
Contract liabilities
1,044
1,238
182
Salary and welfare benefits payable
83,686
79,321
11,690
Tax payable
22,657
18,320
2,700
Amounts due to a related party
50,626
52,949
7,804
Accrued expenses and other current liabilities
19,206
20,167
2,974
Short-term lease liabilities
4,727
3,510
517
Total current liabilities
1,105,174
704,542
103,837
Non-current liabilities:
Deferred tax liabilities
963
700
103
Long-term borrowings
9,800
–
–
Long-term lease liabilities
801
604
89
Deferred revenue
1,432
1,432
211
Warrant
1,512
1,544
228
Total non-current liabilities
14,508
4,280
631
Total liabilities
1,119,682
708,822
104,468
Ordinary shares
6
6
1
Treasury stock
(1,025)
(1,025)
(151)
Additional paid-in capital
2,550,197
2,553,093
376,279
Accumulated deficit
(2,192,846)
(2,236,903)
(329,679)
Accumulated other comprehensive loss
(1,160)
(10,469)
(1,543)
Total the Company’s shareholders’ equity
355,172
304,702
44,907
Total liabilities and shareholders’ equity
1,474,854
1,013,524
149,375
Unaudited Condensed Consolidated Statements of Operations and Comprehensive Loss (All amounts in
thousands, except for share and per share data)
For the Six Months Ended
June 30,
June 30,
June 30,
2025
2026
2026
RMB
RMB
USD
Net revenues
1,348,652
885,048
130,440
Cost of revenues
(1,282,869)
(827,573)
(121,969)
Gross profit
65,783
57,475
8,471
Operating expenses:
Selling and marketing expenses
(37,250)
(35,637)
(5,252)
General and administrative expenses
(37,255)
(57,902)
(8,534)
Research and development expenses
(18,293)
(14,457)
(2,131)
Total operating expenses
(92,798)
(107,996)
(15,917)
Operating loss
(27,015)
(50,521)
(7,446)
Other expenses:
Interest income
1,669
1,112
164
Interest expense
(1,213)
(1,396)
(206)
Foreign exchange gains
893
6,630
977
Government grants
1,295
2,839
418
Changes in fair value of warrant
1,114
(80)
(12)
Changes in fair value of amounts due to related party
(2,052)
(2,330)
(343)
Others, net
(454)
(552)
(81)
Loss before income tax
(25,763)
(44,298)
(6,529)
Income tax benefit
195
241
36
Net loss
(25,568)
(44,057)
(6,493)
Other comprehensive loss:
Foreign currency translation adjustments, net of nil tax
(1,302)
(9,316)
(1,373)
Fair value changes of amounts due to related party due to own credit risk
(453)
7
1
Total other comprehensive loss
(1,755)
(9,309)
(1,372)
Total comprehensive loss
(27,323)
(53,366)
(7,865)
Net loss per ordinary shares outstanding(1)
Basic
(10.89)
(18.57)
(2.74)
Diluted
(10.89)
(18.57)
(2.74)
Weighted average number of ordinary shares outstanding(1)
Basic
2,348,249
2,372,032
2,372,032
Diluted
2,348,249
2,372,032
2,372,032
(1) The shares and per share information are presented on a retroactive basis to reflect the 35-for-1 share consolidation of its Class A ordinary shares and Class B ordinary shares effective on July 20, 2026.
Reconciliation of GAAP Operating Expenses to Non-GAAP Operating Expenses (Unaudited)
(All amounts in thousands)
For the Six Months Ended
June 30,
June 30,
June 30,
2025
2026
2026
RMB
RMB
USD
Selling and marketing expenses
(37,250)
(35,637)
(5,252)
Add: Share-based compensation expenses
1,851
1,135
167
Adjusted Selling and marketing expenses
(35,399)
(34,502)
(5,085)
General and administrative expenses
(37,255)
(57,902)
(8,534)
Add: Share-based compensation expenses
10,674
1,354
200
Adjusted General and administrative expenses
(26,581)
(56,548)
(8,334)
Research and development expenses
(18,293)
(14,457)
(2,131)
Add: Share-based compensation expenses
512
407
60
Adjusted Research and development expenses
(17,781)
(14,050)
(2,071)
Total operating expenses
(92,798)
(107,996)
(15,917)
Adjusted total operating expenses
(79,761)
(105,100)
(15,490)
Reconciliation of GAAP Net Loss and Net Loss Per Ordinary Share to Non-GAAP Net Loss and Net Loss Per
Ordinary Share (Unaudited)
(All amounts in thousands, except for share data and per share data)
For the Six Months Ended
June 30,
June 30,
June 30,
2025
2026
2026
RMB
RMB
USD
Net loss
(25,568)
(44,057)
(6,493)
Add: Share-based compensation expenses
13,040
2,896
427
Amortization of intangible assets related to acquisition
1,050
1,050
155
Changes in fair value of warrant
(1,114)
80
12
Changes in fair value of amounts due to related party
2,052
2,330
343
Adjusted net loss
(10,540)
(37,701)
(5,556)
Weighted average number of ordinary shares used in
computing non-GAAP adjusted net loss per ordinary
share(1)
Basic
2,348,249
2,372,032
2,372,032
Diluted
2,348,249
2,372,032
2,372,032
Net loss per ordinary share(1)
Basic
(10.89)
(18.57)
(2.74)
Diluted
(10.89)
(18.57)
(2.74)
Non-GAAP adjustments to net loss per ordinary share(1)
Basic
6.40
2.68
0.40
Diluted
6.40
2.68
0.40
Adjusted net loss per ordinary share(1)
Basic
(4.49)
(15.89)
(2.34)
Diluted
(4.49)
(15.89)
(2.34)
(1) The shares and per share information are presented on a retroactive basis to reflect the 35-for-1 share consolidation of its Class A ordinary shares and Class B ordinary shares effective on July 20, 2026.
View original content:https://www.prnewswire.com/news-releases/cheche-group-reports-first-half-2026-unaudited-financial-results-302870447.html
SOURCE Cheche Group Inc.
Technology
GreenCore Solutions Corp. (GSC) AI Agent Stack Passes 24.5 Million Inbound AI Agent Transactions In 30 Days
Published
45 minutes agoon
September 4, 2026By

Brendan Farrugia, Co-founder and Director of GSC Joint Venture Company GSC Agentic Pty. Ltd., joins the GSC Board of Advisors
VANCOUVER, BC and SYDNEY, Sept. 4, 2026 /PRNewswire/ — GreenCore Solutions Corp. (“GSC” or the “Company”) today announced a record month for its AI Agent Stack and a new appointment to its Board of Advisors.
What GSC does. GSC builds AI Agents that sell Consumer Packaged Goods (CPG) and Beauty & Personal Care (BPC) brands. The agents are provided as a managed service — nothing to install, no tech department, no firewall to open, for the brand or the buyer. When a retailer’s buying AI Agent asks whether a brand is available and orderable in its market, the GSC AI Agent answers — in that market, for that brand — and elevates the order to the GSC Trading Deck for humans in the loop on order volume. This is AI Orderability (AIO): new volume added to a brand’s existing capacity and team, not a replacement for either.
The record. In August the AI Agent Stack soared past 24.5 million inbound AI Agent transactions — nine every second — up from 9.5 million per month in May, June and July. Cumulative transactions since May now reach 50 million+. In 1999, Amazon.com took four years to reach its first 10 million customers.
Where the traffic comes from. Half of it is European:
European Union → 11.76 million, led by France at 7.11 million, the Netherlands at 2.35 million, Germany at 777,570 and Belgium at 436,460United Kingdom → 167,200, with Switzerland at 241,450 and Norway at 136,530 alongsideUnited States → 4.9 millionCanada → 1.48 millionSingapore → 1.15 million, the first Asia-Pacific market past one million
Why Europe. The Stack was designed on Microsoft Azure France Central, GSC’s founding region and European home — the global hub of BPC brands and of ESG leadership. GSC AI Agents now run resident in 18 countries on 18 Azure regions, plus Google Cloud Spain:
Founding regions → France Central, Australia East, South Central US, Mexico CentralEurope → UK South, Switzerland North, West Europe (Netherlands), Germany West Central, Italy North, Spain Central, Poland CentralAmericas → Canada Central, Brazil SouthAsia-Pacific → Southeast Asia (Singapore), Korea Central, Japan East, Central IndiaMiddle East → UAE North
Speed for customers and lower compute for buyers: a retail buying AI Agent in Tokyo, Los Angeles or Paris is answered by a GSC AI Agent in Japan, America or France. Every transaction follows one path:
Powered by the CPG Knowledge GraphCarried with its ESG record on SM-ESG-CPGResolved for its jurisdiction → in France, at FR-ECO-10060Answered once → a human reviews and signs every order
Telephone codes and postal codes were built for letters and phone calls. GSC provides the codes for AI Agents.
The market it serves. Morgan Stanley Research estimates AI shopping agents will account for $190 billion to $385 billion of U.S. e-commerce by 2030, with groceries and consumer packaged goods already leading AI-driven purchases. Bain & Company puts the U.S. figure at $300 billion to $500 billion. GSC’s traffic is that market arriving for its BPC brand customers, in the category it was built for.
The appointment. Brendan Farrugia is the Sydney co-founder behind GSC Agentic Pty. Ltd., the joint venture that carries the GSC AI Agent Stack across Asia-Pacific, Latin America and Europe including the UK. He is Director, Co-Founder & General Partner of Unify Ventures and sits on the GSC Agentic International Board of Directors.
“We augment a brand’s sales with new volume — we don’t duplicate what its team already does, and we do it sustainably, with the compute resident in the buyer’s own market,” said Matthew Keddy, CEO, GreenCore Solutions Corp. “Twenty-four and a half million inbound AI Agent transactions a month is 34,000 sales calls an hour, nine every second, answered on eighteen Microsoft Azure hyperscale regions active today for our customers. No brand could staff that. We deliver that new volume with AI Agents on a managed-service basis — faster time to market, lower cost, available now.”
“Every BPC board I sit in front of asks the same question: when does the retail buying agent era commence,” said Brendan Farrugia. “It hit scale in August — twenty-four and a half million agents asked, and our AI Agent fleet delivered. The question a board should be asking now is whether its brands can be found and ordered when those retail AI Agent buyers ask — because if the answer is no, the brand becomes invisible to its primary customers.”
About GreenCore Solutions Corp. (GSC)
GreenCore Solutions Corp. (GSC) builds AI Agents that sell Beauty & Personal Care (BPC) brands into retail grocery procurement, powered by the CPG Knowledge Graph with SPARKS and delivered on MCP + A2A + ACM-68000. GSC carries 24.5 million+ inbound AI Agent transactions a month across 2 billion datapoints spanning 38,350 BPC brands, 15,688 retail grocery banners and 3.29 million points of sale in 50 global markets. GSC AI Agents run sustainable, transact safe, human in the loop, and live on Microsoft Azure and Google Cloud. GSC is a Microsoft AI Cloud Partner. D-U-N-S 24-336-6774. For more information visit gsc-em.com.
About GSC Agentic Pty. Ltd.
GSC Agentic Pty. Ltd., headquartered in Sydney, Australia, is the joint venture delivering the GSC AI Agent Stack across Asia-Pacific, Latin America and Europe including the UK. For more information visit gsc-global.ai
View original content:https://www.prnewswire.com/news-releases/greencore-solutions-corp-gsc-ai-agent-stack-passes-24-5-million-inbound-ai-agent-transactions-in-30-days-302870456.html
SOURCE GreenCore Solutions Corp.


Midea Brings “Simply ideal” to Life at IFA 2026
Cheche Group Reports First Half 2026 Unaudited Financial Results
GreenCore Solutions Corp. (GSC) AI Agent Stack Passes 24.5 Million Inbound AI Agent Transactions In 30 Days

Send Rakhi to UK swiftly with UK Gifts Portal

Whiteboard Series with NEAR | Ep: 45 Joel Thorstensson from ceramic.network

New Gooseneck Omni Antennas Offer Enhanced Signals in a Durable Package

Why You Should Build on #NEAR – Co-founder Illia Polosukhin at CV Labs
Whiteboard Series with NEAR | Ep: 45 Joel Thorstensson from ceramic.network

NEAR End of Year Town Hall 2021: The Open Web World, MetaBUILD 2 Hackathon and 2021 recap
Trending
-

 Technology2 days ago
Onymos and Vanta Diagnostics Collaborate to Scale Intelligent Lab Intake
-

 Technology5 days ago
MOEA’s DoIT Showcases 31 Innovative Technologies at Meet Greater South
-

 Technology2 days ago
OMVP Backs Europe’s Sovereign Space Future as American Lead on €50M+ HyImpulse Financing
-
 Technology2 days ago
New research proves mutant AI swarms outperform optimized models in a changing world
-

 Coin Market3 days ago
Fake Claude desktop app spreads crypto-stealing malware
-

 Coin Market3 days ago
Does the Bitcoin rally mean we haven’t wasted our lives in crypto?
-

 Technology2 days ago
Acer Unveils Its First FHD 1000 Hz Gaming Monitor – Predator XB253Q U1
-

 Near Videos4 days ago
Illia Polosukhin: The Case for User-Owned AI