Connect with us

Technology

Silicon Labs Reports Second Quarter 2026 Results

Published

on

Wireless IoT leader delivers $228 million in revenue and strong earnings growth

AUSTIN, Texas, Aug. 11, 2026 /PRNewswire/ — Silicon Labs (NASDAQ: SLAB), the leading innovator in low-power wireless, reported financial results for the second quarter, which ended July 4, 2026.

“We delivered revenue of $228 million, continuing our strong sequential and year-over-year growth – a testament to the execution and dedication of the Silicon Labs team,” said Matt Johnson, President and Chief Executive Officer. “Overall profitability improved meaningfully in the quarter, demonstrating the operating leverage inherent in our model. Gross margin was nearly 62%, reflecting the value customers place on our industry-leading solutions.”

Second Quarter Financial Highlights 

Revenue was $228 million, up 18% year-over-yearIndustrial & Commercial revenue was $135 million, up 23% year-over-yearHome & Life revenue was $93 million, up 12% year-over-yearBookings and new orders accelerated, while inventory at both our distributors and end customers declinedMedical achieved record revenue in the quarter, up 78% year-over-yearTotal opportunity funnel and design wins both materially accelerated, reinforcing our durable growth trajectoryGAAP diluted loss per share was $(0.32), improving by 52% over the comparable period last yearNon-GAAP diluted earnings per share was $0.71, up 545% over the comparable period last year

Results on a GAAP basis:

GAAP gross margin was 61.6%GAAP operating expenses were $151 millionGAAP operating loss was $11 millionGAAP diluted loss per share was $(0.32)

Results on a non-GAAP basis, excluding the impact of stock compensation, amortization of acquired intangible assets, merger-related costs, and certain other items as set forth in the below GAAP to Non-GAAP reconciliation tables were as follows:

Non-GAAP gross margin was 61.9%Non-GAAP operating expenses were $114 millionNon-GAAP operating income was $27 millionNon-GAAP diluted earnings per share was $0.71

Due to the announced pending acquisition of Silicon Labs by Texas Instruments, Silicon Labs has suspended providing forward-looking guidance.

For more information: Silicon Labs Investor Relations, investor.relations@silabs.com 

About Silicon Labs 

Silicon Labs (NASDAQ: SLAB) is the leading innovator in low-power wireless connectivity, building embedded technology that connects devices and improves lives. Merging cutting-edge technology into the world’s most highly integrated SoCs, Silicon Labs provides device makers the solutions, support, and ecosystems needed to create advanced edge connectivity applications. Headquartered in Austin, Texas, Silicon Labs has operations in over 16 countries and is the trusted partner for innovative solutions in the smart home, industrial IoT, and smart cities markets. Learn more at silabs.com.

Forward-Looking Statements

This press release contains forward-looking statements regarding Silicon Labs’ current expectations, which are based on its current views and assumptions. The words “believe”, “estimate”, “expect”, “intend”, “anticipate”, “plan”, “project”, “will”, and similar phrases as they relate to Silicon Labs are intended to identify such forward-looking statements, although the absence of such words does not necessarily mean a statement is not forward looking. These forward-looking statements include, but are not limited to, Silicon Labs’ expectations regarding its near- and long-term strength and durable growth trajectory and are subject to various risks and uncertainties that could cause actual results to differ materially from expectations that are expressed or implied herein. Among the factors that could cause actual results to differ materially from those in the forward-looking statements are the following: our ability to complete the merger with Texas Instruments within the time frame expected, or at all, as well as potential disruptions in our business and restrictions on our activities during the pendency of the merger; fluctuating changes in global trade policies, including the imposition of tariffs, duties, trade sanctions, or other barriers to international commerce; the impact of the current global memory chip shortage; the competitive and cyclical nature of the semiconductor industry; the challenging macroeconomic environment, including disruptions in the financial services industry; geographic concentration of manufacturers, assemblers, test service providers and customers in Asia that subjects Silicon Labs’ business and results of operations to risks of natural disasters, epidemics or pandemics, war and political unrest; risks that demand and the supply chain may be adversely affected by military conflict (including in the Middle East, and between Russia and Ukraine), terrorism, sanctions or other geopolitical events globally (including in the Middle East, and conflict between Taiwan and China); risks that Silicon Labs may not be able to maintain its historical growth; quarterly fluctuations in revenues and operating results; difficulties developing new products that achieve market acceptance; risks associated with international activities (including trade barriers, particularly with respect to China); intellectual property litigation risks; risks associated with acquisitions and divestitures; product liability risks; difficulties managing and/or obtaining sufficient supply from Silicon Labs’ distributors, manufacturers and subcontractors; dependence on a limited number of products; absence of long-term commitments from customers; inventory-related risks; difficulties managing international activities; risks that Silicon Labs may not be able to manage strains associated with its growth; credit risks associated with its accounts receivable; dependence on key personnel; stock price volatility; the impact of public health crises on the U.S. and global economy; debt-related risks; capital-raising risks; the timing and scope of share repurchases and/or dividends; average selling prices of products may decrease significantly and rapidly; information technology risks; cyber-attacks against Silicon Labs’ products and its networks; risks associated with any material weakness in our internal controls over financial reporting; risks relating to compliance with laws and regulations; and other factors that are detailed in the SEC filings of Silicon Laboratories Inc. Silicon Labs disclaims any intention or obligation to update or revise any forward-looking statements, whether as a result of new information, future events, or otherwise, except as required by law. References in this press release to Silicon Labs shall mean Silicon Laboratories Inc.

Note to editors: Silicon Laboratories, Silicon Labs, the “S” symbol, and the Silicon Labs logo are trademarks of Silicon Laboratories Inc. All other product names noted herein may be trademarks of their respective holders. 

Silicon Laboratories Inc.

Condensed Consolidated Statements of Operations 

(In thousands, except per share data) 

(Unaudited)

Three Months Ended

Six Months Ended

July 4,
2026

July 5,
2025

July 4,
2026

July 5,
2025

Revenues

$       228,189

$       192,845

$       441,689

$       370,559

Cost of revenues

87,515

84,736

174,017

164,673

Gross profit

140,674

108,109

267,672

205,886

Operating expenses:

Research and development

95,016

87,821

183,610

176,040

Selling, general and administrative

56,324

43,155

111,810

84,793

Operating expenses

151,340

130,976

295,420

260,833

Operating loss

(10,666)

(22,867)

(27,748)

(54,947)

Other income (expense):

Interest income and other, net

2,489

3,833

6,115

7,626

Interest expense

(251)

(251)

(483)

(535)

Loss before income taxes

(8,428)

(19,285)

(22,116)

(47,856)

Provision for income taxes

2,164

2,532

4,373

4,431

Net loss

$       (10,592)

$       (21,817)

$       (26,489)

$       (52,287)

Loss per share:

Basic

$           (0.32)

$           (0.67)

$           (0.80)

$           (1.61)

Diluted

$           (0.32)

$           (0.67)

$           (0.80)

$           (1.61)

Weighted-average common shares outstanding:

Basic

33,206

32,682

33,084

32,570

Diluted

33,206

32,682

33,084

32,570

Non-GAAP Financial Measurements

In addition to the GAAP results provided throughout this document, Silicon Labs has provided non-GAAP financial measurements on a basis excluding non-cash and other charges and benefits. Details of these excluded items are presented in the tables below, which reconcile the GAAP results to non-GAAP financial measurements.

The non-GAAP financial measurements do not replace the presentation of Silicon Labs’ GAAP financial results. These measurements provide supplemental information to assist management and investors in analyzing Silicon Labs’ financial position and results of operations. Silicon Labs has chosen to provide this information to investors to enable them to perform meaningful comparisons of past, present and future operating results and as a means to emphasize the results of core on-going operations.

Unaudited Reconciliation of GAAP to Non-GAAP Financial Measures

(In thousands, except per share data)

Three Months Ended

July 4, 2026

Non-GAAP Income Statement Items

GAAP

Measure

GAAP

Percent of

Revenue

Stock

Compensation

Expense

Intangible
Asset

Amortization

Merger-
Related Costs

Non-GAAP

Measure

Non-GAAP

Percent of

Revenue

Revenues

$ 228,189

Gross profit

140,674

61.6 %

$        463

$          —

$         —

$         141,137

61.9 %

Research and development

95,016

41.6 %

12,902

2,295

3,289

76,530

33.5 %

Selling, general and administrative

56,324

24.7 %

12,284

6,258

37,782

16.6 %

Operating expenses

151,340

66.3 %

25,186

2,295

9,547

114,312

50.1 %

Operating income (loss)

(10,666)

(4.7 %)

25,649

2,295

9,547

26,825

11.8 %


Three Months Ended

July 4, 2026

Non-GAAP Earnings (Loss) Per Share

GAAP

Measure

Stock

Compensation

Expense*

Intangible

Asset

Amortization*

Merger-
Related Costs*

Income

Tax

Adjustments**

Non-

GAAP

Measure

Net income (loss)

$ (10,592)

$     25,649

$       2,295

$       9,547

$      (3,067)

$     23,832

Shares Excluded Due to Net Loss

Diluted shares outstanding

33,206

504

33,710

Diluted earnings (loss) per share

$     (0.32)

$         0.71

*

Represents pre-tax amounts

**

Represents the application of an 18% non-GAAP tax rate


Silicon Laboratories Inc.

Condensed Consolidated Balance Sheets 

(In thousands, except per share data) 

(Unaudited)

July 4,
2026

January 3,
2026

Assets

Current assets:

Cash and cash equivalents

$       362,191

$       364,222

Short-term investments

35,051

79,400

Accounts receivable, net

79,801

64,513

Inventories

123,340

95,566

Prepaid expenses and other current assets

70,840

70,316

Total current assets

671,223

674,017

Property and equipment, net

130,902

128,643

Goodwill

376,389

376,389

Other intangible assets, net

18,541

23,130

Other assets, net

56,001

67,138

Total assets

$     1,253,056

$     1,269,317

Liabilities and Stockholders’ Equity

Current liabilities:

Accounts payable

$          52,407

$          50,717

Deferred revenue and returns liability

5,176

5,359

Other current liabilities

66,563

87,711

Total current liabilities

124,146

143,787

Other non-current liabilities

34,108

31,112

Total liabilities

158,254

174,899

Commitments and contingencies

Stockholders’ equity:

Preferred stock – $0.0001 par value; 10,000 shares authorized; no shares issued

Common stock – $0.0001 par value; 250,000 shares authorized; 33,366 and 32,955
 shares issued and outstanding at July 4, 2026 and January 3, 2026, respectively

3

3

Additional paid-in capital

184,456

157,402

Retained earnings

910,325

936,814

Accumulated other comprehensive income

18

199

Total stockholders’ equity

1,094,802

1,094,418

Total liabilities and stockholders’ equity

$     1,253,056

$     1,269,317


Silicon Laboratories Inc.

Condensed Consolidated Statements of Cash Flows 

(In thousands) 

(Unaudited)

Six Months Ended

July 4,
2026

July 5,
2025

Operating Activities

Net loss

$       (26,489)

$       (52,287)

Adjustments to reconcile net loss to net cash provided by (used in) operating
 activities:

Depreciation of property and equipment

12,171

12,701

Amortization of other intangible assets

4,589

8,780

Stock-based compensation expense

46,704

39,605

Deferred income taxes

1,663

1,504

Changes in operating assets and liabilities:

Accounts receivable

(15,289)

(2,017)

Inventories

(27,734)

24,631

Prepaid expenses and other assets

(803)

5,112

Accounts payable

2,051

12,812

Other current liabilities and income taxes

(7,925)

8,377

Deferred revenue and returns liability

(183)

783

Other non-current liabilities

1,667

(6,965)

Net cash provided by (used in) operating activities

(9,578)

53,036

Investing Activities

Purchases of marketable securities

(32,507)

Sales of marketable securities

14,986

Maturities of marketable securities

44,119

17,019

Purchases of property and equipment

(22,153)

(13,549)

Proceeds from capital-related government incentives

5,272

Net cash provided by (used in) investing activities

27,238

(14,051)

Financing Activities

Payment of taxes withheld for vested stock awards

(27,451)

(13,752)

Proceeds from the issuance of common stock

7,760

7,619

Net cash used in financing activities

(19,691)

(6,133)

Increase (decrease) in cash and cash equivalents

(2,031)

32,852

Cash and cash equivalents at beginning of period

364,222

281,607

Cash and cash equivalents at end of period

$       362,191

$       314,459


View original content to download multimedia:https://www.prnewswire.com/news-releases/silicon-labs-reports-second-quarter-2026-results-302848831.html

SOURCE Silicon Labs

Continue Reading
Click to comment

Leave a Reply

Your email address will not be published. Required fields are marked *

Technology

Equifax National Market Pulse Data Shows U.S. Consumer Top-Line Debt Stabilizing at $18.25 Trillion in Q2 2026 With Delinquencies Improving Across Categories

Published

on

By

Credit Card and Auto Debt Balance Growth Outpaces Student Loans Amid Broad Delinquency Relief

Highlights:

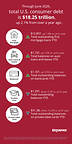
Total U.S. consumer debt reached $18.25 trillion in Q2 2026, reflecting a 2.1% year-over-year increase primarily driven by mortgage and revolving bankcard debt.Delinquency rates showed broad improvement across automotive, bankcard, and mortgage sectors, suggesting a significant stabilization trend in consumer portfolios.

ATLANTA, Aug. 11, 2026 /PRNewswire/ — Equifax® (NYSE: EFX) has released its Market Pulse Second Quarter U.S. Consumer Credit Trends, which includes U.S. national consumer credit data and trends through June 2026 sourced from Equifax proprietary data. While consumer debt balances reached $18.25 trillion in June, driven by increases in mortgage and revolving consumer bank card debt, the data signaled a stabilization period for consumers with only a 0.32% increase from the first quarter of 2026. The data also highlights a consistent improvement in delinquencies in all categories.

Continued Annual Debt Growth Driven by Mortgage and Revolving Card Debt

Total U.S. consumer debt climbed to $18.25 trillion by the end of Q2 2026, a 2.1% year-over-year increase, which represented a growth of nearly $400 billion in a 12-month span. This expansion was primarily driven by mortgage debt, which accounted for roughly 74% of all consumer debt, as first mortgage and HELOC balances were up 1.9% and 12.5% year-over-year.

“We are witnessing a period where top-line consumer data suggests retail and mortgage credit is stabilizing,” said Emmaline Aliff, Advisory Leader at Equifax. “Total consumer debt only increased slightly in the second quarter of 2026, heavily anchored by first mortgages and a renewed reliance on credit cards. Although consumers accumulated seasonal credit card debt last November and December and paid the balances down in the first quarter, they took on more debt in the second quarter, though mortgage debt remains the majority of total consumer debt obligations.”

Structural Shifts in Non-Mortgage Portfolios as Auto and Card Balances Stand to Eclipse Student Loan Debt

While auto loans, student loans, and bankcards continue to dominate roughly 90% of all non-mortgage debt, the composition of this debt has fundamentally shifted over the last three years. Bankcard debt, which was around $1.02 trillion in June 2024, and has grown by 8.2% to land at $1.1 trillion in the second quarter of 2026. This growth outpaces inflation over this same time period, which was about 6.5%.

“Historically, total student loan debt balances were consistently higher than auto debt and almost twice as much as bankcard debt,” said Aliff. “The changing proportions of the non-mortgage categories reflect a macro shift, where student loan stabilization is being offset by further reliance on credit to manage the budgetary pressures of rising household and vehicle costs.”

Delinquencies Broadly Stabilized Across Consumer Portfolios as Mortgage Delinquencies Improve from May

Delinquency rates across automotive, bankcard, and unsecured personal loan portfolios all registered measurable downward trajectories on both a month-over-month and year-over-year basis. This broader stabilization also extended to the mortgage sector. Though first mortgage 90+ days past due (DPD) delinquencies rose 40.6% year-over-year from historic mid-2025 lows, they have improved, dropping 3.6% since May 2026, and suggesting a normalization of delinquencies and alleviation of pressure for some homeowners.

Month-Over-Month and Year-Over-Year Results

Total Consumer Debt Balances

Month

Total Consumer Debt
($T)

MoM Change (%)

YoY Change (%)

April 2026

$18.22

0.2 %

2.8 %

May 2026

$18.23

+0.0 %

2.4 %

June 2026

$18.25

0.1 %

2.1 %

First Mortgage Balances

Month

First Mortgage Balances
($B)

MoM Change (%)

YoY Change (%)

April 2026

$12,875

0.1 %

2.6 %

May 2026

$12,865

-0.1 %

2.2 %

June 2026

$12,845

-0.2 %

1.9 %

Home Equity Lines of Credit (HELOC) Balances

Month

HELOC Balances ($B)

MoM Change (%)

YoY Change (%)

April 2026

$435.1

0.9 %

13.0 %

May 2026

$440.4

1.2 %

12.7 %

June 2026

$444.8

1.0 %

12.5 %

Auto Loan Balances

Month

Auto Loan Balances ($B)

MoM Change (%)

YoY Change (%)

April 2026

$1,605

0.4 %

2.0 %

May 2026

$1,615

0.6 %

2.3 %

June 2026

$1,626

0.7 %

2.8 %

Bankcard Balances

Month

Bankcard Balances ($B)

MoM Change %

YoY Change (%)

April 2026

$1,092.2

0.6 %

3.7 %

May 2026

$1,095.8

0.3 %

3.7 %

June 2026

$1,108.5

1.2 %

3.9 %

Student Loans Balances

Month

Student Loan Debt ($B)

MoM Change %

YoY Change (%)

April 2026

$1,298

-0.3 %

-0.9 %

May 2026

$1,292

-0.4 %

–2.0%

June 2026

$1,287

-0.4 %

-3.1 %

Equifax has been tracking U.S. National Consumer Credit Trends for more than 20 years. Monthly reports can be found on Equifax.com. These reports track originations, balances and delinquencies on U.S. consumer mortgages, auto loans and leases, student loans, bankcards and private label credit cards, and personal loans. To explore Equifax tools that deliver U.S. National Consumer Credit Trends data and key market metrics click here.

ABOUT EQUIFAX INC. 

At Equifax (NYSE: EFX), we believe knowledge drives progress. As a global data, analytics, and technology company, we play an essential role in the global economy by helping financial institutions, companies, employers, and government agencies make critical decisions with greater confidence. Our unique blend of differentiated data, analytics, and cloud technology drives insights to power decisions to move people forward. Headquartered in Atlanta and supported by nearly 15,000 employees worldwide, Equifax operates or has investments in 24 countries in North America, Central and South America, Europe, and the Asia Pacific region. For more information, visit Equifax.com

FOR MORE INFORMATION:
Tiffany Smith for Equifax
mediainquiries@equifax.com 

View original content to download multimedia:https://www.prnewswire.com/news-releases/equifax-national-market-pulse-data-shows-us-consumer-top-line-debt-stabilizing-at-18-25-trillion-in-q2-2026-with-delinquencies-improving-across-categories-302848512.html

SOURCE Equifax Inc.

Continue Reading

Technology

In HelloNation, Selling a Home and Pre-Listing Repairs Explained by Real Estate Expert Bill Sahadi

Published

on

By

The article outlines which repairs and improvements matter most before listing a home and how sellers can avoid unnecessary costs.

SOUTHERN PINES, N.C., Aug. 11, 2026 /PRNewswire/ — What should homeowners fix before selling a home in Moore County? The answer is explored in a HelloNation article, which explains how targeted home listing preparation can improve results without unnecessary spending.

The HelloNation article explains that many sellers make the mistake of trying to fix everything before listing. While the intention is to present a perfect home, this approach often leads to overspending on upgrades that do not influence buyer decisions. Instead, the article emphasizes focusing on the areas that directly affect how a home is perceived during showings.

A key takeaway from the article is that buyers are evaluating more than just visible features. They are also forming opinions about how well the property has been maintained. Deferred maintenance, even in small forms, can create doubt. The article highlights common issues such as leaky fixtures, peeling paint, worn caulking, and sticking doors as problems that should be addressed early in the home listing preparation process.

Curb appeal is another important factor discussed in the article. First impressions begin before a buyer enters the home, and simple improvements can make a noticeable difference. The article describes how maintaining a clean lawn, trimming landscaping, and refreshing the front entry help create a sense of care and attention. For those selling a home in Moore County, this initial impression can influence how buyers view the entire property.

Inside the home, clutter is identified as a frequent issue that sellers can resolve without significant cost. The article explains that excess furniture and personal items can make spaces feel smaller and distract from the home’s features. Clearing surfaces, organizing storage areas, and reducing visual distractions allows buyers to better imagine themselves in the space. Real Estate Expert insights featured in the article reinforce that presentation often matters as much as condition.

The article also addresses flooring and paint as areas where modest updates can have a meaningful impact. Neutral paint and well-maintained flooring can make a home feel newer and more inviting. In contrast, heavily personalized colors or worn surfaces may limit buyer interest. These updates are often more effective than larger renovations when preparing for sale.

When it comes to major upgrades, the article advises sellers to rely on market data rather than assumptions. Not every renovation delivers a return equal to its cost. In some cases, the article explains, a thorough cleaning and minor updates can produce better results than an expensive remodel. Understanding what buyers expect within a specific price range is essential when deciding how much to invest before listing.

The article also discusses the value of transparency through seller disclosures and pre-listing inspections. Identifying issues in advance allows sellers to address them on their own timeline and avoid surprises during negotiations. This approach can help build buyer confidence and keep transactions on track. Real Estate Expert perspectives featured in the article highlight that preparation reduces uncertainty for both parties.

Pricing is ultimately presented as the most important factor in selling a home in Moore County. The article explains that even a well-updated home may struggle if priced incorrectly, while a properly priced home in good condition can attract strong interest. Before making decisions about repairs or upgrades, understanding the appropriate price point is critical.

The article concludes that a clean, maintained, and well-presented home consistently performs better in the market than one with unnecessary upgrades. By focusing on the details buyers notice most, sellers can improve both speed and outcome without overextending their budget.

“What Moore County Home Sellers Should Fix Before Listing Their Property” features insights from Bill Sahadi, Real Estate Expert of Southern Pines, North Carolina, in HelloNation.

About HelloNation

HelloNation is America’s Good News Network, a premier media platform built on the idea that good news travels faster when real people tell real stories. Through its community-focused digital publications and innovative “edvertising” approach, HelloNation delivers expert-driven, good-news content that informs, inspires, and spotlights the leaders making a meaningful impact in their communities.

View original content to download multimedia:https://www.prnewswire.com/news-releases/in-hellonation-selling-a-home-and-pre-listing-repairs-explained-by-real-estate-expert-bill-sahadi-302848883.html

SOURCE HelloNation

Continue Reading

Technology

Alchemy Enters New Chapter with Expanded Leadership as the Premier Work-Integrated Learning and Internship Services Firm for Higher Education

Published

on

By

Leading learning design and internship placement firm expands its leadership to become the premier work-integrated learning and internship services firm for higher education

STAMFORD, Conn., Aug. 11, 2026 /PRNewswire/ — Alchemy, a unit of Nectar Learning, Inc., today announced a new chapter in its growth with the introduction of expanded leadership following the acquisition of Ease Learning, a portfolio company of Achieve Partners, and Achieve’s strategic investment in Alchemy. The announcement signals the company’s accelerated evolution into the premier tech-enabled, product-led career-connected learning and internship services firm for higher education.

“Alchemy and its predecessor companies have been leaders in designing and delivering digital learning for over 30 years. Now, it is time for a new chapter that enables us to leverage both our technology and people expertise to be the leaders in connecting learning to real work. We want the world to say YES to interns! Our new and expanded leadership team enables us to pair our internship services with our learning solutions, especially our platform, Curie, which powers organizations and higher education institutions to design and deliver relevant, career-connected, standards-compliant learning.” – Carrie O’Donnell, Founder & Chair, Alchemy

As the company shifts toward a tech-enabled, product-led ecosystem with deep expertise in AI in teaching and learning, Alchemy introduces a new executive leadership team and board directors uniquely positioned to lead this next phase of growth.

New Executive Leadership

Matt Gurney
Chief Executive Officer
Matt Gurney steps into the role of CEO, having previously served as Alchemy’s Chief Product and Strategy Officer. His extensive background in product, marketing, and general leadership at technology startups makes him the natural leader to guide Alchemy into its next chapter, as the company accelerates its AI-driven approach to career-connected learning and internship placement.

LinkedIn Profile: https://www.linkedin.com/in/mgurney/ 

Lois Harrison
Chief Operating Officer
Lois Harrison joins as Chief Operating Officer, bringing a proven track record of effective strategic operations leadership demonstrated through her tenure leading Ease Learning. Her operational expertise and strategic acumen are central to Alchemy’s expanded platform and service delivery.

LinkedIn Profile: https://www.linkedin.com/in/lois-harrison-354a99b/ 

Brad Gibbs
Senior Vice President, Growth and Marketing
Brad Gibbs brings years of demonstrated success driving GTM strategy and market expansion at education technology and services companies. As SVP of Growth and Marketing, he will lead Alchemy’s national growth effort as the company scales its career-connected learning and internship offerings.

LinkedIn Profile: https://www.linkedin.com/in/bradgibbs/ 

New Board Directors

Ryan Craig
Board Director
Ryan Craig is a Founder and Managing Director at Achieve Partners, as well as an investor, author, and nationally recognized commentator on higher education and workforce development. A co-founder of Apprenticeships for America, Ryan has spent his career forging new pathways from education to employment and championing the skills-based economy.

LinkedIn Profile: https://www.linkedin.com/in/ryan-craig-b4617a80/ 

Jeff Selingo
Board Director
Jeff Selingo is a prominent journalist, strategist, and New York Times bestselling author who has devoted more than 25 years to covering higher education and the future of work. Best known for demystifying college admissions and workforce readiness, Jeff brings unparalleled insight into the evolving landscape connecting education to careers. 

LinkedIn Profile: https://www.linkedin.com/in/jeffselingo/ 

“The education-to-workforce ecosystem is shifting under demographic and societal pressures, and the gap in trained workers across fields like semiconductors, advanced manufacturing, and healthcare has never been more acute. The time is right for a company that doesn’t just deliver learning experiences, but closes the distance between instruction and real work. Alchemy is purpose-built for this moment, and our new leadership team and board are exactly the right collaborators to make it happen.” – Matt Gurney, CEO, Alchemy

ABOUT ALCHEMY

Alchemy, a unit of Nectar Learning, Inc., is the premier career-connected learning and internship services firm for higher education. Alchemy helps institutions turn learning into workforce outcomes, backed by 30+ years of instructional expertise and Curie, its proprietary platform for designing and delivering career-connected learning at scale. By absorbing the operational complexity that makes quality learning difficult to scale, Alchemy closes the gap between instruction and application for institutions, and between talent development and daily execution for employers. Backed by Achieve Partners, Alchemy is accelerating its mission to connect education to meaningful workforce outcomes.

www.alchemy.works/for-employers 

MEDIA CONTACT

Alchemy  |  Stamford, CT
Kellie Pierce
kpierce@nectar.inc

View original content to download multimedia:https://www.prnewswire.com/news-releases/alchemy-enters-new-chapter-with-expanded-leadership-as-the-premier-work-integrated-learning-and-internship-services-firm-for-higher-education-302848888.html

SOURCE Alchemy

Continue Reading

Trending