
Technology
Ramaco Resources, Inc. Announces Non-Binding Memorandum of Understanding with Indium Corporation

Published
15 minutes agoon
By

LEXINGTON, Ky., Aug. 18, 2026 /PRNewswire/ — Ramaco Resources, Inc. (NASDAQ: METC, METCB) (“Ramaco” or the “Company”) today announced that it has entered into a non-binding memorandum of understanding (“MOU”) with Indium Corporation relating to the supply of gallium and germanium from Ramaco’s exploratory Brook Mine rare earth and critical-mineral project in Wyoming (the “Brook Mine”).
Indium Corporation, headquartered in Clinton, New York, is a global leader in advanced electronic materials and specialty metals serving the semiconductor, electronics, aerospace, defense, and advanced manufacturing industries. The company is recognized for its expertise in the refining, purification, alloy development, and manufacture of high-performance materials, including gallium- and germanium-based products used throughout the semiconductor value chain. Indium Corporation manufactures and supplies electronics-assembly materials, including semiconductor packaging materials, thermal interface materials, solder products, and specialty metals.
Under the MOU, Ramaco and Indium Corporation agree to negotiate the potential supply of gallium and germanium from the Brook Mine project.
The MOU is non-binding, and any future supply or offtake arrangements will be subject to the completion of due diligence, negotiation, and execution of definitive agreements, successful development of the Brook Mine project, and other applicable conditions.
“Indium Corporation brings decades of experience supplying advanced electronic materials to the global semiconductor industry. We believe this MOU demonstrates a promising opportunity to introduce Brook Mine gallium and germanium into established domestic and allied supply chains. By combining Ramaco’s potential domestic resource base with Indium Corporation’s global materials expertise and established presence in advanced technology manufacturing, we believe this proposed relationship could strengthen and diversify the supply of materials that are increasingly critical to the U.S. electronics, semiconductor, and advanced manufacturing industries,” said Randall Atkins, Chairman and CEO of Ramaco Resources.
“Gallium and germanium play an important role in many of the advanced technologies that are shaping our future,” said Indium Corporation President and CEO Ross Berntson. “At Indium Corporation, our expertise has always been rooted in materials science and in helping our customers solve complex challenges with reliable, high-performance materials. This MOU with Ramaco Resources, Inc. represents an opportunity to explore how our capabilities can complement a potential U.S. source of these critical materials, while supporting the development of more resilient and diversified supply chains for the industries we serve.”
About Ramaco Resources
Ramaco Resources, Inc. is an operator and developer of high-quality, low-cost metallurgical coal in southern West Virginia, and southwestern Virginia and exploring a coal, rare earth and other critical minerals project in Wyoming. The Company’s executive offices are located in Lexington, Kentucky, with operational offices in Charleston, West Virginia and Sheridan, Wyoming. The Company currently has four active metallurgical coal mining complexes in Central Appalachia and one coal mine and rare earth element and other critical mineral exploration stage property near Sheridan, Wyoming (the “Brook Mine”). The Brook Mine remains an exploration stage property, and no assurance can be given that it will be successfully developed into a commercial scale mine or that any inferred mineral resources estimated will be converted into higher confidence mineral resources or eventually mineral reserves. Contiguous to the Brook Mine, the Company operates a carbon research facility related to the potential production of advanced carbon products and materials from coal. In connection with these activities, it holds a body of more than 70 intellectual property patents, pending applications, exclusive licensing agreements and various trademarks. News and additional information about Ramaco Resources, including filings with the Securities and Exchange Commission, are available at https://www.ramacoresources.com. For more information, contact investor relations at (859) 244-7455 or info@ramacometc.com.
Contact:
Orin Atkins, Ramaco Resources
orin.atkins@ramacometc.com
About Indium Corporation
Indium Corporation® is a premier materials refiner, manufacturer, and supplier to the global electronics, semiconductor, thin-film, and thermal management markets. Products include solders and fluxes; brazes; thermal interface materials; sputtering targets; indium, gallium, germanium, and tin metals and inorganic compounds; and NanoFoil®. Founded in 1934, the company has global technical support and factories located in China, Germany, India, Malaysia, Mexico, Singapore, South Korea, the United Kingdom, and the U.S. News and additional information about Indium Corporation are available at https://www.indium.com. For more information, contact the company at +1 315-853-4900 or askus@indium.com.
Contact:
Jingya Huang, Senior Marketing Communications Manager, Indium Corporation
jhuang@indium.com
CAUTIONARY STATEMENT REGARDING FORWARD-LOOKING STATEMENTS
Certain statements contained in this news release constitute “forward-looking statements” within the meaning of the Private Securities Litigation Reform Act of 1995, including, but not limited to, statements related to future business arrangements and agreements, future production volumes and sales, anticipated capital expenditures, expected demand for gallium and germanium, the development and commercialization of the Brook Mine rare earth and critical mineral project, projected operating costs and margins, and the Company’s financial guidance and outlook. These forward-looking statements represent Ramaco Resources’ expectations or beliefs concerning guidance, future events, anticipated revenue, future demand and production levels, macroeconomic trends, the development of ongoing projects, costs and expectations regarding operating results, and it is possible that the results described in this news release will not be achieved.
These forward-looking statements are subject to risks, uncertainties and other factors, many of which are outside of Ramaco Resources’ control, which could cause actual results to differ materially from the results discussed in the forward-looking statements.
These factors include, without limitation, unexpected delays in our current mine development activities, the failure of our various business counterparties to perform, increased government regulation in the United States or internationally, the impact of tariffs imposed by the United States and foreign governments, the further decline of demand for gallium and germanium and underperformance of the railroads, the Company’s ability to successfully develop the exploratory Brook Mine rare earth and critical mineral project, including whether the Company’s exploration target and estimates for such mine are realized, the timing of the initial production of rare earth concentrates, the development of a pilot and ultimately a full scale commercial processing facility. Mineral resources are not mineral reserves and do not meet the threshold for reserve modifying factors, such as estimated economic viability, that would allow for conversion to mineral reserves. There is no certainty that any part of the inferred mineral resources estimated at Brook Mine will be converted into higher confidence mineral resources and eventually mineral reserves in the future. Rare earth and critical minerals are a new initiative for us and, as such, has required and will continue to require us to make significant investments to build out our rare earth and other critical mineral capabilities.
Any forward-looking statement speaks only as of the date on which it is made, and, except as required by law, Ramaco Resources does not undertake any obligation to update or revise any forward-looking statement, whether as a result of new information, future events or otherwise. New factors emerge from time to time, and it is not possible for Ramaco Resources to predict all such factors. When considering these forward-looking statements, you should keep in mind the risk factors and other cautionary statements found in Ramaco Resources’ filings with the Securities and Exchange Commission (“SEC”), including its Annual Report on Form 10-K and Quarterly Reports on Form 10-Q. The risk factors and other factors noted in Ramaco Resources’ SEC filings could cause its actual results to differ materially from those contained in any forward-looking statement.
View original content:https://www.prnewswire.com/news-releases/ramaco-resources-inc-announces-non-binding-memorandum-of-understanding-with-indium-corporation-302854525.html
SOURCE Ramaco Resources, Inc.

You may like
Technology
Jack Henry & Associates, Inc. Reports Fourth Quarter and Full Year Fiscal 2026 Results
Published
15 minutes agoon
August 18, 2026By
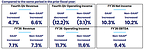
Fourth quarter summary:
GAAP revenue increased 4.7% and GAAP operating income decreased 12.2% for the fiscal three months ended June 30, 2026, compared to the prior fiscal year quarter.Non-GAAP adjusted revenue increased 6.6% and non-GAAP adjusted operating income decreased 3.1% for the fiscal three months ended June 30, 2026, compared to the prior fiscal year quarter.1GAAP EPS was $1.57 per diluted share for the fiscal three months ended June 30, 2026, compared to $1.75 per diluted share in the prior fiscal year quarter representing contraction of 10.2%.Stock repurchases for the fiscal three months ended June 30, 2026, were $164 million at an average price of $140 per share.
Fiscal year summary:
GAAP revenue increased 7.1% and GAAP operating income increased 11.7% for the fiscal year ended June 30, 2026, compared to the prior fiscal year.Non-GAAP adjusted revenue increased 7.3% and non-GAAP adjusted operating income increased 11.6% for the fiscal year ended June 30, 2026, compared to the prior fiscal year.1GAAP EPS was $6.98 per diluted share for the fiscal year ended June 30, 2026, compared to $6.24 per diluted share in the prior fiscal year representing growth of 11.9%.Cash and cash equivalents were $12.1 million at June 30, 2026, and $102.0 million at June 30, 2025.Debt outstanding for credit facilities was $40 million at June 30, 2026, and $0 at June 30, 2025.Stock repurchases for fiscal year ended June 30, 2026, were $448 million at an average price of $152 per share.
Full year fiscal 2027 guidance (Dollars in millions, other than per share amounts):3
Current
GAAP
Low
High
Revenue
$2,684
$2,709
Operating margin4
24.5 %
24.7 %
EPS
$7.33
$7.38
Non-GAAP5
Adjusted revenue
$2,659
$2,684
Adjusted operating margin
24.1 %
24.3 %
MONETT, Mo., Aug. 18, 2026 /PRNewswire/ — Jack Henry & Associates, Inc. (Nasdaq: JKHY), a leading financial technology provider, today announced results for fiscal fourth quarter and fiscal full year ended June 30, 2026.
1 See tables below on page 4 reconciling non-GAAP financial measures to GAAP.
2See table below on page 14 reconciling net income to non-GAAP EBITDA.
3 The full fiscal year guidance assumes no acquisitions or dispositions will be made during fiscal year 2027.
4Operating margin is calculated by dividing operating income by revenue.
5See tables below on page 9 reconciling fiscal year 2027 GAAP to non-GAAP guidance.
According to Greg Adelson, President and CEO, “We are extremely pleased to report record sales and financial results for fiscal 2026. We delivered a record 58 competitive core wins for the year, including 14 institutions with more than $1 billion in assets, and both fourth-quarter and full-year non-GAAP revenue reached new highs. Technology spending remains strong, which is reflected in our robust sales pipeline as we continue to provide innovative solutions and expand the use of artificial intelligence to help banks and credit unions win in the markets they serve. As we enter fiscal 2027, we are well positioned to continue driving consistent revenue growth, margin expansion, and long-term value through our unwavering focus on culture, service, innovation, strategy, and execution.”
Operating Results
Revenue, operating expenses, operating income, and net income for the fiscal three months and fiscal year ended June 30, 2026, compared to the fiscal three months and fiscal year ended June 30, 2025, were as follows:
Revenue
(Unaudited, dollars in thousands)
Three Months Ended
June 30,
%
Change
Year Ended
June 30,
%
Change
2026
2025
2026
2025
Revenue
Services and Support
$ 360,195
$ 351,239
2.5 %
$ 1,448,003
$ 1,361,737
6.3 %
Percentage of Total Revenue
55.9 %
57.1 %
56.9 %
57.3 %
Processing
283,828
264,133
7.5 %
1,096,336
1,013,551
8.2 %
Percentage of Total Revenue
44.1 %
42.9 %
43.1 %
42.7 %
REVENUE
$ 644,023
$ 615,372
4.7 %
$ 2,544,339
$ 2,375,288
7.1 %
Services and support revenue increased for the fiscal three months ended June 30, 2026, compared to the fiscal three months ended June 30, 2025, primarily driven by growth in data processing and hosting revenue within private and public cloud revenue of 7.4% and higher license and hardware revenue by 27.3% and increased education, royalty, and other revenues by 38.6% partially offset by a decrease in deconversion revenue of $11,168. Processing revenue increased for the fiscal three months ended June 30, 2026, compared to the fiscal three months ended June 30, 2025, mainly driven by growth in card revenue of 5.4% from monthly service and risk management fees, improvement in Jack Henry digital and transaction revenue of 8.6% from a higher number of active users on our digital platform, and a rise in faster payments revenue of 47.0%.Services and support revenue increased for the fiscal year ended June 30, 2026, compared to the fiscal year ended June 30, 2025, primarily driven by growth in data processing and hosting revenue within private and public cloud revenue of 8.5%, higher consulting, work orders and release fees revenue by 13.0%, a rise in implementation revenue by 14.1%, and increased license and hardware revenue by 19.5% partially offset by the decrease in software usage revenue (mainly due to a contract change in the prior fiscal year) by 26.2%. Processing revenue increased for the fiscal year ended June 30, 2026, compared to the fiscal year ended June 30, 2025, mainly driven by growth in card revenue of 6.0% from monthly service and risk management fees, improvement in Jack Henry digital and transaction revenue of 11.6% from a higher number of active users on our digital platform, and a rise in faster payments revenue of 49.5%.For the fiscal three months ended June 30, 2026, compared to the fiscal three months ended June 30, 2025, core segment revenue increased 1.9%, payments segment revenue increased 4.9%, complementary segment revenue increased 4.7%, and corporate services segment revenue increased 30.4%. For the fiscal three months ended June 30, 2026, compared to the fiscal three months ended June 30, 2025, core segment non-GAAP adjusted revenue increased 6.0%, payments segment non-GAAP adjusted revenue increased 6.1%, complementary segment non-GAAP adjusted revenue increased 5.6%, and corporate services non-GAAP adjusted segment revenue increased 31.3%. Total non-GAAP adjusted revenue increased 6.6% for the same comparative periods (see revenue lines of segment break-out tables on pages 5 and 6 below for a reconciliation of GAAP segment revenue to non-GAAP adjusted segment revenue).For the fiscal year ended June 30, 2026, compared to the fiscal year ended June 30, 2025, core segment revenue increased 4.8%, payments segment revenue increased 7.2%, complementary segment revenue increased 8.3%, and corporate services segment revenue increased 18.3%. For the fiscal year ended June 30, 2026, compared to the fiscal year ended June 30, 2025, core segment non-GAAP adjusted revenue increased 7.1%, payments segment non-GAAP adjusted revenue increased 6.4%, complementary segment non-GAAP adjusted revenue increased 7.7%, and corporate services non-GAAP adjusted segment revenue increased 18.3%. Total non-GAAP adjusted revenue increased 7.3% for the same comparative periods (see revenue lines of segment break-out tables on pages 7 and 8 below for a reconciliation of GAAP segment revenue to non-GAAP adjusted segment revenue).
Operating Expenses and Operating Income
(Unaudited, dollars in thousands)
Three Months Ended
June 30,
%
Change
Year Ended
June 30,
%
Change
2026
2025
2026
2025
Cost of Revenue
$ 370,175
$ 343,879
7.6 %
$ 1,433,651
$ 1,360,747
5.4 %
Percentage of Total Revenue6
57.5 %
55.9 %
56.3 %
57.3 %
Research and Development
49,830
42,580
17.0 %
176,445
162,771
8.4 %
Percentage of Total Revenue6
7.7 %
6.9 %
6.9 %
6.9 %
Selling, General, and Administrative
87,245
73,216
19.2 %
299,210
283,055
5.7 %
Percentage of Total Revenue6
13.5 %
11.9 %
11.8 %
11.9 %
OPERATING EXPENSES
507,250
459,675
10.3 %
1,909,306
1,806,573
5.7 %
OPERATING INCOME
$ 136,773
$ 155,697
(12.2) %
$ 635,033
$ 568,715
11.7 %
Operating Margin6
21.2 %
25.3 %
25.0 %
23.9 %
Cost of revenue increased for the fiscal three months and fiscal year ended June 30, 2026, compared to the fiscal three months and fiscal year ended June 30, 2025, primarily due to higher personnel costs, including compensation and benefit costs, partially related to trailing twelve month headcount growth, higher direct costs generally consistent with increases in related lines of revenue, as well as higher amortization of capitalized software and increased internal licenses and fees.Research and development expense increased for the fiscal three months and fiscal year ended June 30, 2026, compared to the fiscal three months and fiscal year ended June 30, 2025, primarily due to higher personnel costs (net of capitalization), including compensation and benefit costs, partially related to trailing twelve month headcount growth.Selling, general, and administrative expense increased for the fiscal three months and fiscal year ended June 30, 2026, compared to the fiscal three months and fiscal year ended June 30, 2025, mainly due to higher personnel costs, including increased medical costs from second-half normalization trends and higher compensation tied to trailing twelve month headcount growth.
Net Income
(Unaudited, in thousands,
except per share data)
Three Months Ended
June 30,
%
Change
Year Ended
June 30,
%
Change
2026
2025
2026
2025
Income Before Income Taxes
$ 139,738
$ 159,949
(12.6) %
$ 652,790
$ 586,036
11.4 %
Provision for Income Taxes
28,510
32,345
(11.9) %
150,014
130,288
15.1 %
NET INCOME
$ 111,228
$ 127,604
(12.8) %
$ 502,776
$ 455,748
10.3 %
Diluted earnings per share
$ 1.57
$ 1.75
(10.2) %
$ 6.98
$ 6.24
11.9 %
Effective tax rates for the fiscal three months and fiscal year ended June 30, 2026, were 20.4% and 23.0% respectively, and for the fiscal three months and fiscal year ended June 30, 2025 were 20.2% and 22.2%, respectively.
According to Mimi Carsley, CFO and Treasurer, “Our full year performance delivered record revenues, substantial margin expansion, and robust free cash flow, yielding value—culminating in an outstanding ROIC of 23.2% that reflects the underlying strength of our business model. Looking ahead to full-year 2027, our non-GAAP revenue growth should remain consistent, but margin comparisons will be impacted by tough comparisons from the first half of last year. Overall, we expect another strong performance in fiscal 2027.”
6Operating margin is calculated by dividing operating income by revenue. Operating margin plus operating expense components as a percentage of total revenue may not equal 100% due to rounding.
Impact of Non-GAAP Adjustments
The tables below show our revenue, operating income, and net income for the fiscal three months and fiscal year ended June 30, 2026, compared to the fiscal three months and fiscal year ended June 30, 2025, excluding the impacts of deconversions in the fiscal quarter and fiscal year ended June 30, 2026, and June 30, 2025, the impact in the current fiscal quarter and fiscal year of an acquisition made during the current fiscal year, the gain on assets, net, in the current fiscal year, and the impact of a contract change in the prior fiscal quarter and fiscal year.
(Unaudited, dollars in thousands)
Three Months Ended June 30,
%
Change
Year Ended June 30,
%
Change
2026
2025
2026
2025
GAAP Revenue*
$ 644,023
$ 615,372
4.7 %
$ 2,544,339
$ 2,375,288
7.1 %
Adjustments:
Deconversion revenue
(9,327)
(20,495)
(42,830)
(33,905)
Revenue related to a contract change
—
(1,202)
—
(15,874)
Revenue from the acquisition
(1,598)
—
(5,193)
—
NON-GAAP ADJUSTED REVENUE*
$ 633,098
$ 593,675
6.6 %
$ 2,496,316
$ 2,325,509
7.3 %
GAAP Operating Income
$ 136,773
$ 155,697
(12.2) %
$ 635,033
$ 568,715
11.7 %
Adjustments:
Operating income from deconversions
(4,616)
(17,938)
(29,953)
(27,663)
Operating income related to a contract change
—
(180)
—
(2,358)
Gain on assets, net
—
—
(6,829)
—
Operating loss from the acquisition
1,141
—
2,959
—
NON-GAAP ADJUSTED OPERATING INCOME
$ 133,298
$ 137,579
(3.1) %
$ 601,210
$ 538,694
11.6 %
Non-GAAP Adjusted Operating Margin**
21.1 %
23.2 %
24.1 %
23.2 %
GAAP Net Income
$ 111,228
$ 127,604
(12.8) %
$ 502,776
$ 455,748
10.3 %
Adjustments:
Net income from deconversions
(4,616)
(17,938)
(29,953)
(27,663)
Net income related to a contract change
—
(180)
—
(2,358)
Gain on assets, net
—
—
(6,829)
—
Net loss from the acquisition
1,141
—
2,959
—
Tax impact of adjustments***
834
4,348
8,118
7,205
NON-GAAP ADJUSTED NET INCOME
$ 108,587
$ 113,834
(4.6) %
$ 477,071
$ 432,932
10.2 %
*GAAP revenue is comprised of services and support and processing revenues (see page 2). Services and support revenue less deconversion revenue for the fiscal three months ended June 30, 2026, and 2025, which was $9,327 for the current fiscal year quarter and $20,495 for the prior fiscal year quarter, and reducing the fiscal three months ended June 30, 2025, amount also for revenue related to a contractual change of $1,202, results in non-GAAP adjusted services and support revenue growth of 6.5% quarter over quarter. Processing revenue less revenue from the acquisition for the fiscal three months ended June 30, 2026, of $1,598, results in non-GAAP adjusted processing revenue growth of 6.9% quarter over quarter.
Services and support revenue less deconversion revenue for the fiscal year ended June 30, 2026, and 2025 which was $42,830 for the current fiscal year and $33,905 for the prior fiscal year, and reducing the fiscal year ended June 30, 2025, amount also for revenue related to a contractual change of $15,874, results in non-GAAP adjusted services and support revenue growth of 7.1% year over year. Processing revenue less revenue from the acquisition for the fiscal year ended June 30, 2026, of $5,193, results in non-GAAP adjusted processing revenue growth of 7.7% year over year.
**Non-GAAP adjusted operating margin is calculated by dividing non-GAAP adjusted operating income by non-GAAP adjusted revenue.
***The tax impact of adjustments is calculated using a tax rate of 24% for the fiscal three months and fiscal year ended June 30, 2026, and 2025. The tax rate for non-GAAP adjustment items takes a broad look at the Company’s recurring tax adjustments and applies them to non-GAAP revenue that does not have its own specific tax impacts.
The tables below show the segment break-out of revenue and cost of revenue for each period presented, as adjusted for the items above, and include a reconciliation to non-GAAP adjusted operating income presented above.
Three Months Ended June 30, 2026
(Unaudited, dollars in thousands)
Core
Payments
Complementary
Corporate
Services
Total
GAAP REVENUE
$ 191,611
$ 240,419
$ 188,800
$ 23,193
$ 644,023
Non-GAAP adjustments*
(2,830)
(4,454)
(3,588)
(53)
(10,925)
NON-GAAP ADJUSTED REVENUE
188,781
235,965
185,212
23,140
633,098
GAAP COST OF REVENUE
75,756
121,233
73,009
100,177
370,175
Non-GAAP adjustments*
(1,450)
(2,295)
(1,040)
(129)
(4,914)
NON-GAAP ADJUSTED COST OF REVENUE
74,306
118,938
71,969
100,048
365,261
GAAP SEGMENT INCOME
$ 115,855
$ 119,186
$ 115,791
$ (76,984)
Segment Income Margin**
60.5 %
49.6 %
61.3 %
(331.9) %
NON-GAAP ADJUSTED SEGMENT INCOME
$ 114,475
$ 117,027
$ 113,243
$ (76,908)
Non-GAAP Adjusted Segment Income Margin**
60.6 %
49.6 %
61.1 %
(332.4) %
Research and Development
49,830
Selling, General, and Administrative
87,245
Non-GAAP adjustments unassigned to a segment***
(2,536)
NON-GAAP TOTAL ADJUSTED OPERATING EXPENSES
499,800
NON-GAAP ADJUSTED OPERATING INCOME
$ 133,298
*Revenue non-GAAP adjustments for the Payments segment were ($1,598) of acquisition revenue and ($2,856) of deconversion revenue. Revenue non-GAAP adjustments for the remainder of the segments were deconversion revenue. Cost of revenue non-GAAP adjustments for the Payments segment were ($1,991) of acquisition costs and ($304) of deconversion costs. Cost of revenue non-GAAP adjustments for the Corporate Services segment were ($118) of acquisition costs and ($11) of deconversion costs. Cost of revenue non-GAAP adjustments for the remainder of the segments were deconversion costs.
**Segment income margin is calculated by dividing segment income by revenue for each segment. Non-GAAP adjusted segment income margin is calculated by dividing non-GAAP adjusted segment income by non-GAAP adjusted revenue for each segment.
***Non-GAAP adjustments unassigned to a segment were deconversion costs of $1,906, research and development costs related to the acquisition of $590, and selling, general, and administrative costs related to the acquisition of $40.
Three Months Ended June 30, 2025
(Unaudited, dollars in thousands)
Core
Payments
Complementary
Corporate
Services
Total
GAAP REVENUE
$ 187,976
$ 229,292
$ 180,317
$ 17,787
$ 615,372
Non-GAAP adjustments*
(9,863)
(6,818)
(4,852)
(164)
(21,697)
NON-GAAP ADJUSTED REVENUE
178,113
222,474
175,465
17,623
593,675
GAAP COST OF REVENUE
69,389
116,128
68,894
89,468
343,879
Non-GAAP adjustments*
(1,753)
(109)
(440)
(9)
(2,311)
NON-GAAP ADJUSTED COST OF REVENUE
67,636
116,019
68,454
89,459
341,568
GAAP SEGMENT INCOME
$ 118,587
$ 113,164
$ 111,423
$ (71,681)
Segment Income Margin**
63.1 %
49.4 %
61.8 %
(403.0) %
NON-GAAP ADJUSTED SEGMENT INCOME
$ 110,477
$ 106,455
$ 107,011
$ (71,836)
Non-GAAP Adjusted Segment Income Margin
62.0 %
47.9 %
61.0 %
(407.6) %
Research and Development
42,580
Selling, General, and Administrative
73,216
Non-GAAP adjustments unassigned to a segment***
(1,268)
NON-GAAP TOTAL ADJUSTED OPERATING EXPENSES
456,096
NON-GAAP ADJUSTED OPERATING INCOME
$ 137,579
*Revenue non-GAAP adjustments for the Core segment were ($1,202) of revenue related to the contractual change and ($8,661) of deconversion revenue. Revenue non-GAAP adjustments for the remainder of the segments were deconversion revenue. Cost of revenue non-GAAP adjustments for the Core segment were cost of revenue related to a contractual change of ($1,022) and ($731) of deconversion costs. Cost of revenue non-GAAP adjustments for the remainder of the segments were deconversion costs.
**Segment income margin is calculated by dividing segment income by revenue for each segment. Non-GAAP adjusted segment income margin is calculated by dividing non-GAAP adjusted segment income by non-GAAP adjusted revenue for each segment.
***Non-GAAP adjustments unassigned to a segment were deconversion costs.
Year Ended June 30, 2026
(Unaudited, dollars in thousands)
Core
Payments
Complementary
Corporate
Services
Total
GAAP REVENUE
$ 768,452
$ 936,006
$ 752,214
$ 87,667
$ 2,544,339
Non-GAAP adjustments*
(16,605)
(18,853)
(12,219)
(346)
(48,023)
NON-GAAP ADJUSTED REVENUE
751,847
917,153
739,995
87,321
2,496,316
GAAP COST OF REVENUE
304,886
479,539
286,726
362,500
1,433,651
Non-GAAP adjustments*
(4,566)
(6,571)
(2,119)
(389)
(13,645)
NON-GAAP ADJUSTED COST OF REVENUE
300,320
472,968
284,607
362,111
1,420,006
GAAP SEGMENT INCOME
$ 463,566
$ 456,467
$ 465,488
$ (274,833)
Segment Income Margin**
60.3 %
48.8 %
61.9 %
(313.5) %
NON-GAAP ADJUSTED SEGMENT INCOME
$ 451,527
$ 444,185
$ 455,388
$ (274,790)
Non-GAAP Adjusted Segment Income Margin
60.1 %
48.4 %
61.5 %
(314.7) %
Research and Development
176,445
Selling, General, and Administrative
299,210
Non-GAAP adjustments unassigned to a segment***
(555)
NON-GAAP TOTAL ADJUSTED OPERATING EXPENSES
1,895,106
NON-GAAP ADJUSTED OPERATING INCOME
$ 601,210
*Revenue non-GAAP adjustments for the Payments segment were ($5,193) of acquisition revenue and ($13,660) of deconversion revenue. Revenue non-GAAP adjustments for the remainder of the segments were deconversion revenue. Cost of revenue non-GAAP adjustments for the Payments segment were ($5,854) of acquisition costs and ($717) of deconversion costs. Cost of revenue non-GAAP adjustments for the Corporate Services segment were ($371) of acquisition costs and ($18) of deconversion costs. Cost of revenue non-GAAP adjustments for the remainder of the segments were deconversion costs.
**Segment income margin is calculated by dividing segment income by revenue for each segment. Non-GAAP adjusted segment income margin is calculated by dividing non-GAAP adjusted segment income by non-GAAP adjusted revenue for each segment.
***Non-GAAP adjustments unassigned to a segment were a gain on assets, net, of $6,829 less deconversion costs of $5,457, research and development costs related to the acquisition of $1,803, and selling, general, and administrative costs related to the acquisition of $124.
Year Ended June 30, 2025
(Unaudited, dollars in thousands)
Core
Payments
Complementary
Corporate
Services
Total
GAAP REVENUE
$ 732,924
$ 873,498
$ 694,771
$ 74,095
$ 2,375,288
Non-GAAP adjustments*
(30,639)
(11,159)
(7,709)
(272)
(49,779)
NON-GAAP ADJUSTED REVENUE
702,285
862,339
687,062
73,823
2,325,509
GAAP COST OF REVENUE
295,239
460,151
269,657
335,700
1,360,747
Non-GAAP adjustments*
(15,612)
(288)
(1,119)
(14)
(17,033)
NON-GAAP ADJUSTED COST OF REVENUE
279,627
459,863
268,538
335,686
1,343,714
GAAP SEGMENT INCOME
$ 437,685
$ 413,347
$ 425,114
$ (261,605)
Segment Income Margin**
59.7 %
47.3 %
61.2 %
(353.1) %
NON-GAAP ADJUSTED SEGMENT INCOME
$ 422,658
$ 402,476
$ 418,524
$ (261,863)
Non-GAAP Adjusted Segment Income Margin
60.2 %
46.7 %
60.9 %
(354.7) %
Research and Development
162,771
Selling, General, and Administrative
283,055
Non-GAAP adjustments unassigned to a segment***
(2,725)
NON-GAAP TOTAL ADJUSTED OPERATING EXPENSES
1,786,815
NON-GAAP ADJUSTED OPERATING INCOME
$ 538,694
*Revenue non-GAAP adjustments for the Core segment were ($15,874) of revenue related to the contractual change and ($14,765) of deconversion revenue. Revenue non-GAAP adjustments for the remainder of the segments were deconversion revenue. Cost of revenue non-GAAP adjustments for the Core segment were cost of revenue related to a contractual change of ($13,516) and ($2,096) of deconversion costs. Cost of revenue non-GAAP adjustments for the remainder of the segments were deconversion costs.
**Segment income margin is calculated by dividing segment income by revenue for each segment. Non-GAAP adjusted segment income margin is calculated by dividing non-GAAP adjusted segment income by non-GAAP adjusted revenue for each segment.
***Non-GAAP adjustments unassigned to a segment were deconversion costs.
The table below shows our GAAP to non-GAAP guidance for the fiscal year ending June 30, 2027. Fiscal year 2027 non-GAAP guidance excludes the impacts of deconversion revenue and related operating expenses, acquisition revenues and related operating expenses, the revenues and operating expenses related to a contractual change, and the gain on assets, net, and assumes no additional acquisitions or dispositions will be made during the fiscal year.
GAAP to Non-GAAP GUIDANCE (Dollars in
millions, except per share data)
Annual FY’27
Adjusted for
FY’27
Comparison
Reported
Change
(Acquisition)
Low
High
FY26
FY26
FY26
GAAP REVENUE
$ 2,684
$ 2,709
$ 2,544
$ 2,544
$ —
Growth
5.5 %
6.5 %
Deconversions*
23
23
43
43
—
Acquisition
2
2
—
5
(5)
NON-GAAP ADJUSTED REVENUE**
$ 2,659
$ 2,684
$ 2,502
$ 2,496
$ 5
Non-GAAP Adjusted Growth
6.3 %
7.3 %
GAAP OPERATING EXPENSES
$ 2,025
$ 2,039
$ 1,909
$ 1,909
$ —
Growth
6.1 %
6.8 %
Deconversion costs*
5
5
13
13
—
Acquisition costs
3
3
—
8
(8)
Gain on assets, net
—
—
(7)
(7)
—
NON-GAAP ADJUSTED OPERATING EXPENSES**
$ 2,018
$ 2,031
$ 1,903
$ 1,895
$ 8
Non-GAAP Adjusted Growth
6.0 %
6.7 %
GAAP OPERATING INCOME
$ 658
$ 670
$ 635
$ 635
$ —
Growth
3.7 %
5.5 %
GAAP OPERATING MARGIN
24.5 %
24.7 %
25.0 %
25.0 %
NON-GAAP ADJUSTED OPERATING INCOME**
$ 641
$ 653
$ 598
$ 601
$ (3)
Non-GAAP Adjusted Growth
7.2 %
9.1 %
NON-GAAP ADJUSTED OPERATING MARGIN
24.1 %
24.3 %
23.9 %
24.1 %
GAAP EPS
$ 7.33
$ 7.38
$ 6.98
$ 6.98
$ —
Growth
5.0 %
5.7 %
*Deconversion revenue and related operating expenses for fiscal year 2027 are based on the lowest actual recent historical results. See the Company’s Form 8-K filed with the Securities and Exchange Commission on August 3, 2023.
**GAAP to Non-GAAP revenue, operating expenses, and operating income may not foot due to rounding.
Balance Sheet and Cash Flow Review
Cash and cash equivalents were $12 million at June 30, 2026, compared to $102 million at June 30, 2025.Trade receivables were $349 million at June 30, 2026, and $318 million at June 30, 2025. The Company had $40 million of borrowings at June 30, 2026, compared to $0 of borrowings at June 30, 2025.Deferred revenue was $372 million at June 30, 2026, compared to $363 million at June 30, 2025.Stockholders’ equity decreased to $2,052 million at June 30, 2026, compared to $2,131 million at June 30, 2025.
*See table below for Net Cash Provided by Operating Activities and on page 14 for Return on Average Stockholders’ Equity. Tables reconciling the non-GAAP measures Free Cash Flow and Net Operating Profit After Tax Return on Invested Capital (NOPAT ROIC) to GAAP measures are on pages 14 and 15. See the Use of Non-GAAP Financial Information section below for the definitions of Free Cash Flow and NOPAT ROIC.
The following table summarizes net cash from operating activities:
(Unaudited, in thousands)
Year Ended June 30,
2026
2025
Net income
$ 502,776
$ 455,748
Depreciation
42,103
43,700
Amortization
171,138
161,051
Change in deferred income taxes
126,032
(3,496)
Other non-cash expenses
35,023
30,358
Change in receivables
(29,268)
15,056
Change in deferred revenue
9,099
(25,559)
Change in other assets and liabilities*
(94,943)
(35,354)
NET CASH FROM OPERATING ACTIVITIES
$ 761,960
$ 641,504
*For the fiscal year ended June 30, 2026, the change in other assets and liabilities includes the change in prepaid expenses, deferred costs and other of $(85,512), income taxes of $(14,322), and the change in accounts payable of $(1,431) partially offset by the change in accrued expenses of $6,322. For the fiscal year ended June 30, 2025, the change in other assets and liabilities includes the change in prepaid expenses, deferred costs and other of $(50,933) and the change in accrued expenses of $(3,115) partially offset by the change in income taxes of $16,048 and the change in accounts payable of $2,646.
The following table summarizes net cash from investing activities:
(Unaudited, in thousands)
Year Ended June 30,
2026
2025
Payment for acquisitions
$ (42,390)
$ —
Capital expenditures
(67,103)
(53,358)
Proceeds from sale of assets
32,827
3
Purchased software
(4,108)
(5,363)
Computer software developed
(184,243)
(172,445)
Purchase of investments
(13,721)
(2,000)
Proceeds from investments
1,000
1,000
NET CASH FROM INVESTING ACTIVITIES
$ (277,738)
$ (232,163)
The following table summarizes net cash from financing activities:
(Unaudited, in thousands)
Year Ended June 30,
2026
2025
Borrowings on credit facilities
$ 480,000
$ 350,000
Repayments on credit facilities
(440,000)
(500,000)
Purchase of treasury stock
(448,173)
(35,051)
Dividends paid
(170,405)
(164,644)
Net cash from issuance of stock and tax related to stock-based
compensation
4,459
4,023
NET CASH FROM FINANCING ACTIVITIES
$ (574,119)
$ (345,672)
Use of Non-GAAP Financial Information
Generally Accepted Accounting Principles (GAAP) is the term used to refer to the standard framework of guidelines for financial accounting in the United States. GAAP includes the standards, conventions, and rules accountants follow in recording and summarizing transactions in the preparation of financial statements. In addition to reporting financial results in accordance with GAAP, we have provided certain non-GAAP financial measures, including adjusted revenue, adjusted segment revenue, adjusted operating income, adjusted segment income, adjusted cost of revenue, adjusted segment cost of revenue, adjusted operating expenses, adjusted operating margin, adjusted segment income margin, non-GAAP earnings before interest, taxes, depreciation, and amortization (non-GAAP EBITDA), free cash flow, net operating profit after tax return on invested capital (NOPAT ROIC), and non-GAAP adjusted net income.
We believe non-GAAP financial measures help investors better understand the underlying fundamentals and true operations of our business. Adjusted revenue, adjusted segment revenue, adjusted operating income, adjusted operating margin, adjusted segment income, adjusted segment income margin, adjusted cost of revenue, adjusted segment cost of revenue, adjusted operating expenses, and adjusted net income eliminate deconversion revenue and associated costs, the gain on assets, net, an acquisition, and a contractual change, which management believes are not indicative of the Company’s operating performance. Such adjustments give investors further insight into our performance. Non-GAAP EBITDA is defined as net income attributable to the Company before the effect of interest income, net, taxes, depreciation, and amortization, adjusted for net income before the effect of interest income, net, taxes, depreciation, and amortization attributable to eliminated deconversions, the gain on assets, net, an acquisition, and a contractual change. Free cash flow is defined as net cash from operating activities, less capitalized expenditures, internal use software, and capitalized software, plus proceeds from the sale of assets. NOPAT ROIC is defined as operating income for the trailing four quarters multiplied by one minus the average effective tax rate (ETR) for the trailing four quarters, with the result divided by average invested capital (average of the beginning and ending period balances). Management believes that non-GAAP EBITDA is an important measure of the Company’s overall operating performance and excludes certain costs and other transactions that management deems one time or non-operational in nature; free cash flow is useful to measure the funds generated in a given period that are available for debt service requirements and strategic capital decisions; and NOPAT ROIC is a measure of the Company’s allocation efficiency and effectiveness of its invested capital. For these reasons, management also uses these non-GAAP financial measures in its assessment and management of the Company’s performance.
Non-GAAP financial measures used by the Company may not be comparable to similarly titled non-GAAP measures used by other companies. Non-GAAP financial measures have no standardized meaning prescribed by GAAP and therefore, are unlikely to be comparable with calculations of similar measures for other companies.
Any non-GAAP financial measures should be considered in context with the GAAP financial presentation and should not be considered in isolation or as a substitute for GAAP measures. Reconciliations of the non-GAAP financial measures to related GAAP measures are included.
About Jack Henry & Associates, Inc.®
Jack Henry® (Nasdaq: JKHY) is a well-rounded financial technology company that strengthens connections between financial institutions and the people and businesses they serve. We are an S&P 500 company that prioritizes openness, collaboration, and user centricity — offering banks and credit unions a vibrant ecosystem of internally developed modern capabilities as well as the ability to integrate with leading fintechs. For 50 years, Jack Henry has provided technology solutions to enable clients to innovate faster, strategically differentiate, and successfully compete while serving the evolving needs of their accountholders. We empower over 7,200 clients with people-inspired innovation, personal service, and insight-driven solutions that help reduce the barriers to financial health. Additional information is available at www.jackhenry.com.
Quarterly Conference Call
The Company will hold a conference call on August 19, 2026, at 7:45 a.m. Central Time, and investors are invited to listen at www.jackhenry.com. A webcast replay will be available approximately one hour after the event at ir.jackhenry.com/corporate-events-and-presentations and will remain available for one year.
Statements made in this news release that are not historical facts are “forward-looking statements” within the meaning of the Private Securities Litigation Reform Act of 1995, Section 27A of the Securities Act of 1933 and Section 21E of the Securities Exchange Act of 1934. Because forward-looking statements relate to the future, they are subject to inherent risks and uncertainties that could cause actual results to differ materially from those expressed or implied by such statements. Such risks and uncertainties include, but are not limited to, those discussed in the Company’s Securities and Exchange Commission filings, including the Company’s most recent reports on Form 10-K and Form 10-Q, particularly under the heading Risk Factors. Any forward-looking statement made in this news release speaks only as of the date of the news release, and the Company expressly disclaims any obligation to publicly update or revise any forward-looking statement, whether because of new information, future events or otherwise.
Consolidated Statements of Income (Unaudited)
(Dollars in thousands, except per share data)
Three Months Ended June 30,
%
Change
Year Ended June 30,
%
Change
2026
2025
2026
2025
REVENUE
$ 644,023
$ 615,372
4.7 %
$ 2,544,339
$ 2,375,288
7.1 %
Cost of Revenue
370,175
343,879
7.6 %
1,433,651
1,360,747
5.4 %
Research and Development
49,830
42,580
17.0 %
176,445
162,771
8.4 %
Selling, General, and Administrative
87,245
73,216
19.2 %
299,210
283,055
5.7 %
EXPENSES
507,250
459,675
10.3 %
1,909,306
1,806,573
5.7 %
OPERATING INCOME
136,773
155,697
(12.2) %
635,033
568,715
11.7 %
Interest income
4,949
6,354
(22.1) %
23,144
27,759
(16.6) %
Interest expense
(1,984)
(2,102)
(5.6) %
(5,387)
(10,438)
(48.4) %
Interest Income, net
2,965
4,252
(30.3) %
17,757
17,321
2.5 %
INCOME BEFORE INCOME TAXES
139,738
159,949
(12.6) %
652,790
586,036
11.4 %
Provision for Income Taxes
28,510
32,345
(11.9) %
150,014
130,288
15.1 %
NET INCOME
$ 111,228
$ 127,604
(12.8) %
$ 502,776
$ 455,748
10.3 %
Diluted net income per share
$ 1.57
$ 1.75
$ 6.98
$ 6.24
Diluted weighted average shares outstanding
70,872
73,005
72,043
73,045
Consolidated Balance Sheet Highlights (Unaudited)
(In thousands)
June 30,
%
Change
2026
2025
Cash and cash equivalents
$ 12,056
$ 101,953
(88.2) %
Receivables
349,111
317,977
9.8 %
Total assets
3,145,711
3,043,970
3.3 %
Accounts payable and accrued expenses
$ 261,476
$ 245,299
6.6 %
Debt
40,000
—
— %
Deferred revenue
372,472
363,374
2.5 %
Stockholders’ equity
2,051,949
2,130,832
(3.7) %
Calculation of Non-GAAP Earnings Before Interest Income, Net, Income Taxes, Depreciation and Amortization (Non-GAAP EBITDA)
Three Months Ended June 30,
%
Change
Year Ended June 30,
%
Change
(Dollars in thousands)
2026
2025
2026
2025
Net income
$ 111,228
$ 127,604
$ 502,776
$ 455,748
Net interest
(2,965)
(4,252)
(17,757)
(17,321)
Taxes
28,510
32,345
150,013
130,288
Depreciation and amortization
54,541
51,490
213,241
204,751
Less: Net income before interest expense,
taxes, depreciation and amortization attributable to
eliminated one-time adjustments*
(3,954)
(18,118)
(35,244)
(30,021)
NON-GAAP EBITDA
$ 187,360
$ 189,069
(0.9) %
$ 813,029
$ 743,445
9.4 %
*The fiscal fourth quarter 2026 and 2025 adjustments for net income before interest expense, taxes, depreciation and amortization were for deconversions of ($4,616)
and an acquisition of $662, and were for deconversions of ($17,938) and a contract change of ($180), respectively. The fiscal year 2026 and 2025 adjustments were for
deconversions of ($29,953), a gain on assets, net, of ($6,829), and an acquisition of $1,538, and were for deconversions of ($27,663) and a contractual change of
($2,358), respectively.
Calculation of Free Cash Flow (Non-GAAP)
Year Ended June 30,
(In thousands)
2026
2025
Net cash from operating activities
$ 761,960
$ 641,504
Capitalized expenditures
(67,103)
(53,358)
Internal use software
(4,108)
(5,363)
Proceeds from sale of assets
32,827
3
Capitalized software
(184,243)
(172,445)
FREE CASH FLOW
$ 539,333
$ 410,341
Net income
$ 502,776
$ 455,748
Operating cash conversion*
151.6 %
140.8 %
Free cash flow conversion (excluding proceeds from sale of assets)*
100.7 %
90.0 %
*Operating cash conversion is net cash from operating activities divided by net income. Free cash flow conversion is free cash flow less proceeds from sale of
assets of $32,827 for fiscal 2026 and $3 for fiscal 2025 divided by net income.
Calculation of the Return on Average Stockholders’ Equity
June 30,
(In thousands)
2026
2025
Net income (trailing four quarters)
$ 502,776
$ 455,748
Average stockholder’s equity (period beginning and ending balances)
2,091,391
1,986,598
RETURN ON AVERAGE STOCKHOLDERS’ EQUITY
24.0 %
22.9 %
Calculation of NOPAT ROIC (Non-GAAP)
June 30,
(In thousands)
2026
2025
Operating income (trailing four quarters)
$ 635,033
$ 568,715
Average Effective Tax Rate (trailing four quarters)
22.8 %
22.2 %
NOPAT operating income (trailing four quarters)*
490,245
442,460
Average invested capital (period beginning and ending balances)
2,111,391
2,061,598
NOPAT ROIC
23.2 %
21.5 %
*NOPAT operating income is calculated by multiplying the trailing four quarters operating income by one minus the average ETR. NOPAT ROIC is calculated by dividing NOPAT operating income by average invested capital (period beginning and ending balances).
FAQ for Analysts / Investors
1. Why does fiscal 2025 non-GAAP revenue used for growth calculation not match reported fiscal 2025 non-GAAP revenue?
The restructuring of a third-party agreement resulted in a $16 million fiscal year-over-year revenue headwind, with $12 million of that in the first quarter and $4 million additional in the second, third, and fourth quarters.This restructuring also resulted in a decrease in the related costs and the impact on margins was minimal.This was adjusted for a consistent fiscal year-over-year comparison.
2. What will be the impact of the Victor acquisition in fiscal year 2027?
With the one-year anniversary of the acquisition rolling off on September 30, 2026, Victor’s ongoing revenue will be fully integrated into Non-GAAP adjusted (organic) revenue starting October 1, 2026.
View original content to download multimedia:https://www.prnewswire.com/news-releases/jack-henry–associates-inc-reports-fourth-quarter-and-full-year-fiscal-2026-results-302854537.html
SOURCE Jack Henry & Associates, Inc.
Technology
Vero Fiber and MontanaSky Unite to Create Northwest Montana’s Premier Fiber Broadband Provider
Published
1 hour agoon
August 18, 2026By

Merger brings together two proven fiber providers to accelerate investment, strengthen local operations, and expand next-generation connectivity throughout the Flathead Valley and south Lincoln County.
DENVER and KALISPELL, Mont., Aug. 18, 2026 /PRNewswire/ — Vero Broadband, LLC, doing business as Vero Fiber (“Vero”), and Montana Sky Networks Incorporated, doing business as MontanaSky (“MontanaSky”), today announced that they have entered into a definitive agreement to unite their organizations, bringing together two companies with a shared commitment to delivering exceptional broadband and investing in the communities they serve.
The merger marks an exciting new chapter for broadband in Northwest Montana. By bringing together MontanaSky’s trusted local presence, deep community relationships, and decades of broadband experience with Vero’s proven fiber expertise, financial strength, and additional resources, the companies will be uniquely positioned to accelerate fiber investment, enhanced customer experience, and build the region’s premier locally operated fiber provider.
The transaction has been executed by both parties and remains subject to customary regulatory approvals and closing conditions. The companies expect to close immediately following receipt of those approvals.
Founded in 1993 by Frederick Weber, MontanaSky has spent more than three decades continually investing in better ways to connect the communities it serves. Through every generation of technology, the company has remained focused on exceptional service, innovation, and strong community relationships—values that will remain at the heart of the business following the transaction.
Sunita Krishna, CEO of Vero Fiber, said:
“This merger is another significant milestone in Vero’s long-term commitment to Northwest Montana. Building on the foundation we established with Montana Digital in early 2025, we’re creating an organization with the scale, local expertise, and financial strength to become Northwest Montana’s leading locally operated fiber broadband provider. We look forward to welcoming the MontanaSky team and continuing to invest together in the future of the Flathead Valley.”
For MontanaSky customers, it will be business as usual. The MontanaSky name will remain, customers will continue working with the same trusted local team, and existing support channels will remain unchanged. At the same time, customers will benefit from expanded resources, continued investment in the network, and the long-term stability that comes from becoming part of a growing regional fiber platform. Employees will also benefit from new opportunities for professional growth while continuing to serve the communities they call home.
Ryan Bowman, CEO of MontanaSky, said:
“For years, MontanaSky and Montana Digital, now part of Vero, have each invested in building fiber networks throughout the Flathead Valley. Bringing those networks together is a natural next step and makes both organizations stronger. Vero shares our values and commitment to the communities we serve, and together we can focus our resources on bringing high-speed fiber to more homes and businesses, faster. The combination also creates greater opportunities for our employees and gives us the scale, resources, and strength to compete more effectively with incumbent providers. Ultimately, that means more choice, better service, and more competitive pricing for customers across Northwest Montana.”
Looking ahead, the combined organization will continue expanding fiber optic access throughout the area supporting economic development, and building the infrastructure that will support homes, businesses, schools, healthcare providers, and community institutions in Northwest Montana for generations to come.
About MontanaSky
MontanaSky (Montana Sky Networks, Inc.) is a locally operated broadband provider with offices in Kalispell, MT and Libby, MT. For more than 30 years, MontanaSky has served communities across the Flathead Valley and Northwest Montana, with a focus on bringing reliable, high-speed connectivity to underserved communities.
About Vero Fiber
(Vero Broadband, LLC), a subsidiary of VFN Holdings, Inc., is a national fiber infrastructure provider specializing in fiber‑to‑the‑premises broadband networks. Through strategic acquisitions, partnerships, and investment in rural and underserved areas, Vero Fiber is expanding access to reliable, high‑speed fiber internet connectivity across the U.S.
View original content to download multimedia:https://www.prnewswire.com/news-releases/vero-fiber-and-montanasky-unite-to-create-northwest-montanas-premier-fiber-broadband-provider-302854486.html
SOURCE Vero Fiber Networks
Technology
Wyoming Stable Token Commission Migrates to Chainlink CCIP for Enhanced Operational Security
Published
1 hour agoon
August 18, 2026By

After an exhaustive security review, the Wyoming Stable Token Commission adopts Chainlink CCIP to further bolster its cybersecurity foundation and set a new standard for the first state digital asset issuer
CHEYENNE, Wyo., Aug. 18, 2026 /PRNewswire/ — The Wyoming Stable Token Commission, issuer of the Frontier Stable Token (FRNT), today announced that the State of Wyoming has fully migrated away from LayerZero to Chainlink’s Cross-Chain Interoperability Protocol (CCIP) as its exclusive cross-chain infrastructure in a multi-year contract.
As the first sovereign stable token in the United States, FRNT represents critical public-sector financial infrastructure for Wyoming. Given its obligation to maintain the highest levels of security, governance, and operational integrity for the Frontier Stable Token, the Commission made the critical decision to upgrade to Chainlink CCIP after determining it was the only solution uniquely capable of meeting its rigorous standards, backed by Chainlink Labs’ comprehensive operational security and risk disclosure policies.
Wyoming has established itself as the leading U.S. state for digital asset policy and public-sector blockchain innovation. The Frontier Stable Token is the first fiat-backed, fully reserved stable token issued by a public entity in the United States. It is designed to provide transparent, efficient, and secure digital dollar infrastructure for individuals, businesses, institutions, and public-sector use cases, including payments and settlement. This groundbreaking initiative cements Wyoming at the forefront of digital finance and blockchain innovation.
A November 8, 2023, letter from Wyoming’s Select Committee on Blockchain, Financial Technology, and Digital Innovation Technology encouraged the Commission to adopt a “multi-chain, technology-neutral approach” to deploying its stable token. FRNT has since been deployed on eight public blockchains, following the Commission’s quarterly blockchain selection exercise.
FRNT is currently available on Arbitrum, Avalanche, Base, Ethereum, Hedera, Optimism, Polygon, and Solana blockchains. While the Commission performed its initial deployment through LayerZero’s omnichain fungible token standard, the Commission has since opted to fully deprecate the LayerZero implementation following a detailed security review. FRNT will now leverage Chainlink’s cross-chain infrastructure in a multi-year contract.
Chainlink CCIP has emerged as the leading infrastructure for securely transferring digital assets across blockchain networks. Notably, CCIP implements a defense-in-depth approach to security, including institutional certifications such as SOC 2 Type 2, a highly audited codebase, robust monitoring systems, built-in risk controls, and a decentralized architecture where every transaction is redundantly validated by a minimum of 16 independent node operators. CCIP is also built on the same decentralized oracle network infrastructure that has enabled over $33 trillion in transaction value, secures the vast majority of decentralized finance (DeFi), and has been adopted by the world’s largest financial institutions and market infrastructures.
“Wyoming is building public-sector financial infrastructure with the Frontier Stable Token, and that carries a responsibility to protect the people, businesses, and institutions that rely on it,” said Anthony Apollo, Executive Director of the Wyoming Stable Token Commission. “By adopting Chainlink CCIP, we now have highly secure cross-chain infrastructure that meets the standard our citizens deserve. Wyoming has always led from the front on digital asset innovation, which is why we look forward to expanding the role Chainlink plays in our state’s digital asset future.”
“I’m very excited that the State of Wyoming has upgraded Frontier Stable Token to Chainlink CCIP as its exclusive cross-chain infrastructure,” said Sergey Nazarov, Co-Founder of Chainlink. “Wyoming has consistently been a leader in digital asset policy and public-sector blockchain adoption, and their selection of CCIP shows that governments and other serious institutions need secure, reliable, and standard-setting infrastructure to move digital assets across chains at scale. This is another important step toward a globally connected onchain financial system, and we look forward to working with the Commission to help define the next generation of financial markets.”
By migrating to Chainlink CCIP, Wyoming is providing a blueprint for other states, government entities, financial institutions, payment companies, asset managers, and stablecoin issuers seeking to deploy regulated digital assets across blockchains while meeting strict institutional standards for operational security.
About Wyoming Stable Token Commission
The Wyoming Stable Token Commission is a sovereign entity within the Wyoming state government, established in March 2023 under the Wyoming Stable Token Act. The Commission was tasked with the design, development, and deployment of the first fiat-backed, fully reserved stable token issued by a public entity in the United States. In January 2026, the Commission fulfilled that mandate with the launch of the Frontier Stable Token (FRNT). FRNT is backed by U.S. dollars and short-term U.S. Treasuries, with income generated from those reserves helping to diversify state revenues and support Wyoming’s School Foundation Program as a public good. Learn more at https://stabletoken.wyo.gov.
About Chainlink
Chainlink is the industry-standard oracle platform bringing the capital markets onchain and the market leader powering the majority of decentralized finance. The Chainlink stack provides the essential data, interoperability, compliance, and privacy standards needed to power advanced blockchain use cases for institutional tokenized assets, lending, payments, stablecoins, and more. Since inventing decentralized oracle networks, Chainlink has enabled tens of trillions in transaction value and now secures the vast majority of DeFi. Many of the world’s largest financial services institutions and leading Web3 protocols have adopted Chainlink standards and infrastructure. Learn more at chain.link.
View original content to download multimedia:https://www.prnewswire.com/news-releases/wyoming-stable-token-commission-migrates-to-chainlink-ccip-for-enhanced-operational-security-302854502.html
SOURCE Wyoming Stable Token Commission; Chainlink


Ramaco Resources, Inc. Announces Non-Binding Memorandum of Understanding with Indium Corporation

Jack Henry & Associates, Inc. Reports Fourth Quarter and Full Year Fiscal 2026 Results

FalconX, Interstice Connect Canton to Ethereum, Solana and Robinhood Chain

Send Rakhi to UK swiftly with UK Gifts Portal

Whiteboard Series with NEAR | Ep: 45 Joel Thorstensson from ceramic.network

New Gooseneck Omni Antennas Offer Enhanced Signals in a Durable Package

Why You Should Build on #NEAR – Co-founder Illia Polosukhin at CV Labs
Whiteboard Series with NEAR | Ep: 45 Joel Thorstensson from ceramic.network

NEAR End of Year Town Hall 2021: The Open Web World, MetaBUILD 2 Hackathon and 2021 recap
Trending
-

 Technology3 days ago
Brook Gaming Officially Launches Sniper 2 Flagship Keyboard and Mouse Converter for Cross-Platform Console Gaming
-

 Technology5 days ago
KAILAS Mountain Adventure Project Celebrates 20 Years of Exploration in Chengdu
-
 Technology5 days ago
LG to Unveil Its Next-Gen Humanoid Robot, Built on NVIDIA Isaac GR00T
-

 Near Videos4 days ago
Could you trust an AI agent with your data?
-

 Technology5 days ago
Agoda and Singapore Tourism Board Expand Partnership to Boost Demand and Tech Transformation in Tourism
-

 Technology5 days ago
Quanta Computer and Quantinuum Partner to Build an Industrial Foundation for Large-Scale Quantum Computing
-

 Coin Market4 days ago
Gen Z favors ETFs and trades less than older cohorts: Binance
-

 Coin Market5 days ago
SEC cancels key crypto regulatory meeting