
Technology
MasTec Announces Fourth Quarter and Annual 2023 Financial Results and Provides Initial 2024 Guidance

Published
3 years agoon
By

Record Fourth Quarter and Annual Revenue of $3.3 Billion and $12.0 Billion, RespectivelyFull Year 2023 Cash Flow from Operations of $687 Million, a 95% Increase Over Full Year 2022Fourth Quarter Reduction in Net Debt of $455 Million 2023 Results Include GAAP Net Loss of $47.3 Million, Adjusted Net Income of $156.7 Million, Adjusted EBITDA of $860.3 Million, Diluted Loss Per Share of $0.64 and Adjusted Diluted Earnings Per Share of $1.97Adjusted Diluted Earnings per Share was $0.22 Above the Prior Guidance EstimateIssuing Initial Annual 2024 Guidance Including Revenue of $12.5 Billion, a 4% Increase Over 2023, GAAP Net Income of $105 Million, Adjusted EBITDA of $955 Million, with Diluted Earnings Per Share of $1.04, and Adjusted Diluted Earnings Per Share of $2.69
CORAL GABLES, Fla., Feb. 29, 2024 /PRNewswire/ — MasTec, Inc. (NYSE: MTZ) today announced 2023 fourth quarter and full year financial results and issued its initial 2024 guidance expectation.
For the Fourth Quarter:
Fourth quarter 2023 revenue was up 9.0% to $3.3 billion, compared to $3.0 billion for the fourth quarter of 2022. GAAP net income was $1.2 million, or $0.01 per diluted share, compared to $3.4 million, or $0.04 per diluted share, in the fourth quarter of 2022.
Fourth quarter 2023 adjusted net income and adjusted diluted earnings per share, both non-GAAP measures, were $52.0 million and $0.66, respectively, as compared to $80.0 million and $1.03, respectively, in the fourth quarter of 2022.
Fourth quarter 2023 adjusted EBITDA, also a non-GAAP measure, was $231.4 million, compared to $257.9 million in the fourth quarter of 2022. Fourth quarter 2023 adjusted EBITDA margin rate was 7.1% of revenue.
18-month backlog as of December 31, 2023 was $12.4 billion, with sequential growth in each segment, excluding Oil & Gas, totaling $373 million. The Oil & Gas backlog decrease was primarily related to the expected 2024 completion of a large natural gas pipeline project.
Fourth quarter Cash Flow from Operations was very strong at almost $500 million, enabling significant net debt reduction. Net debt leverage ratio improved significantly from 3.4 times at the end of the third quarter to 2.9 times at yearend.
For the Full Year:
For the year ended December 31, 2023, revenue was up 23% to $12.0 billion, compared to $9.8 billion for the prior year. GAAP net loss was $47.3 million, or a loss of $0.64 per diluted share, compared to net income of $33.9 million, or earnings of $0.42 per diluted share in 2022.
Full year 2023 adjusted net income and adjusted diluted earnings per share, both non-GAAP measures, were $156.7 million and $1.97, respectively, compared to $234.8 million and $3.05, respectively, during 2022.
Full year 2023 adjusted EBITDA, also a non-GAAP measure, was up 10% to $860.3 million, compared to $780.6 million in 2022. Full year 2023 adjusted EBITDA margin rate was 7.2% compared to 8.0% last year.
Adjusted net income, adjusted diluted earnings per share, adjusted EBITDA and net debt, which are all non-GAAP measures, exclude certain items that are detailed and reconciled to the most comparable GAAP-reported measures in the attached Supplemental Disclosures and Reconciliation of Non-GAAP Disclosures.
Jose Mas, MasTec’s Chief Executive Officer, commented, “Fourth quarter results were in line with our expectations after a challenging 2023. We look forward to the opportunities we have this year and expect to deliver record levels of revenue and adjusted EBITDA in 2024. Demand is very strong for our services, and I expect 2024 will position us to deliver double digit revenue and earnings growth in 2025 and beyond.”
Mr. Mas continued, “I’d once again like to thank the 34,000 men and women of MasTec who work every day to build, maintain, and improve the nation’s communications, transportation, energy, and industrial infrastructure. It is hard work, and it’s because of them that we have great long-term opportunities.”
Paul DiMarco, MasTec’s Executive Vice President, and Chief Financial Officer, noted, “I’m pleased that we were able to finish 2023 with strong cash flow generation of almost $500 million in Q4, significantly exceeding our prior expectations. DSO, at 74 days was at its lowest level since mid-2017. We are keenly focused on capital allocation to ensure we are generating appropriate returns on the capital we deploy. We will continue to focus on improving the tools and processes we utilize to measure and optimize our performance, and to capitalize on the robust demand environment provided by our end markets.”
Based on the information available today, the Company is providing both first quarter and full year 2024 guidance. The Company currently expects full year 2024 revenue will approximate $12.5 billion, a record level. 2024 full year GAAP net income and diluted earnings per share are expected to approximate $105 million and $1.04, respectively. Full year 2024 adjusted EBITDA is expected to approximate $955 million, representing 7.6% of revenue, and adjusted diluted earnings per share is expected to approximate $2.69.
For the first quarter of 2024, the Company expects revenue of approximately $2.6 billion. First quarter 2024 GAAP net loss is expected to approximate $61 million, with GAAP diluted loss per share expected to approximate $0.88. First quarter 2024 adjusted EBITDA is expected to approximate $130 million or 5.0% of revenue, with adjusted diluted loss per share expected to approximate $0.48. The projected loss in the first quarter is the result of a normal seasonally slow quarter, project delays and project start-up costs.
Management will hold a conference call to discuss these results on Friday, March 1, 2024 at 9:00 a.m. Eastern Time. The call-in number for the conference call is (856) 344-9221 or (888) 256-1007 with a pass code of 4316181. Additionally, the call will be broadcast live over the Internet and can be accessed and replayed through the Investors section of the Company’s website at www.mastec.com. The webcast replay will be available for at least 30 days.
The following tables set forth the financial results for the periods ended December 31, 2023 and 2022:
Consolidated Statements of Operations
(unaudited – in thousands, except per share information)
For the Three Months Ended
December 31,
For the Years Ended
December 31,
2023
2022
2023
2022
Revenue
$ 3,280,083
$ 3,008,361
$ 11,995,934
$ 9,778,038
Costs of revenue, excluding depreciation and amortization
2,912,370
2,637,071
10,613,762
8,586,333
Depreciation
108,611
107,753
433,929
371,240
Amortization of intangible assets
42,981
54,666
169,233
135,908
General and administrative expenses
178,190
155,194
698,899
559,437
Interest expense, net
59,741
49,942
234,405
112,255
Equity in earnings of unconsolidated affiliates, net
(7,262)
(9,413)
(30,697)
(28,836)
Other (income) expense, net
(14,562)
539
(40,893)
(1,358)
Income (loss) before income taxes
$ 15
$ 12,609
$ (82,704)
$ 43,059
Benefit from (provision for) income taxes
1,177
(9,239)
35,408
(9,171)
Net income (loss)
$ 1,192
$ 3,370
$ (47,296)
$ 33,888
Net income attributable to non-controlling interests
439
146
2,653
534
Net income (loss) attributable to MasTec, Inc.
$ 753
$ 3,224
$ (49,949)
$ 33,354
Earnings (loss) per share:
Basic earnings (loss) per share
$ 0.01
$ 0.04
$ (0.64)
$ 0.45
Basic weighted average common shares outstanding
77,879
76,492
77,535
74,917
Diluted earnings (loss) per share
$ 0.01
$ 0.04
$ (0.64)
$ 0.42
Diluted weighted average common shares outstanding
78,288
77,770
77,535
76,185
Consolidated Balance Sheets
(unaudited – in thousands)
December 31,
2023
December 31,
2022
Assets
Current assets
$ 3,974,253
$ 3,859,127
Property and equipment, net
1,651,462
1,754,101
Operating lease right-of-use assets
418,685
279,534
Goodwill, net
2,126,366
2,045,041
Other intangible assets, net
784,260
946,299
Other long-term assets
418,485
409,157
Total assets
$ 9,373,511
$ 9,293,259
Liabilities and Equity
Current liabilities
$ 2,837,219
$ 2,496,037
Long-term debt, including finance leases
2,888,058
3,052,193
Long-term operating lease liabilities
292,873
194,050
Deferred income taxes
390,399
571,401
Other long-term liabilities
243,701
238,391
Total equity
2,721,261
2,741,187
Total liabilities and equity
$ 9,373,511
$ 9,293,259
Consolidated Statements of Cash Flows
(unaudited – in thousands)
For the Years Ended
December 31,
2023
2022
Net cash provided by operating activities
$ 687,277
$ 352,297
Net cash used in investing activities
(178,061)
(821,183)
Net cash (used in) provided by financing activities
(350,998)
480,897
Effect of currency translation on cash
751
(2,155)
Net increase in cash and cash equivalents
158,969
9,856
Cash and cash equivalents – beginning of period
$ 370,592
$ 360,736
Cash and cash equivalents – end of period
$ 529,561
$ 370,592
Backlog by Reportable Segment (unaudited – in millions)
December 31,
2023
September 30,
2023
December 31,
2022
Communications
$ 5,627
$ 5,299
$ 5,303
Clean Energy and Infrastructure
3,115
3,073
3,227
Power Delivery
2,440
2,437
2,709
Oil and Gas
1,225
1,681
1,740
Other
—
—
—
Estimated 18-month backlog
$ 12,407
$ 12,490
$ 12,979
Backlog is a common measurement used in our industry. Our methodology for determining backlog may not, however, be comparable to the methodologies used by others. Estimated backlog represents the amount of revenue we expect to realize over the next 18 months from future work on uncompleted construction contracts, including new contracts under which work has not begun, as well as revenue from change orders and renewal options. Our estimated backlog also includes amounts under master service and other service agreements and our proportionate share of estimated revenue from proportionately consolidated non-controlled contractual joint ventures. Estimated backlog for work under master service and other service agreements is determined based on historical trends, anticipated seasonal impacts, experience from similar projects and estimates of customer demand based on communications with our customers.
Supplemental Disclosures and Reconciliation of Non-GAAP Disclosures
(unaudited – in millions, except for percentages and per share information)
For the Three Months Ended
December 31,
For the Years Ended
December 31,
Segment Information
2023
2022
2023
2022
Revenue by Reportable Segment
Communications
$ 759.9
$ 858.6
$ 3,259.5
$ 3,233.7
Clean Energy and Infrastructure
1,067.4
1,125.0
3,962.0
2,618.6
Power Delivery
658.0
739.8
2,735.1
2,725.2
Oil and Gas
802.2
291.6
2,072.8
1,219.6
Other
—
—
—
—
Eliminations
(7.4)
(6.7)
(33.5)
(19.1)
Consolidated revenue
$ 3,280.1
$ 3,008.4
$ 11,995.9
$ 9,778.0
For the Three Months Ended
December 31,
For the Years Ended
December 31,
2023
2022
2023
2022
Adjusted EBITDA by Segment
EBITDA
$ 211.3
$ 225.0
$ 754.9
$ 662.5
Non-cash stock-based compensation expense (a)
9.0
8.6
33.3
27.4
Acquisition and integration costs (b)
11.0
26.6
71.9
86.0
Losses, net, on fair value of investment (a)
—
0.4
0.2
7.7
Project results from non-controlled joint venture (c)
—
(2.8)
—
(2.8)
Bargain purchase gain (a)
—
—
—
(0.2)
Adjusted EBITDA
$ 231.4
$ 257.9
$ 860.3
$ 780.6
Segment:
Communications
$ 57.7
$ 94.9
$ 291.7
$ 331.8
Clean Energy and Infrastructure
51.7
79.0
169.5
109.2
Power Delivery
52.8
56.8
216.3
241.9
Oil and Gas
95.5
33.6
284.4
171.5
Other
6.8
9.0
25.0
29.0
Segment Total
$ 264.5
$ 273.3
$ 986.9
$ 883.4
Corporate
(33.2)
(15.5)
(126.6)
(102.8)
Adjusted EBITDA
$ 231.4
$ 257.9
$ 860.3
$ 780.6
(a)
Non-cash stock-based compensation expense, losses, net, on the fair value of an investment and the bargain purchase gain from a prior year acquisition are included within Corporate EBITDA.
(b)
For the year ended December 31, 2023, Communications, Clean Energy and Infrastructure and Power Delivery EBITDA included $22.5 million, $37.1 million and $8.5 million respectively, of acquisition and integration costs related to our recent acquisitions, and Corporate EBITDA included $3.8 million of such costs. For the year ended December 31, 2022, Communications, Clean Energy and Infrastructure, Power Delivery, Oil and Gas and Corporate EBITDA included $4.7 million, $6.4 million, $39.0 million, $8.0 million and $27.9 million of such acquisition and integrations costs, respectively.
(c)
Project results from a non-controlled joint venture are included within Other segment results
Supplemental Disclosures and Reconciliation of Non-GAAP Disclosures
(unaudited – in millions, except for percentages and per share information)
For the Three Months Ended
December 31,
For the Years
Ended December 31,
2023
2022
2023
2022
Adjusted EBITDA Margin by Segment
EBITDA Margin
6.4 %
7.5 %
6.3 %
6.8 %
Non-cash stock-based compensation expense (a)
0.3 %
0.3 %
0.3 %
0.3 %
Acquisition and integration costs (b)
0.3 %
0.9 %
0.6 %
0.9 %
Losses, net, on fair value of investment (a)
— %
0.0 %
0.0 %
0.1 %
Project results from non-controlled joint venture (c)
— %
(0.1) %
— %
(0.0) %
Bargain purchase gain (a)
— %
— %
— %
(0.0) %
Adjusted EBITDA margin
7.1 %
8.6 %
7.2 %
8.0 %
Segment:
Communications
7.6 %
11.1 %
8.9 %
10.3 %
Clean Energy and Infrastructure
4.8 %
7.0 %
4.3 %
4.2 %
Power Delivery
8.0 %
7.7 %
7.9 %
8.9 %
Oil and Gas
11.9 %
11.5 %
13.7 %
14.1 %
Other
NM
NM
NM
NM
Segment Total
8.1 %
9.1 %
8.2 %
9.0 %
Corporate
— %
— %
— %
— %
Adjusted EBITDA margin
7.1 %
8.6 %
7.2 %
8.0 %
NM – Percentage is not meaningful
(a)
Non-cash stock-based compensation expense, losses, net, on the fair value of an investment and the bargain purchase gain from a prior year acquisition are included within Corporate EBITDA.
(b)
For the year ended December 31, 2023, Communications, Clean Energy and Infrastructure and Power Delivery EBITDA included $22.5 million, $37.1 million and $8.5 million respectively, of acquisition and integration costs related to our recent acquisitions, and Corporate EBITDA included $3.8 million of such costs. For the year ended December 31, 2022, Communications, Clean Energy and Infrastructure, Power Delivery, Oil and Gas and Corporate EBITDA included $4.7 million, $6.4 million, $39.0 million, $8.0 million and $27.9 million of such acquisition and integrations costs, respectively.
(c)
Project results from a non-controlled joint venture are included within Other segment results.
Supplemental Disclosures and Reconciliation of Non-GAAP Disclosures
(unaudited – in millions, except for percentages and per share information)
For the Three Months Ended
December 31,
For the Years Ended
December 31,
2023
2022
2023
2022
EBITDA and Adjusted EBITDA Reconciliation
Net income (loss)
$ 1.2
$ 3.4
$ (47.3)
$ 33.9
Interest expense, net
59.7
49.9
234.4
112.3
(Benefit from) provision for income taxes
(1.2)
9.2
(35.4)
9.2
Depreciation
108.6
107.8
433.9
371.2
Amortization of intangible assets
43.0
54.7
169.2
135.9
EBITDA
$ 211.3
$ 225.0
$ 754.9
$ 662.5
Non-cash stock-based compensation expense
9.0
8.6
33.3
27.4
Acquisition and integration costs
11.0
26.6
71.9
86.0
Losses, net, on fair value of investment
—
0.4
0.2
7.7
Project results from non-controlled joint venture
—
(2.8)
—
(2.8)
Bargain purchase gain
—
—
—
(0.2)
Adjusted EBITDA
$ 231.4
$ 257.9
$ 860.3
$ 780.6
For the Three Months Ended
December 31,
For the Years Ended
December 31,
2023
2022
2023
2022
EBITDA and Adjusted EBITDA Margin Reconciliation
Net income (loss)
0.0 %
0.1 %
(0.4) %
0.3 %
Interest expense, net
1.8 %
1.7 %
2.0 %
1.1 %
(Benefit from) provision for income taxes
(0.0) %
0.3 %
(0.3) %
0.1 %
Depreciation
3.3 %
3.6 %
3.6 %
3.8 %
Amortization of intangible assets
1.3 %
1.8 %
1.4 %
1.4 %
EBITDA margin
6.4 %
7.5 %
6.3 %
6.8 %
Non-cash stock-based compensation expense
0.3 %
0.3 %
0.3 %
0.3 %
Acquisition and integration costs
0.3 %
0.9 %
0.6 %
0.9 %
Losses, net, on fair value of investment
— %
0.0 %
0.0 %
0.1 %
Project results from non-controlled joint venture
— %
(0.1) %
— %
(0.0) %
Bargain purchase gain
— %
— %
— %
(0.0) %
Adjusted EBITDA margin
7.1 %
8.6 %
7.2 %
8.0 %
Supplemental Disclosures and Reconciliation of Non-GAAP Disclosures
(unaudited – in millions, except for percentages and per share information)
For the Three Months Ended
December 31,
For the Years Ended
December 31,
2023
2022
2023
2022
Adjusted Net Income Reconciliation
Net income (loss)
$ 1.2
$ 3.4
$ (47.3)
$ 33.9
Non-cash stock-based compensation expense
9.0
8.6
33.3
27.4
Amortization of intangible assets
43.0
54.7
169.2
135.9
Acquisition and integration costs
11.0
26.6
71.9
86.0
Losses, net, on fair value of investment
—
0.4
0.2
7.7
Project results from non-controlled joint venture
—
(2.8)
—
(2.8)
Bargain purchase gain
—
—
—
(0.2)
Income tax effect of adjustments (a)
(16.8)
(16.4)
(75.3)
(58.6)
Statutory and other tax rate effects (b)
4.6
5.5
4.6
5.5
Adjusted net income
$ 52.0
$ 80.0
$ 156.7
$ 234.8
For the Three Months Ended
December 31,
For the Years Ended
December 31,
2023
2022
2023
2022
Adjusted Diluted Earnings per Share Reconciliation
Diluted earnings (loss) per share
$ 0.01
$ 0.04
$ (0.64)
$ 0.42
Non-cash stock-based compensation expense
0.11
0.11
0.43
0.36
Amortization of intangible assets
0.55
0.70
2.16
1.78
Acquisition and integration costs
0.14
0.34
0.92
1.13
Losses, net, on fair value of investment
—
0.01
0.00
0.10
Project results from non-controlled joint venture
—
(0.04)
—
(0.04)
Bargain purchase gain
—
—
—
(0.00)
Income tax effect of adjustments (a)
(0.21)
(0.21)
(0.96)
(0.77)
Statutory and other tax rate effects (b)
0.06
0.07
0.06
0.07
Adjusted diluted earnings per share
$ 0.66
$ 1.03
$ 1.97
$ 3.05
(a)
Represents the tax effects of the adjusted items that are subject to tax, including the tax effects of non-cash stock-based compensation expense, including from share-based payment awards. Tax effects are determined based on the tax treatment of the related item, the incremental statutory tax rate of the jurisdictions pertaining to the adjustment, and their effects on pre-tax income.
(b)
For the years ended December 31, 2023 and 2022, includes the effect of statutory and other tax rate changes.
Calculation of Net Debt
December 31,
2023
December 31,
2022
Current portion of long-term debt, including finance leases
$ 177.2
$ 171.9
Long-term debt, including finance leases
2,888.1
3,052.2
Total Debt
$ 3,065.3
$ 3,224.1
Less: cash and cash equivalents
(529.6)
(370.6)
Net Debt
$ 2,535.7
$ 2,853.5
Supplemental Disclosures and Reconciliation of Non-GAAP Disclosures
(unaudited – in millions, except for percentages and per share information)
Guidance for the
Three Months
Ended March 31,
2024 Est.
For the Three
Months Ended
March 31, 2023
EBITDA and Adjusted EBITDA Reconciliation
Net loss
$ (61)
$ (80.5)
Interest expense, net
60
52.7
Benefit from income taxes
(23)
(44.7)
Depreciation
110
107.2
Amortization of intangible assets
34
41.9
EBITDA
$ 121
$ 76.6
Non-cash stock-based compensation expense
9
8.5
Acquisition and integration costs
—
17.1
Losses, net, on fair value of investment
—
0.2
Adjusted EBITDA
$ 130
$ 102.5
Guidance for the
Three Months
Ended March 31,
2024 Est.
For the Three
Months Ended
March 31, 2023
EBITDA and Adjusted EBITDA Margin Reconciliation
Net loss
(2.3) %
(3.1) %
Interest expense, net
2.3 %
2.0 %
Benefit from income taxes
(0.9) %
(1.7) %
Depreciation
4.2 %
4.1 %
Amortization of intangible assets
1.3 %
1.6 %
EBITDA margin
4.6 %
3.0 %
Non-cash stock-based compensation expense
0.4 %
0.3 %
Acquisition and integration costs
— %
0.7 %
Losses, net, on fair value of investment
— %
0.0 %
Adjusted EBITDA margin
5.0 %
4.0 %
Supplemental Disclosures and Reconciliation of Non-GAAP Disclosures
(unaudited – in millions, except for percentages and per share information)
Guidance for the
Three Months
Ended March 31,
2024 Est.
For the Three
Months Ended
March 31, 2023
Adjusted Net Loss Reconciliation
Net loss
$ (61)
$ (80.5)
Non-cash stock-based compensation expense
9
8.5
Amortization of intangible assets
34
41.9
Acquisition and integration costs
—
17.1
Losses, net, on fair value of investment
—
0.2
Income tax effect of adjustments (a)
(12)
(29.2)
Adjusted net loss
$ (29)
$ (41.9)
Guidance for the
Three Months
Ended March 31,
2024 Est.
For the Three
Months Ended
March 31, 2023
Adjusted Diluted Loss per Share Reconciliation
Diluted loss per share
$ (0.88)
$ (1.05)
Non-cash stock-based compensation expense
0.12
0.11
Amortization of intangible assets
0.43
0.54
Acquisition and integration costs
—
0.22
Losses, net, on fair value of investment
—
0.00
Income tax effect of adjustments (a)
(0.15)
(0.38)
Adjusted diluted loss per share
$ (0.48)
$ (0.54)
(a)
Represents the tax effects of the adjusted items that are subject to tax, including the tax effects of non-cash stock-based compensation expense, including from share-based payment awards. Tax effects are determined based on the tax treatment of the related item, the incremental statutory tax rate of the jurisdictions pertaining to the adjustment, and their effects on pre-tax income.
Supplemental Disclosures and Reconciliation of Non-GAAP Disclosures
(unaudited – in millions, except for percentages and per share information)
Guidance for the
Year Ended
December 31,
2024 Est.
For the Year
Ended December
31, 2023
For the Year
Ended December
31, 2022
EBITDA and Adjusted EBITDA Reconciliation
Net income (loss)
$ 105
$ (47.3)
$ 33.9
Interest expense, net
210
234.4
112.3
Provision for (benefit from) income taxes
33
(35.4)
9.2
Depreciation
436
433.9
371.2
Amortization of intangible assets
134
169.2
135.9
EBITDA
$ 917
$ 754.9
$ 662.5
Non-cash stock-based compensation expense
38
33.3
27.4
Acquisition and integration costs
—
71.9
86.0
Losses, net, on fair value of investment
—
0.2
7.7
Project results from non-controlled joint venture
—
—
(2.8)
Bargain purchase gain
—
—
(0.2)
Adjusted EBITDA
$ 955
$ 860.3
$ 780.6
Guidance for the
Year Ended
December 31,
2024 Est.
For the Year
Ended December
31, 2023
For the Year
Ended December
31, 2022
EBITDA and Adjusted EBITDA Margin Reconciliation
Net income (loss)
0.8 %
(0.4) %
0.3 %
Interest expense, net
1.7 %
2.0 %
1.1 %
Provision for (benefit from) income taxes
0.3 %
(0.3) %
0.1 %
Depreciation
3.5 %
3.6 %
3.8 %
Amortization of intangible assets
1.1 %
1.4 %
1.4 %
EBITDA margin
7.3 %
6.3 %
6.8 %
Non-cash stock-based compensation expense
0.3 %
0.3 %
0.3 %
Acquisition and integration costs
— %
0.6 %
0.9 %
Losses, net, on fair value of investment
— %
0.0 %
0.1 %
Project results from non-controlled joint venture
— %
— %
(0.0) %
Bargain purchase gain
— %
— %
(0.0) %
Adjusted EBITDA margin
7.6 %
7.2 %
8.0 %
Supplemental Disclosures and Reconciliation of Non-GAAP Disclosures
(unaudited – in millions, except for percentages and per share information)
Guidance for the
Year Ended
December 31,
2024 Est.
For the Year
Ended December
31, 2023
For the Year
Ended December
31, 2022
Adjusted Net Income Reconciliation
Net income (loss)
$ 105
$ (47.3)
$ 33.9
Non-cash stock-based compensation expense
38
33.3
27.4
Amortization of intangible assets
134
169.2
135.9
Acquisition and integration costs
—
71.9
86.0
Losses, net, on fair value of investment
—
0.2
7.7
Project results from non-controlled joint venture
—
—
(2.8)
Bargain purchase gain
—
—
(0.2)
Income tax effect of adjustments (a)
(41)
(75.3)
(58.6)
Statutory and other tax rate effects (b)
—
4.6
5.5
Adjusted net income
$ 234
$ 156.7
$ 234.8
Guidance for the
Year Ended
December 31,
2024 Est.
For the Year
Ended December
31, 2023
For the Year
Ended December
31, 2022
Adjusted Diluted Earnings per Share Reconciliation
Diluted earnings (loss) per share
$ 1.04
$ (0.64)
$ 0.42
Non-cash stock-based compensation expense
0.48
0.43
0.36
Amortization of intangible assets
1.69
2.16
1.78
Acquisition and integration costs
—
0.92
1.13
Losses, net, on fair value of investment
—
0.00
0.10
Project results from non-controlled joint venture
—
—
(0.04)
Bargain purchase gain
—
—
(0.00)
Income tax effect of adjustments (a)
(0.52)
(0.96)
(0.77)
Statutory and other tax rate effects (b)
—
0.06
0.07
Adjusted diluted earnings per share
$ 2.69
$ 1.97
$ 3.05
(a)
Represents the tax effects of the adjusted items that are subject to tax, including the tax effects of non-cash stock-based compensation expense, including from share-based payment awards. Tax effects are determined based on the tax treatment of the related item, the incremental statutory tax rate of the jurisdictions pertaining to the adjustment, and their effects on pre-tax income.
(b)
For the years ended December 31, 2023 and 2022, includes the effect of statutory and other tax rate changes.
The tables may contain slight summation differences due to rounding.
MasTec uses EBITDA and Adjusted EBITDA, as well as Adjusted Net Income, Adjusted Diluted Earnings Per Share and net debt, to evaluate our performance, both internally and as compared with its peers, because these measures exclude certain items that may not be indicative of its core operating results, as well as items that can vary widely across different industries or among companies within the same industry. MasTec believes that these adjusted measures provide a baseline for analyzing trends in its underlying business. MasTec believes that these non-U.S. GAAP financial measures provide meaningful information and help investors understand its financial results and assess its prospects for future performance. Because non-U.S. GAAP financial measures are not standardized, it may not be possible to compare these financial measures with other companies’ non-U.S. GAAP financial measures having the same or similar names. These financial measures should not be considered in isolation from, as substitutes for, or alternative measures of, reported net income or diluted earnings per share or total debt, and should be viewed in conjunction with the most comparable U.S. GAAP financial measures and the provided reconciliations thereto. MasTec believes these non-U.S. GAAP financial measures, when viewed together with its U.S. GAAP results and related reconciliations, provide a more complete understanding of its business. Investors are strongly encouraged to review the company’s consolidated financial statements and publicly filed reports in their entirety and not rely on any single financial measure.
MasTec, Inc. is a leading infrastructure construction company operating mainly throughout North America across a range of industries. The Company’s primary activities include the engineering, building, installation, maintenance and upgrade of communications, energy, utility and other infrastructure, such as: wireless, wireline/fiber and customer fulfillment activities; power delivery infrastructure, including transmission, distribution, environmental planning and compliance; power generation infrastructure, primarily from clean energy and renewable sources; pipeline infrastructure, including for natural gas, water and carbon capture sequestration pipelines and pipeline integrity services; heavy civil and industrial infrastructure, including roads, bridges and rail; and environmental remediation services. MasTec’s customers are primarily in these industries. The Company’s corporate website is located at www.mastec.com. The Company’s website should be considered as a recognized channel of distribution, and the Company may periodically post important, or supplemental, information regarding contracts, awards or other related news and webcasts on the Events & Presentations page in the Investors section therein.
This presentation contains forward-looking statements within the meaning of the Private Securities Litigation Reform Act. Forward-looking statements include, but are not limited to, statements relating to expectations regarding the future financial and operational performance of MasTec; expectations regarding MasTec’s business or financial outlook; expectations regarding MasTec’s plans, strategies and opportunities; expectations regarding opportunities, technological developments, competitive positioning, future economic conditions and other trends in particular markets or industries; the impact of inflation on MasTec’s costs and the ability to recover increased costs, as well as other statements reflecting expectations, intentions, assumptions or beliefs about future events and other statements that do not relate strictly to historical or current facts. These statements are based on currently available operating, financial, economic and other information, and are subject to a number of significant risks and uncertainties. A variety of factors in addition to those mentioned above, many of which are beyond our control, could cause actual future results to differ materially from those projected in the forward-looking statements. Other factors that might cause such a difference include, but are not limited to: market conditions, including from rising or elevated levels of inflation or interest rates, regulatory or policy changes, including permitting processes and tax incentives that affect us or our customers’ industries, supply chain issues and technological developments; the effect of federal, local, state, foreign or tax legislation and other regulations affecting the industries we serve and related projects and expenditures; project delays due to permitting processes, compliance with environmental and other regulatory requirements and challenges to the granting of project permits, which could cause increased costs and delayed or reduced revenue; the effect on demand for our services of changes in the amount of capital expenditures by our customers due to, among other things, economic conditions, including potential economic downturns, inflationary issues, the availability and cost of financing, supply chain disruptions, climate-related matters, customer consolidation in the industries we serve and/or the effects of public health matters; activity in the industries we serve and the impact on the expenditure levels of our customers of, among other items, fluctuations in commodity prices, including for fuel and energy sources, fluctuations in the cost of materials, labor, supplies or equipment, and/or supply-related issues that affect availability or cause delays for such items; the outcome of our plans for future operations, growth and services, including business development efforts, backlog, acquisitions and dispositions; risks related to completed or potential acquisitions, including our ability to integrate acquired businesses within expected timeframes, including their business operations, internal controls and/or systems, which may be found to have material weaknesses, and our ability to achieve the revenue, cost savings and earnings levels from such acquisitions at or above the levels projected, as well as the risk of potential asset impairment charges and write-downs of goodwill; our ability to manage projects effectively and in accordance with our estimates, as well as our ability to accurately estimate the costs associated with our fixed price and other contracts, including any material changes in estimates for completion of projects and estimates of the recoverability of change orders; our ability to attract and retain qualified personnel, key management and skilled employees, including from acquired businesses, our ability to enforce any noncompetition agreements, and our ability to maintain a workforce based upon current and anticipated workloads; any material changes in estimates for legal costs or case settlements or adverse determinations on any claim, lawsuit or proceeding; the adequacy of our insurance, legal and other reserves; the timing and extent of fluctuations in operational, geographic and weather factors, including from climate-related events, that affect our customers, projects and the industries in which we operate; the highly competitive nature of our industry and the ability of our customers, including our largest customers, to terminate or reduce the amount of work, or in some cases, the prices paid for services, on short or no notice under our contracts, and/or customer disputes related to our performance of services and the resolution of unapproved change orders; the effect of state and federal regulatory initiatives, including risks related to the costs of compliance with existing and potential future environmental, social and governance requirements, including with respect to climate-related matters; requirements of and restrictions imposed by our credit facility, term loans, senior notes and any future loans or securities; systems and information technology interruptions and/or data security breaches that could adversely affect our ability to operate, our operating results, our data security or our reputation, or other cybersecurity-related matters; our dependence on a limited number of customers and our ability to replace non-recurring projects with new projects; risks associated with potential environmental issues and other hazards from our operations; disputes with, or failures of, our subcontractors to deliver agreed-upon supplies or services in a timely fashion, and the risk of being required to pay our subcontractors even if our customers do not pay us; risks related to our strategic arrangements, including our equity investments; risks associated with volatility of our stock price or any dilution or stock price volatility that shareholders may experience, including as a result of shares we may issue as purchase consideration in connection with acquisitions, or as a result of other stock issuances; our ability to obtain performance and surety bonds; risks associated with operating in or expanding into additional international markets, including risks from fluctuations in foreign currencies, foreign labor and general business conditions and risks from failure to comply with laws applicable to our foreign activities and/or governmental policy uncertainty; risks related to our operations that employ a unionized workforce, including labor availability, productivity and relations, as well as risks associated with multiemployer union pension plans, including underfunding and withdrawal liabilities; risks associated with our internal controls over financial reporting, as well as other risks detailed in our filings with the Securities and Exchange Commission. We believe these forward-looking statements are reasonable; however, you should not place undue reliance on any forward-looking statements, which are based on current expectations. Furthermore, forward-looking statements speak only as of the date they are made. If any of these risks or uncertainties materialize, or if any of our underlying assumptions are incorrect, our actual results may differ significantly from the results that we express in, or imply by, any of our forward-looking statements. These and other risks are detailed in our filings with the Securities and Exchange Commission. We do not undertake any obligation to publicly update or revise these forward-looking statements after the date of this press release to reflect future events or circumstances, except as required by applicable law. We qualify any and all of our forward-looking statements by these cautionary factors.
View original content:https://www.prnewswire.com/news-releases/mastec-announces-fourth-quarter-and-annual-2023-financial-results-and-provides-initial-2024-guidance-302076476.html
SOURCE MasTec, Inc.

You may like
Technology
EVIDENT Expands Its Pramana Digital Pathology Portfolio to Support Small and Medium-Sized Labs
Published
32 minutes agoon
October 17, 2026By
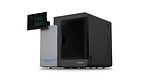
The new Pramana™ POD benchtop WSI scanner delivers autonomous imaging to help laboratories create pathologist-ready whole slide images with minimal operator intervention.
NEEDHAM, Mass., Oct. 16, 2026 /PRNewswire/ — Today, Evident announced the Pramana™ POD whole slide imaging (WSI) scanner, a new benchtop system designed to help laboratories produce trusted images. Built for small and medium-sized laboratories and specialty applications within larger institutions, the scanner helps make digital pathology adoption more accessible.
As pathology laboratories expand digital workflows amid increasing case volumes and operational demands, they need scanning systems that produce consistent, high-quality images across specimen types while integrating into existing laboratory workflows. Evident designed the Pramana POD scanner to address those needs, extending proven Pramana autonomous WSI technology to smaller laboratories.
“Pramana WSI technology has received tremendous acceptance from pathology labs across academic medical centers and network labs across the United States,” said Prasanth Perugupalli, Vice President of Digital Pathology, Evident. “By incorporating quality assurance into the whole slide imaging process, Pramana technology can help labs of varying sizes reduce the need for post-scan QA and the associated costs and delays.”
The Pramana POD scanner automates imaging with an advanced tissue finder, extensive label detection, and automated focal plane and scan-profile selection. Built-in image-quality assessment helps deliver pathologist-ready whole slide images and identify scans that may require further review. Volumetric imaging captures multiple focal planes to support the selection of sharp focal information across the scanned area, with true 40X imaging at 25 slides per hour under defined conditions.
The Pramana series of autonomous WSI scanners is well-suited for most brightfield imaging applications, including histopathology, core biopsies, hematology, cytology, and microbiology.
“Scientific advances move quickly, but laboratory infrastructure changes slowly,” Perugupalli added. “With the Pramana POD scanner, small and medium-sized labs can build as their needs evolve.”
To learn more about the Pramana POD benchtop WSI scanner, visit evidentscientific.com/products/slide-scanners/pramana-pod.
About EVIDENT
For over 100 years as Olympus, we set the industry standard for optical precision in microscopy, helping the world see what was once out of view. Today, as Evident, we continue to help scientists, physicians, and engineers illuminate the unseen with advanced imaging solutions that combine renowned optics with cutting-edge digital innovation.
Our life science portfolio supports research, clinical diagnostics, and education, offering a comprehensive range of imaging methods from essential brightfield and darkfield microscopy to advanced fluorescence, 4D analysis, and digital pathology. In industrial microscopy, we deliver precision and flexibility through laser scanning, digital, and semiconductor microscopes designed for tasks ranging from routine inspection to intricate quality control and manufacturing analysis.
Whether advancing new therapies, ensuring product integrity, or exploring the unknown, Evident is defining a new era of discovery with easy-to-use tools that help unlock hidden answers and empower exciting new breakthroughs.
Evident is headquartered in Tokyo and supported by R&D and manufacturing centers in Japan, the United States, Germany, and China, with operations and dedicated sales and service centers around the world. For more information, visit EvidentScientific.com.
For Research Use Only. Not for use in diagnostic procedures. Future clinical availability is subject to applicable regulatory authorization, and regulatory status and availability may vary by country. Performance varies by specimen type and workflow.
Pramana is a trademark of Evident Corporation or its subsidiaries.
View original content to download multimedia:https://www.prnewswire.com/news-releases/evident-expands-its-pramana-digital-pathology-portfolio-to-support-small-and-medium-sized-labs-302911714.html
SOURCE Evident
Technology
PhotonPay Secures UK EMI Licence, Advancing Its Global Payment Operating System
Published
33 minutes agoon
October 17, 2026By

HONG KONG, Oct. 17, 2026 /PRNewswire/ — PhotonPay, a next-generation payment operating system, today announced that it has secured an Electronic Money Institution (EMI) licence from the UK Financial Conduct Authority (FCA).
The licence enables PhotonPay to issue electronic money and provide regulated payment services in the UK within the scope of its authorisation. It further strengthens PhotonPay’s local capabilities in the market and supports the company in delivering broader payment and treasury solutions for businesses operating globally.
The UK is one of the world’s leading financial and commercial hubs, and an important gateway for businesses operating across Europe and international markets. As companies expand into more countries and regions, their financial needs are evolving beyond individual cross-border transactions toward more integrated management of accounts, collections, payouts, foreign exchange, cards and treasury operations.
For PhotonPay, entering a market means more than making products and services available. It requires building a local financial foundation that meets regulatory requirements and can support businesses over the long term. The EMI licence further strengthens PhotonPay’s position in the UK and provides an important foundation for deeper connectivity with local banks, payment networks and the broader financial ecosystem.
JP, Global Head of Compliance at PhotonPay, said:
“Securing our UK EMI licence marks an important milestone in the continued expansion of PhotonPay’s global regulatory footprint. Building a global payment operating system requires strong local regulatory foundations. This authorisation strengthens our ability to build for the long term in the UK, while supporting our continued expansion across more markets, currencies and payment networks. Ultimately, it enables us to deliver a more complete and efficient payment and treasury experience for businesses operating globally.”
As businesses expand internationally, the financial infrastructure behind their operations remains highly fragmented. Different markets operate across distinct account structures, payment networks, currencies and regulatory frameworks, often requiring businesses to manage multiple financial institutions, payment providers and systems at the same time.
PhotonPay is building its next-generation payment operating system around this complexity. Through a unified technology platform, the company connects local financial capabilities across markets, enabling businesses to manage global accounts, collections, payouts, foreign exchange, cards and embedded finance more centrally while reducing the operational complexity created by multiple markets, currencies and systems.
Real commerce is the foundation of this operating system. By continuously expanding its regulatory coverage, banking relationships, payment networks and underlying technology infrastructure, PhotonPay aims to ensure that financial infrastructure can scale alongside a business as it enters new markets and grows internationally.
Since its founding, PhotonPay has continued to expand its global regulatory and local market capabilities through entities across major financial markets. Today, PhotonPay has secured nearly 30 payment licences and related regulatory authorisations worldwide, supporting capabilities across global accounts, collections, payouts, foreign exchange, cards and embedded finance.
The UK EMI licence represents another step in the continued development of PhotonPay’s global regulatory network. Looking ahead, PhotonPay will continue to deepen its local regulatory and financial capabilities in key markets, connect more markets, currencies and payment networks, and advance the development of its next-generation global payment operating system.
About PhotonPay
PhotonPay is a next-generation payment operating system designed for businesses operating globally. Across global accounts, collections, payouts, foreign exchange, cards and embedded finance, PhotonPay connects banks, payment networks and local financial infrastructure to help businesses manage global money movement more efficiently and expand into new markets with greater operational simplicity.
View original content to download multimedia:https://www.prnewswire.com/apac/news-releases/photonpay-secures-uk-emi-licence-advancing-its-global-payment-operating-system-302911540.html
SOURCE PhotonPay
Technology
Canada to advance global nature conservation and climate action at upcoming United Nations conferences
Published
4 hours agoon
October 16, 2026By

OTTAWA, ON, Oct. 16, 2026 /CNW/ — In a more uncertain and increasingly unstable world, Canada is stepping up to build a safer and more resilient future. Addressing climate change and biodiversity loss requires ambitious action at home and around the world. By advancing progress on both, Canada will protect nature, build resilient communities, and create lasting prosperity for future generations. International cooperation is key to achieving these goals.
That is why the Honourable Julie Dabrusin, Minister of the Environment, Climate Change and Nature, will lead Canada’s efforts as Head of Delegation at the 17th meeting of the Conference of the Parties to the Convention on Biological Diversity (COP17) and the 31st meeting of the Conference of the Parties to the United Nations Framework Convention on Climate Change (COP31).
At COP17, Minister Dabrusin and the Honourable Nathalie Provost, Secretary of State (Nature), will work with international partners to accelerate implementation of the Kunming–Montréal Global Biodiversity Framework. From October 19 to 30, 2026, in Yerevan, Armenia, Canada will champion the critical role of Indigenous peoples in conservation and advocate for practical solutions to mobilize global resources for biodiversity finance. Canada will showcase its leadership through two Canadian-led official side events focused on innovative nature finance and the essential role of Indigenous leadership in advancing conservation efforts at home and around the world. The delegation will also take part in strategic bilateral meetings, high-level roundtables, and civil society events to strengthen cooperation, advance solutions, and drive action to halt and reverse biodiversity loss.
From November 9 to 20, 2026, in Antalya, Türkiye, Canada will participate in the 31st Conference of the Parties to the United Nations Framework Convention on Climate Change (COP31). Building on multilateral engagements, including the 10th Ministerial on Climate Action, Canada will continue working with international partners, Indigenous representatives, civil society, youth, and other stakeholders to strengthen the resilience of vulnerable communities; reduce methane emissions; accelerate electrification; and mobilize finance and investments from public and private sources. For the fifth consecutive year, Canada will host a national pavilion at COP31, showcasing Canadian climate leadership and innovation. The Canada Pavilion will serve as a hub for connection and collaboration.
Canada’s international leadership is backed by action at home. To accelerate electrification, Canada is building major clean energy projects across the country, including with the largest clean energy investment in North American history in Churchill Falls. Through A Force of Nature: Canada’s Strategy to Protect Nature and $3.8 billion in investments and funding, Canada is advancing its commitment to conserve 30% of lands and waters by 2030 through strong partnerships and innovative approaches to conservation. Canada recently reinforced this commitment by joining the 30×30 for Nature and People Ministerial Declaration at the 81st session of the United Nations General Assembly. Prime Minister, Mark Carney, recently announced a historic investment of $1.2 billion to better protect Canada’s oceans and the life they sustain. This will increase monitoring, strengthen ocean science and ecosystem protections, and improve marine incident prevention and preparedness. These priorities will be a key focus at both upcoming conferences.
Canada’s delegations to COP17 and COP31 will bring together the diverse perspectives from across Canadian society, including Indigenous representatives, civil society, the private sector, youth, and provincial and territorial government representatives. Working with international partners, these delegations help advance practical solutions to protect nature, strengthen resilience, and support sustainable economic prosperity.
Quotes
“Climate change and biodiversity loss are global challenges that no country can solve alone. At COP17 and COP31, Canada will work with partners from around the world to strengthen implementation of the Kunming–Montréal Global Biodiversity Framework and the Paris Agreement and collective efforts to address nature protection and climate change. Through international cooperation, Indigenous leadership, innovative solutions, and a collective commitment to conservation and climate action, we will build a sustainable future for people and nature alike.”
– The Honourable Julie Dabrusin, Minister of the Environment, Climate Change and Nature
“Nature loss is a global challenge that requires countries to work together and turn shared commitments into action. At COP17, Canada will share its experiences in advancing nature finance, including innovative approaches to valuing natural capital and mobilizing private investment for conservation. By exchanging ideas, lessons learned, and practical solutions with international partners, we can accelerate progress toward our global biodiversity goals and recognize nature as a foundation of long-term economic prosperity and resilience.”
– The Honourable Nathalie Provost, Secretary of State (Nature)
Quick facts
As the second largest country in the world, Canada has a vast amount of natural capital, including 24% of the world’s boreal forest, 37% of lakes, 25% of wetlands, and approximately 80,000 species. We have both a responsibility to steward these resources as well as a competitive advantage because of these assets.Canada hosted the 15th meeting of the Conference of the Parties to the United Nations Convention on Biological Diversity (COP15) in Montréal in 2022, which resulted in the adoption of the Kunming–Montréal Global Biodiversity Framework: an ambitious global plan to halt and reverse biodiversity loss by 2030.Canada supports the Armenian COP17 presidency and its approach to strengthen implementation of the Kunming–Montréal Global Biodiversity Framework toward meeting the Framework’s goals and targets.In September 2026, Canada and China co-chaired the Kunming Dialogue in Kunming, China. The Dialogue was a multilateral working-level meeting to discuss progress and challenges in the implementation of the Framework ahead of COP17.The Canada Pavilion at the United Nations Conference of the Parties (COP) is a key space to show Canadian climate leadership and innovation.Reducing methane emissions remains one of the fastest and most cost-effective ways to limit the rise of near-term global temperatures. Canada serves as co-convenor of the Global Methane Pledge, which counts 159 participating countries and the European Commission, with participants agreeing to take voluntary actions toward a collective goal of reducing global methane emissions at least 30% by 2030 (from 2020 levels).In April 2026, Canada announced a new goal of delivering $13 billion in international climate finance over the next five years.
Associated links
A Force of Nature: Canada’s Strategy to Protect NaturePrime Minister Carney Announces Historic Investment to Protect Canada’s OceansCanada Pavilion at the Conference of the Parties (COP)
Environment and Climate Change Canada’s X page
Environment and Climate Change Canada’s Facebook page
Environment and Natural Resources in Canada’s Facebook page
Environment and Climate Change Canada’s LinkedIn page
Environment and Climate Change Canada’s Instagram page
SOURCE Environment and Climate Change Canada


EVIDENT Expands Its Pramana Digital Pathology Portfolio to Support Small and Medium-Sized Labs

PhotonPay Secures UK EMI Licence, Advancing Its Global Payment Operating System
Canada to advance global nature conservation and climate action at upcoming United Nations conferences

Send Rakhi to UK swiftly with UK Gifts Portal

Whiteboard Series with NEAR | Ep: 45 Joel Thorstensson from ceramic.network

Nullmax and Renesas Forge Strategic Partnership to Deliver Competitive ADAS Solutions for the Global Market

Why You Should Build on #NEAR – Co-founder Illia Polosukhin at CV Labs
Whiteboard Series with NEAR | Ep: 45 Joel Thorstensson from ceramic.network

NEAR End of Year Town Hall 2021: The Open Web World, MetaBUILD 2 Hackathon and 2021 recap
Trending
-

 Technology4 days ago
Mesa School of Business raises ₹110 crore to expand its portfolio of programmes for the AI era
-

 Technology4 days ago
Cresta Launches Deputy Agent: an AI Agent That Keeps Working Long After the Customer Hangs Up
-

 Technology4 days ago
PayJoy to Acquire Strategic Assets of Finia AI, Advancing AI Underwriting and Financial Product Innovation
-

 Technology5 days ago
JK Tech Names Mahesh Ramakrishnan as New Chief Technology Officer
-

 Technology4 days ago
Intellistake Highlights NanoAi’s Collaboration With Global Defense Helmet Leader Gentex Corporation
-

 Technology4 days ago
Fraikin announces exclusive agreement with Asterion Industrial Partners to support its next phase of growth
-
 Technology5 days ago
Flex Expands Prefabricated Modular Data Center Portfolio to Accelerate AI Factory Deployment
-
 Technology5 days ago
ASE Technology Holding Co., Ltd. Announces Monthly Net Revenues*