Connect with us

Technology

INRIX: Remote and Hybrid Work Shift Can’t Curb Congestion

Published

on

New York City (101 hours) topped the 2023 Global Traffic Scorecard, followed by Mexico City and London.Americans lost an average of 42 hours to congestion, up 11% from 2022, costing $733 per driver.Midday trips in the U.S. have increased 23% compared to 2019, with nearly as many trips taken at 12:00 PM as there are at 5:00 PM.Trip analysis indicates 10:00 AM to 4:00 PM is the new ‘9-to-5.’The most congested road in America was Orlando’s I-4 Westbound from Beachline Expressway to Western Beltway, followed LA’s I-5, I-95 in Stamford, and New York’s I-278.

KIRKLAND, Wash., June 25, 2024 /PRNewswire/ — Today, INRIX, Inc., a global leader in transportation data and analytics, released the 2023 Global Traffic Scorecard that identified and ranked congestion and commuting trends in nearly 1,000 cities, across 37 countries. New York City once again topped the global ranking, followed by Mexico City and London. U.S. cities held two spots in the top five and four in the top 10.

“Traffic congestion is both a bane and a barometer of economic health; it symbolizes bustling activity yet simultaneously hampers it,” said Bob Pishue, transportation analyst at INRIX. “Reflecting on 2023 and early 2024, the surge in traffic congestion in urban areas indicated a revival of economic hubbub post-COVID, but it also led to billions of dollars in lost time for drivers.” Despite signs of recovery, though, some aspects of the pandemic are sticking around. Pishue continued, “Although congestion is returning to pre-COVID levels, we’re seeing interesting changes in congestion patterns due to the lingering effects of the pandemic. The continuation of hybrid and remote work is creating new travel peaks from what we’ve seen previously.”

America’s Gridlock is Worse Than Ever
New York City is followed by Chicago (96 hours) and Los Angeles (89 hours) as the most congested cities in the United States. This is New York City’s second year in the top spot, despite a 4% reduction in overall congestion. The typical U.S. driver lost 42 hours to traffic congestion and lost $733 worth of time, up nearly $100 from last year.

Table 1: 10 Most Congested Urban Areas in the U.S.

2023 US
Rank
(2022
Rank)

Urban Area

2023
Delay
(2022)

Compared
to
Pre-
COVID

2023
Cost per
Driver

2023
Cost
per
City

Downtown
Speed 
(mph)

Q1 2024
vs Q1
2023

1 (1)

New York City, NY

101 (105)

11 %

$1,762

$9.1 B

11

-11 %

2 (2)

Chicago, IL

96 (87)

18 %

$1,672

$6.1 B

11

-8 %

3 (3)

Los Angeles, CA

89 (78)

-4 %

$1,545

$8.3 B

19

-5 %

4 (4)

Boston, MA

88 (78)

-1 %

$1,543

$2.9 B

10

-10 %

5 (6)

Miami, FL

70 (66)

18 %

$1,219

$3.1 B

14

-1 %

6 (5)

Philadelphia, PA

69 (67)

2 %

$1,209

$2.9 B

11

-9 %

7 (8)

Washington, DC

63 (52)

-9 %

$1,095

$2.7 B

11

-4 %

8 (7)

Houston, TX

62 (55)

1 %

$1,082

$3.2 B

17

-1 %

9 (9)

Atlanta, GA

61 (51)

-3 %

$1,066

$2.6 B

16

-4 %

10 (12)

Seattle, WA

58 (46)

-11 %

$1,010

$1.6 B

17

-1 %

In addition to being the most congested urban area, New York City saw a staggering 13% increase in downtown trips in 2023 compared to 2022, followed by Atlanta, Philadelphia, and Washington D.C. (7%). Nine out of 10 of the United States’ largest metros saw a year-over-year increase in downtown trips. Trip analysis also revealed the traditional 9-to-5 workday has transformed into to a new 10-to-4 schedule. The shift in off-peak commuting and workday hours are likely fueled by the continued prevalence of remote and hybrid work.

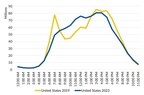
A New Midday Rush Hour
The uptick in congestion comes alongside the emergence of a new phenomenon: the midday rush hour. As Graph 1 illustrates, morning hourly commute trips in 2023 were down about 12% compared to 2019 and the PM peak (3-6 PM) was down just 9%. However, average hourly traffic during the midday was up an astonishing 23%, a trend that has continued to remain since 2020.

Overall, the data shows that per hour, nearly the same number of trips start during the midday as the evening commute period, typically the most congested period of the day.

The Most Congested Corridors in the U.S.
Across the United States, traffic delays on the busiest corridors have generally improved since 2022. Notably, the highest peak delay in 2023 was 2.5 hours less than the peak delay in 2022. A striking example of changing patterns is the I-4 in Orlando, Florida, which surged from 10th place in 2022 to the top in 2023. During peak hours, drivers lost 31 minutes on the I-4 westbound, on par with Los Angeles’ notorious I-5 congestion.

In Stamford, Connecticut, the I-95 corridor demonstrated significant congestion in both directions, earning it the third and fourth spots on the list of most congested U.S. corridors. Northbound travelers on the 30-mile stretch of I-95 lost an average of 29 minutes daily, while those heading southbound faced a slightly lower but still substantial delay of 28 minutes each day.

Table 1: 10 Most Congested U.S. Roads in 2023

Rank

Urban Area

Road Name

From

To

Peak Hour

2023 Peak
Minutes
Lost

2023
Hours
Lost

1

Orlando, FL

I-4 W

Beachline Expy

Western Bltwy

5:00 PM

31

124

2

Los Angeles, CA

I-5 S

I-10

I-605

5:00 PM

31

122

3

Stamford, CT

I-95 N

Sherwood Isl Conn

Warren St

4:00 PM

29

116

4

Stamford, CT

I-95 S

Compo Road S

Indian Field Rd

8:00 AM

28

111

5

New York, NY

I-278 W

I-495

Tillary St

4:00 PM

21

82

6

Miami, FL

I-95 N

NW 46th St

NW 151st St

5:00 PM

20

82

7

Boston, MA

I-93 S

Zakim Bridge

Pilgrim’s Hwy

3:00 PM

20

81

8

Baton Rouge, LA

I-10 E

N Lobdell Hwy

I-12

4:00 PM

17

70

9

Stamford, CT

I-95 N

Indian Field Rd

Compo Road S

5:00 PM

17

68

10

Chicago, IL

I-94 E

I-290

I-57

4:00 PM

17

66

Congestion Climbs Worldwide
New York, Mexico City, London, Paris, and Chicago were the top five most congested urban areas in the Global Congestion Impact Ranking. Out of the top 100 ranked urban areas, 98 experienced more delay than in 2022, and in 71 areas, that delay grew by more than 10%. Just under half, however, have reached their 2019, pre-COVID level of delay.

Table 2: 10 Most Congested Cities in the World in 2023

 2023
 Impact
Rank 
(2022 Rank)

Urban Area

Country

2023 Delay
 per Driver
 (hours)

Change from
2022

Change
from Pre-
COVID

Downtown
Speed (mph)

Q1
2024
Change

1 (1)

New York City,
NY

USA

101

-4 %

11 %

11

-11 %

2 (4)

Mexico City

MEX

96

13 %

-11 %

12

-5 %

3 (2)

London

UK

99

2 %

3 %

10

-10 %

4 (3)

Paris

FRA

97

4 %

1 %

10

-3 %

5 (5)

Chicago IL

USA

96

10 %

18 %

11

-8 %

6 (6)

Istanbul

TUR

91

12 %

20 %

13

5 %

7 (7)

Los Angeles CA

USA

89

13 %

-4 %

19

-5 %

8 (8)

Boston MA

USA

88

14 %

-1 %

10

-10 %

9 (13)

Cape Town

ZAF

83

32 %

-10 %

12

7 %

10 (16)

Jakarta

IDN

65

33 %

-24 %

13

16 %

The Road to Combatting Congestion
Access to reliable data is the first step in tackling congestion. Applying big data to create intelligent transportation systems is key to solving urban mobility problems. INRIX data and analytics on mobility, traffic signals, parking and population movement help city planners and engineers make data-based decisions to prioritize spending to maximize benefits and reduce costs now and into the future.

The key findings of the INRIX 2023 Global Traffic Scorecard provide a quantifiable benchmark for governments and cities across the world to measure progress to improve urban mobility and track the impact of spending on smart city initiatives.

Please visit www.inrix.com/scorecard for:

Full 2023 Global Traffic Scorecard reportInteractive webpage with data and information for nearly 1,000 cities and 37 countriesComplete methodology

Notes to Editors:
Data Sources
INRIX aggregates anonymous data from diverse datasets – such as phones, cars, trucks and cities – that leads to robust and accurate insights. The data used in the 2023 Global Traffic Scorecard is the congested or uncongested status of every segment of road for every minute of the day, as used by millions of drivers around the world that rely on INRIX-based traffic services.

Data used to complete the 2023 Scorecard and Q1 Update spans more than 15 months. The Scorecard incorporated three years of historical data to provide a complete year-over-year comparison of congestion and mobility. A multi-year approach enables the identification of trends in the world’s largest urban areas and provides a basis for comparison.

Research Methodology
The 2023 Global Traffic Scorecard provides the most up-to-date methodology to better understand movement in urban areas across the world. The 2023 Scorecard continues to include travel delay comparisons, collision trends and last-mile speeds based on the unique commuting patterns within each metro area, yet the latest origin-and-destination patterns accommodate the latest commuting behavior shifts.

Commute times were calculated by looking exclusively at the time it takes to get to and from major employment centers within an urban area from surrounding commuting neighborhoods. Our newest methodology, updated for this Scorecard, more accurately estimates commute distance using actual, observed trips. In general, this has placed downward pressure on commuting delays versus prior Scorecards, as observed trips tended to be shorter than previously estimated.

These changes were run for the years 2019, 2022 and 2023, along with the Q1 Update provided in this document. Q1 update is a special update for this version of the Global Traffic Scorecard and measures the change in average peak period travel times between January-March 2024 and January-March 2023.
Economic costs are calculated based on the following hourly values of time, which were based on U.S. Federal Highway Administration’s Revised Departmental Guidance on Valuation of Travel Time for Economic Analysis, 2016.  Adjusted for inflation, the rates are the following: $17.45 per hour in the U.S., £9.12 per hour in the U.K. and 10.67 € per hour in Germany. Individual urban areas may have higher, or lower, values of time depending on local economic conditions.

The 2023 Scorecard values time lost by analyzing peak speed and free-flow speed data for the busiest commuting corridors and sub areas as identified by origin and destination patterns unique to that area. Total time lost is the difference in travel times experienced during the peak periods compared to free-flow conditions on a per driver basis. In other words, it is the difference between driving during commute hours versus driving at night with little traffic.

About INRIX
Founded in 2004, INRIX pioneered intelligent mobility solutions by transforming big data from connected devices and vehicles into mobility insights. For nearly two decades, INRIX has harnessed machine learning and artificial intelligence to deliver precise and actionable mobility data. This revolutionary approach enabled INRIX to become one of the leading providers of data and analytics into how people move. By empowering cities, businesses, and people with valuable insights, INRIX is helping to make the world smarter, safer, and greener. With partners and solutions spanning across the entire mobility ecosystem, INRIX is uniquely positioned at the intersection of technology and transportation – whether its keeping road users safe, improving traffic signal timing to reduce delay and greenhouse gasses, optimizing last-mile delivery, or helping uncover market insights. Learn more at INRIX.com.

View original content to download multimedia:https://www.prnewswire.com/news-releases/inrix-remote-and-hybrid-work-shift-cant-curb-congestion-302181067.html

SOURCE INRIX, Inc.

Continue Reading
Click to comment

Leave a Reply

Your email address will not be published. Required fields are marked *

Technology

Chef Robotics Physical AI Models Can Now Automate Baked Goods Packing

Published

on

By

SAN FRANCISCO, April 29, 2026 /PRNewswire/ — Chef Robotics, a leader in physical AI for the food industry, today announced that Chef robots can now automate tray assembly for baked goods packing. The application places baked products, such as burger buns, chocolate chip cookies, biscotti, butter cookies, biscuits, fortune cookies, granola bars, rusks, and shortbreads into trays and packaging containers before sealing.

Watch Chef robots in action.

Baked goods packing has historically been difficult to automate for high-mix production. Each item behaves differently on the production line—a granola bar compresses under the wrong grip, while a biscotti or rusk can crack if placed at the wrong angle. Surface textures range from glazed and smooth to crumbly and irregular, and strict presentation requirements leave little room for error. This variability has made it challenging for automation systems to reliably handle baked goods at production speeds, leaving food manufacturers dependent on manual labor and traditional bakery equipment.

To address this, Chef built its baked goods packing application on its existing piece-picking capability, which uses Chef’s AI-powered computer vision and physical AI models trained across diverse real-world production environments. This allows Chef robots to assess each item’s position, shape, and orientation in real time and determine how to pick the items from the pan and place them quickly and precisely without damaging them.

The baked goods packing application supports four distinct placement capabilities.

First, Chef’s vision system detects the angle at which each item sits in the pan and reorients it after picking, placing it on the tray at the exact angle required, regardless of its original position, enabling retail-ready presentation for SKUs that require precise angular placement.

Second, Chef robots can place multiple baked goods into the same packaging container in a single automated pass, completing full tray assembly without manual intervention.

Third, for packaging containers with multiple small compartments, Chef robots can precisely place items into each designated section, including multiple items in the same compartment, using Chef’s AI vision model to detect compartment positions and orientations in real time.

Fourth, Chef’s vision system identifies the exact center of each tray and places every item at a predefined offset from that center, ensuring a uniform, consistent arrangement across every pack regardless of how trays arrive on the conveyor.

For food manufacturers evaluating bakery systems and baked goods packaging automation, the application offers higher throughput, reduced labor dependency, and consistent presentation across shifts. The capability runs on Chef’s existing robotic hardware and software, allowing manufacturers to deploy it without requiring any changes to their production lines.

Chef’s baked goods packing application is available in the U.S., Canada, Germany, and the UK and is included as part of Chef’s robotics-as-a-service (RaaS) pricing model.

About Chef Robotics
Chef is the first company to have commercialized a scalable AI-driven food robotics solution. With over 104 million servings made in production, Chef leverages ChefOS, an AI platform for food manipulation, to offer a Robotics-as-a-Service solution that helps industry-leading food companies increase production volume and meet demand. Headquartered in San Francisco, CA, Chef aims to empower humans to do what humans do best by accelerating the advent of intelligent machines. Visit https://chefrobotics.ai to learn more.

View original content:https://www.prnewswire.com/news-releases/chef-robotics-physical-ai-models-can-now-automate-baked-goods-packing-302756923.html

SOURCE Chef Robotics

Continue Reading

Technology

Air Products to Expand Industrial Gas Supply for Samsung Electronics’ Next-Generation Semiconductor Fab in South Korea

Published

on

By

New investment underscores the company’s long-term commitment to Korea and its leading role in the global semiconductor industry 

LEHIGH VALLEY, Pa., April 29, 2026 /PRNewswire/ — Air Products (NYSE:APD), a world-leading industrial gases company and serving Samsung globally, today announced it has been selected by Samsung to supply industrial gases for its new advanced semiconductor fab in Pyeongtaek, Gyeonggi Province, South Korea.

Under the agreement, Air Products will build, own and operate multiple state-of-the-art production facilities and a bulk specialty gas supply system to supply nitrogen, oxygen, argon, and hydrogen for Samsung’s new semiconductor fab. The new facilities are expected to come onstream in multiple phases from 2028 through 2030.

Air Products has a long track record of executing multiple phase expansions in Pyeongtaek to support Samsung’s growing manufacturing needs. This latest project represents Air Products’ largest investment to date in the semiconductor industry and will establish Pyeongtaek as the company’s single largest operations site globally supporting the electronics industry. 

“Air Products is honored to be selected once again by Samsung and to have their continued confidence as a trusted partner supporting their strategic growth plans,” said SR Kim, President, Air Products Korea. “This significant investment reinforces Air Products’ role as a leading global supplier to the semiconductor industry and underscores our long-standing commitment to supporting our strategic customers with safety, reliability, efficiency and excellent service.”

Air Products has served the global electronics industry for more than 40 years, supplying industrial gases safely and reliably to many of the world’s leading technology companies. The company has operated in Korea for more than 50 years and has established a strong position in electronics and manufacturing sectors.

About Air Products

Air Products (NYSE: APD) is a world-leading industrial gases company in operation for over 85 years focused on serving energy, environmental, and emerging markets and generating a cleaner future. The Company supplies essential industrial gases, related equipment and applications expertise to customers in dozens of industries, including refining, chemicals, metals, electronics, manufacturing, medical and food. As the leading global supplier of hydrogen, Air Products also develops, engineers, builds, owns and operates some of the world’s largest clean hydrogen projects, supporting the transition to low- and zero-carbon energy in the industrial and heavy-duty transportation sectors. Through its sale of equipment businesses, the Company also provides turbomachinery, membrane systems and cryogenic containers globally.

Air Products had fiscal 2025 sales of $12 billion from operations in approximately 50 countries. For more information, visit airproducts.com or follow us on LinkedInXFacebook or Instagram.

This release contains “forward-looking statements” within the safe harbor provisions of the Private Securities Litigation Reform Act of 1995. These forward-looking statements are based on management’s expectations and assumptions as of the date of this release and are not guarantees of future performance. While forward-looking statements are made in good faith and based on assumptions, expectations and projections that management believes are reasonable based on currently available information, actual performance and financial results may differ materially from projections and estimates expressed in the forward-looking statements because of many factors, including the risk factors described in our Annual Report on Form 10-K for the fiscal year ended September 30, 2025 and other factors disclosed in our filings with the Securities and Exchange Commission. Except as required by law, we disclaim any obligation or undertaking to update or revise any forward-looking statements contained herein to reflect any change in the assumptions, beliefs or expectations or any change in events, conditions or circumstances upon which any such forward-looking statements are based.

View original content to download multimedia:https://www.prnewswire.com/news-releases/air-products-to-expand-industrial-gas-supply-for-samsung-electronics-next-generation-semiconductor-fab-in-south-korea-302757497.html

SOURCE Air Products

Continue Reading

Trending