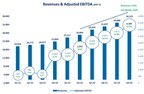
Company Delivers 7th Consecutive Quarter of Expanding Revenues and Profits
Management Reviews Financial Results and Provides Business Update on Quarterly Webcast
CHARLOTTE, N.C., Aug. 28, 2024 /PRNewswire/ — TAT Technologies Ltd. (NASDAQ: TATT) (TASE: TATT) (“TAT” or the “Company”), a leading provider of products and services to the commercial and military aerospace and ground defense industries, reported today its unaudited results for the three-month and six-month period ended June 30, 2024.
Financial Highlights for the Second Quarter and First Six Months of 2024:
Revenues increased by 36.2% to $36.5 million compared to $26.8 million for the second quarter of 2024. For the first half of 2024 revenues increased by 36% to 70.6$ million compared to $52 million in the first half of 2023.Gross profit increased by 47.1% to $8.0 million compared to $5.4 million for the second quarter of 2023 (21.9% of revenues in Q224 compared to 20.2% of revenues in Q223). For the first half of 2024 gross profit increase by 55.4% to $15.1 million compared to $9.7 million in the first half of 2023 (20.9% of revenues in H124 compared to 18.6% of revenues in H123)Operating Income increased by 78.5% to $2.7 million compared to $1.5 million in Q223, (7.5% of revenues in Q224 compared to 6.5% of revenues in Q223). For the first half of 2024 operating income increased by 99% to $4.9 million compared to $2.5 million in the first half of 2023 (7% of revenues in H124 compared to 4.8% of revenues in H123).Net Income increased by 78% to $2.6 million compared to $1.5 million in the second quarter of 2023. For the first half of 2024 net income increased by 122% to $4.7 million compared to $2.1 million in the first half of 2023.Adjusted EBITDA increased by 69.4% to $4.3 million (11.9% of revenues) compared to $2.6 million (9.6% of revenues) in the second quarter of 2023. Adjusted EBITDA for the first half of 2024 increased by 73% to $8 million compared $4.6 in the first half of 2023 (11.4% of revenues in H124 compared to 9% in H123).Cash flow from operating activities was negative $(4.1) million compared to positive cash flow of $2.5 million in the second half of 2023. Cash flow from operating activities for the first half of 2024 was negative $(7.7) million compared to positive cash flow of $4.2 million in the first half of 2023.
Mr. Igal Zamir, TAT’s CEO and President commented: “We are very proud to report another record quarter marked by revenue growth, margin expansion, and profitability improvement. Our results demonstrate increasing demand for our products and services, which are aligned with our growth strategy. This was the seventh consecutive quarter of growth in revenue and EBITDA, and given our growing momentum and backlog, we expect this trend to continue.”
“During the second quarter, we secured orders of more than $40 million, resulting in a record backlog and LTA Value of over $414 million,” continued Mr. Zamir. “These new orders give us significant visibility into revenue potential over the coming quarters and bolster our confidence in continued success. On top of the continued revenue growth, we invest efforts in improving our operational efficiency and cost structure. This resulted in an improved Gross margin and EBITDA margin.”
“During the first six months of 2024 we started serving APU of the newly certified 131 and 331-500 which serves a fleet of close to 20,000 aircraft (with a total addressable annual market of about $2 billion),” added Mr. Zamir. “The revenue obtained during the first half of 2024 is mainly driven from TAT’s historical products and services. The revenue from these new engines’ capabilities is insignificant. We are very excited about our future revenue growth and profits, as we start leveraging the potential of this new market. We will continue to expand our customer base for those engines MRO services according to our growth strategy”
Shareholder Webcast
Igal Zamir and Ehud Ben-Yeir, TAT’s CEO and CFO, have posted a webcast reviewing the financial results and to provide a business update. Investors interested in accessing the webcast can visit the investor relations section of the Company’s website at https://tat-technologies.com/investors/. The webcast will remain accessible on the website for at least 90 days.
Non-GAAP Financial Measures
To supplement the consolidated financial statements presented in accordance with GAAP, the Company also presents Adjusted EBITDA. The adjustments to the Company’s GAAP results are made with the intent of providing both management and investors a more complete understanding of the Company’s underlying operational results, trends and performance. Adjusted EBITDA is calculated as net income excluding the impact of: the Company’s share in results of affiliated companies, share-based compensation, taxes on income, financial (expenses) income, net, and depreciation and amortization. Adjusted EBITDA, however, should not be considered as alternative to net income and operating income for the period and may not be indicative of the historic operating results of the Company; nor it is meant to be predictive of potential future results. Adjusted EBITDA is not measure of financial performance under generally accepted accounting principles and may not be comparable to other similarly titled measures for other companies. See reconciliation of Adjusted EBITDA below.
About TAT Technologies LTD
TAT Technologies Ltd. is a leading provider of services and products to the commercial and military aerospace and ground defense industries. TAT operates under four segments: (i) Original equipment manufacturing (“OEM”) of heat transfer solutions and aviation accessories through its Gedera facility; (ii) MRO services for heat transfer components and OEM of heat transfer solutions through its Limco subsidiary; (iii) MRO services for aviation components through its Piedmont subsidiary; and (iv) Overhaul and coating of jet engine components through its Turbochrome subsidiary. TAT controlling shareholders is the FIMI Private Equity Fund.
TAT’s activities in the area of OEM of heat transfer solutions and aviation accessories primarily include the design, development and manufacture of (i) broad range of heat transfer solutions, such as pre-coolers heat exchangers and oil/fuel hydraulic heat exchangers, used in mechanical and electronic systems on board commercial, military and business aircraft; (ii) environmental control and power electronics cooling systems installed on board aircraft in and ground applications; and (iii) a variety of other mechanical aircraft accessories and systems such as pumps, valves, and turbine power units.
TAT’s activities in the area of MRO Services for heat transfer components and OEM of heat transfer solutions primarily include the MRO of heat transfer components and to a lesser extent, the manufacturing of certain heat transfer solutions. TAT’s Limco subsidiary operates an FAA-certified repair station, which provides heat transfer MRO services for airlines, air cargo carriers, maintenance service centers and the military.
TAT’s activities in the area of MRO services for aviation components include the MRO of APUs, landing gears and other aircraft components. TAT’s Piedmont subsidiary operates an FAA-certified repair station, which provides aircraft component MRO services for airlines, air cargo carriers, maintenance service centers and the military.
TAT’s activities in the area of overhaul and coating of jet engine components includes the overhaul and coating of jet engine components, including turbine vanes and blades, fan blades, variable inlet guide vanes and afterburner flaps.
For more information of TAT Technologies Ltd., please visit our web-site:
www.tat-technologies.com
Contact:
Mr. Eran Yunger
Director of IR
erany@tat-technologies.com
Safe Harbor for Forward-Looking Statements
This press release contains forward-looking statements which include, without limitation, statements regarding possible or assumed future operation results. These statements are hereby identified as “forward-looking statements” for purposes of the safe harbor provided by the Private Securities Litigation Reform Act of 1995. These forward-looking statements involve risks and uncertainties that could cause our results to differ materially from management’s current expectations. Actual results and performance can also be influenced by other risks that we face in running our operations including, but are not limited to, general business conditions in the airline industry, changes in demand for our services and products, the timing and amount or cancellation of orders, [LTAs] and backlog, the price and continuity of supply of component parts used in our operations, and other risks detailed from time to time in the Company’s filings with the Securities Exchange Commission, including, its annual report on form 20-F and its periodic reports on form 6-K. These documents contain and identify other important factors that could cause actual results to differ materially from those contained in our projections or forward-looking statements. Shareholders and other readers are cautioned not to place undue reliance on these forward-looking statements, which speak only as of the date on which they are made. We undertake no obligation to update publicly or revise any forward-looking statement.
TAT TECHNOLOGIES AND ITS SUBSIDIARIES
CONDENSED CONSOLIDATED BALANCE SHEET
(In thousands)
Jun 30,
December 31,
2024
2023
(unaudited)
(audited)
ASSETS
CURRENT ASSETS:
Cash and cash equivalents
$ 8,058
$ 15,979
Accounts receivable, net of allowance for credit losses of $305
and $345 thousand as of Jun 30, 2024 and December 31, 2023
respectively
26,197
20,009
Restricted deposit
–
661
Other current assets and prepaid expenses
6,722
6,397
Inventory
56,763
51,280
Total current assets
97,740
94,326
NON-CURRENT ASSETS:
Restricted deposit
294
302
Investment in affiliates
2,763
2,168
Funds in respect of employee rights upon retirement
644
664
Deferred income taxes
1,097
994
Property, plant and equipment, net
40,934
42,554
Operating lease right of use assets
2,656
2,746
Intangible assets, net
1,687
1,823
Total non-current assets
50,075
51,251
Total assets
$ 147,815
$ 145,577
LIABILITIES AND EQUITY
CURRENT LIABILITIES:
Current maturities of long-term loans
$ 1,937
$ 2,200
Short term loans
12,547
12,138
Accounts payable
9,079
9,988
Accrued expenses
12,907
13,952
Operating lease liabilities
1,155
1,033
Total current liabilities
37,625
39,311
NON CURRENT LIABILITIES:
Long-term loans
11,970
12,886
Liability in respect of employee rights upon retirement
998
1,000
Operating lease liabilities
1,486
1,697
Total non-current liabilities
14,454
15,583
Total liabilities
$ 52,079
$ 54,894
EQUITY:
Share capital
3,152
3,140
Translation reserves
164
–
Additional paid-in capital
76,512
76,335
Treasury shares at cost
(2,088)
(2,088)
Accumulated other comprehensive income
27
Retained earnings
17,996
13,269
Total shareholders’ equity
95,736
90,683
Total liabilities and shareholders’ equity
147,815
$ 145,577
TAT TECHNOLOGIES AND ITS SUBSIDIARIES
CONDENSED CONSOLIDATED STATEMENTS OF INCOME
(In thousands, except share and per share data)
Three months ended
Six months ended
Year ended
June 30,
December 31,
2024
2023
2024
2023
2023
(Unaudited)
(Unaudited)
(Unaudited)
(Unaudited)
(Audited)
Revenues:
Products
$ 11,732
$ 8,167
$ 23,667
$ 15,458
$ 35,241
Services
24,793
18,637
46,946
36,564
78,553
36,525
26,804
70,613
52,022
113,794
Cost of goods:
Products
7,673
5,548
16,659
11,822
30,517
Services
20,868
15,830
38,904
30,515
60,809
28,541
21,378
55,563
42,337
91,326
Gross Profit
7,984
5,426
15,050
9,685
22,468
Operating expenses:
Research and development, net
343
157
620
256
715
Selling and marketing
1,993
1,298
3,653
2,457
5,523
General and administrative
2,916
2,474
6,225
4,933
10,588
Other income
(2)
(35)
(390)
(441)
(433)
5,250
3,894
10,108
7,205
16,393
Operating income (Loss)
2,734
1,532
4,942
2,480
6,075
Interest expenses
(413)
(440)
(763)
(806)
(1,683)
Other financial income (expenses), Net
106
167
7
148
353
Income before taxes on income (tax benefit)
2,427
1,259
4,186
1,822
4,745
Taxes on income (tax benefit)
44
(63)
(109)
(90)
576
Income before share of equity investment
2,383
1,322
4,295
1,912
4,169
Profit of equity investment of affiliated
companies
234
153
432
221
503
Net Income
$ 2,617
$ 1,475
$ 4,727
$ 2,133
$ 4,672
TAT TECHNOLOGIES AND ITS SUBSIDIARIES
CONSOLIDATED STATEMENTS OF COMPREHENSIVE INCOME
(In thousands)
Basic and diluted income per share
Net income per share
$ 0.26
$ 0.16
$ 0.46
$ 0.24
$ 0.52
Net income per diluted shares
$ 0.25
$ 0.15
$ 0.44
$ 0.23
$ 0.51
Weighted average number of shares
outstanding
Basic
10,394,654
8,942,423
10,386,859
8,942,423
8,961,689
Diluted
10,561,420
9,052,163
10,722,153
9,052,163
9,084,022
Three months ended
Six months ended
Year ended
June 30,
December 31,
2024
2023
2024
2023
2023
(Unaudited)
(Unaudited)
(Unaudited)
(Unaudited)
(Audited)
Net income
$ 2,617
$ 1,475
$ 4,727
$ 2,133
$ 4,672
Other comprehensive income , net
Change in foreign currency translation
adjustments
164
–
164
–
–
Net unrealized income from derivatives
–
26
(27)
26
53
Total comprehensive income
2,781
$ 1,501
$ 4,864
$ 2,159
$ 4,725
TAT TECHNOLOGIES AND ITS SUBSIDIARIES
CONDENSED CONSOLIDATED STATEMENTS OF CHANGES IN EQUITY
(In thousands, except share data)
Share capital
Accumulated
Number of
shares issued
Amount
Additional
paid-in
capital
Translation
reserves
other
comprehensive
income (loss)
Treasury
shares
Retained
earnings
Total equity
BALANCE AT DECEMBER 31, 2022
9,186,019
$ 2,842
$ 66,245
–
$ (26)
$ (2,088)
$ 8,597
$ 75,570
CHANGES DURING THE YEAR ENDED
DECEMBER 31, 2023:
Comprehensive loss
–
–
–
53
–
4,672
4,725
Exercise of option
32,466
8
157
–
–
–
165
Issuance of common shares net of issuance costs of $141
thousands
1,158,600
290
9,774
–
–
–
10,064
Share based compensation
–
–
159
–
–
–
159
BALANCE AT DECEMBER 31, 2023
10,377,085
$ 3,140
$ 76,335
–
$ 27
$ (2,088)
$ 13,269
$ 90,683
CHANGES DURING THE PERIOD ENDED JUN
31, 2024 (unaudited):
Comprehensive profit
164
(27)
–
4,727
4,864
Exercise of option
49,109
12
(12)
–
–
Change in foreign currency translation adjustments
–
Share based compensation
189
189
BALANCE AT JUN 30, 2024 (unaudited)
10,426,194
3,152
76,512
164
–
(2,088)
17,996
95,736
TAT TECHNOLOGIES AND ITS SUBSIDIARIES
CONDENSED CONSOLIDATED STATEMENTS OF CASH FLOWS
(In thousands)
Three months ended
Six months ended
Year ended
June 30,
December 31,
2024
2023
2024
2023
2023
(Unaudited)
(Unaudited)
(Unaudited)
(Unaudited)
(Audited)
CASH FLOWS FROM OPERATING ACTIVITIES:
Net income
$ 2,617
$ 1,475
$ 4,727
$ 2,133
$ 4,672
Adjustments to reconcile net income (loss) to net cash
provided by (used by) operating activities:
Depreciation and amortization
1,431
901
2,805
1,942
4,710
Loss (gain) from change in fair value of derivatives
–
–
22
–
(9)
Change in funds in respect of employee rights upon
retirement
15
(27)
20
(97)
116
Change in operating right of use asset and operating leasing
liability
(3)
–
1
(6)
22
Non-cash financial expenses
(274)
(134)
(488)
(248)
(172)
Decrease in restructuring plan provision
(43)
(32)
(63)
(90)
(126)
Change in allowance for credit losses
40
(2)
40
(5)
(182)
Share in results of affiliated companies
(233)
(153)
(431)
(221)
(503)
Share based compensation
148
30
189
120
159
Liability in respect of employee rights upon retirement
(5)
(47)
(2)
(127)
(148)
Capital gain from sale of property, plant and equipment
(1)
(29)
(355)
(485)
(530)
Deferred income taxes, net
306
(98)
(103)
(76)
235
Changes in operating assets and liabilities:
Decrease (increase) in trade accounts receivable
(5,430)
3,137
(6,250)
1,123
(4,205)
Decrease (increase) in other current assets and prepaid
expenses
(144)
359
(325)
1,634
(341)
Increase in inventory
(2,906)
(3,248)
(5,543)
(285)
(5,400)
Decrease in trade accounts payable
(209)
(1,034)
(909)
(2,155)
(245)
Increase (decrease) in accrued expenses and other
591
1,352
(982)
1,062
4,202
Net cash provided by (used in) operating activities from
continued operation
$ (4,100)
$ 2,450
(7,647)
$ 4,219
$ 2,255
CASH FLOWS FROM INVESTING ACTIVITIES:
Proceeds from sale of property and equipment
–
375
1,306
1,935
2,002
Purchase of property and equipment
(978)
(1,021)
(1,967)
(2,454)
(5,102)
Purchase of intangible assets
–
–
–
–
(479)
Cash flows used in investing activities
$(978)
$ (646)
$ (661)
$(519)
$(3,579)
CASH FLOWS FROM FINANCING ACTIVITIES:
Repayments of long-term loans
(510)
(425)
(950)
(847)
(1,701)
Short-term credit received from banks
4,668
668
1,000
Proceeds from long-term loans received
–
–
712
Issuance of common shares
12
–
12
–
–
Proceeds from issuance of common shares, net
–
–
–
–
10,064
Exercise of options
(13)
165
(12)
165
165
Cash flows provided by (used in) financing activities
$ 4,157
$ (260)
$ (282)
$(682)
$10,240
Net increase (decrease) in cash and cash equivalents and
restricted cash
(921)
1,546
(8,590)
3,018
8,916
Cash and cash equivalents and restricted cash at
beginning of period
9,273
9,498
16,942
8,026
8,026
Cash and cash equivalents and restricted cash at the end
of period
8,352
11,044
8,352
11,044
16,942
SUPPLEMENTARY INFORMATION ON INVESTING
ACTIVITIES NOT INVOLVING CASH FLOW:
Additions of operating lease right-of-use assets and
operating lease liabilities
245
–
590
–
1,345
Reclassification of inventory to property, plant and
equipment
–
–
60
–
68
Supplemental disclosure of cash flow information:
Interest paid
(410)
(267)
(852)
(512)
(1,438)
TAT TECHNOLOGIES AND ITS SUBSIDIARIES
RECONCILIATION OF NET INCOME TO ADJUSTED EBITDA (NON-GAAP)
(UNAUDITED)
(In thousands)
Three months ended
Six months ended
Year ended
June 30,
June 30,
December 31,
2024
2023
2024
2023
2023
Net income (Loss)
$ 2,617
$ 1,475
$4,727
$ 2,133
$4,672
Adjustments:
Share in results and sale of equity
investment of affiliated companies
(234)
(153)
(432)
(221)
(503)
Taxes on income (tax benefit)
44
(63)
(109)
(90)
576
Financial expenses (income), net
306
272
755
658
1,330
Depreciation and amortization
1,468
1,006
2,898
2,140
4,902
Share based compensation
148
30
189
120
159
Adjusted EBITDA
$ 4,349
$ 2,567
$ 8,028
$ 4,740
$ 11,136
SIGNATURE
Pursuant to the requirements of the Securities Exchange Act of 1934, the registrant has duly caused this report to be signed on its behalf by the undersigned, thereunto duly authorized.
TAT TECHNOLOGIES LTD.
(Registrant)
By: /s/ Ehud Ben-Yair
Ehud Ben-Yair
Chief Financial Officer
Date: August 28, 2024
Photo – https://mma.prnewswire.com/media/2492171/EBITDA_Q224.jpg
Photo – https://mma.prnewswire.com/media/2492172/revenue_Q224.jpg
View original content to download multimedia:https://www.prnewswire.com/news-releases/tat-technologies-grows-revenue-by-36-increases-net-income-by-78-and-increased-adjusted-ebitda-by-69-for-the-second-quarter-of-2024-302233529.html
SOURCE TAT Technologies Ltd.


 Coin Market3 days ago
 Technology3 days ago
 Coin Market3 days ago
 Near Videos4 days ago
 Technology3 days ago
 Near Videos3 days ago
 Coin Market3 days ago
 Coin Market3 days ago