Booth #2829 invites attendees to step inside the worlds of two iconic franchises through the groundbreaking LEGO SMART Play experienceAttendees will be able to experience two beloved franchises like never before, as LEGO SMART Play adds a new dimension of interactive playOther exciting ways to experience the LEGO brand on-site July 23-26 include multiple new product reveals making global debuts, in-booth programming and a scavenger hunt for brand prizes
SAN DIEGO, July 23, 2026 /PRNewswire/ — The LEGO Group is unveiling the LEGO® SMART Play™ Gateway at San Diego Comic-Con 2026 — a booth experience powered by LEGO SMART Play technology that puts attendees right at the center of their fandoms and brings LEGO sets to life with a newfound layer of interactivity. At the LEGO SMART Play Gateway, fans will step inside the heart of two of pop culture’s most beloved franchises.
The LEGO Group will also further debut several new LEGO sets spanning numerous fandoms at San Diego Comic-Con 2026 — continuing to offer a LEGO set for every age and interest!
Enter a New Dimension of Play at the LEGO SMART Play Gateway
Launched this year, LEGO SMART Play provides open-ended physical play through responsive technology that reacts in real time. The LEGO SMART Play platform is powered by the SMART Brick, a 2×4 LEGO brick compatible with the LEGO System in Play that holds more than 20 patented world-first technologies. The SMART Brick can read SMART Tags and SMART Minifigures, synthesize light and sounds and sense precise motion, allowing kids to build, interact and create their own stories as their creations play back.
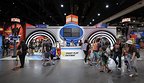
Attendees at San Diego Comic-Con 2026 are invited to step through the doors of the LEGO SMART Play Gateway, a retro-futuristic interworld departure terminal. Blending mid-century modern design with the technological optimism of LEGO SMART Play, the space transports fans from the show floor through SMART Play™-powered portals and into one of two fully immersive destinations:
Destination: LEGO Pokémon™ Lab
Destination: LEGO Pokémon™ Lab invites fans into the starting point of every Pokémon Trainer’s journey, a Lab recreated with scaled-up LEGO bricks and populated by life-sized LEGO Pokémon™ builds powered by LEGO SMART Play.Guests can choose their first partner Pokémon by selecting a Poké Ball to reveal Bulbasaur, Charmander or Squirtle and interact with their chosen Pokémon via SMART Brick lights and sounds. Portal visitors can further try out a game of “Hide and Pikachu” inspired by the LEGO Pokémon™ SMART Play: Training House with Pikachu set or interact with Eevee as its ears sway and the gems around its glow.Don’t depart without exploring the display case highlighting a full range of LEGO Pokémon™ sets available this year.
Destination: Mos Eisley
Destination: Mos Eisley transports Star Wars™ fans straight to Mos Eisley Cantina, recreated as a series of oversized LEGO brick environments pulled directly from the world of LEGO Star Wars™ SMART Play (specifically, the LEGO Star Wars™ SMART Play: Mos Eisley Cantina™ set!).Interactive touchpoints are woven throughout, doubling as iconic photo opportunities: grab the mic and swing it to trigger a SMART Brick remix of the iconic Cantina Song as the Modal Nodes band plays along; slide into the infamous corner booth for a face-to-face encounter with Greedo; and visit the Dewback Petting Zoo for a photo op with a purring, snoozing Dewback.Eagle-eyed fans can also decode hidden Aurebesh signage to unlock in-universe Easter eggs scattered throughout the space.
“The excitement around LEGO SMART Play began earlier this year and continues to grow with the launch of new sets on August 1. We are thrilled to bring these themes to life at the LEGO SMART Play Gateway during San Diego Comic-Con,” said Beth McKenna, Head of U.S. Marketing at the LEGO Group. “LEGO SMART Play represents the most significant advancement in LEGO® play since the Minifigure. Comic-Con is the ideal venue to showcase the possibilities of LEGO SMART Play, where attendees unite over the stories, characters, and worlds they adore.”
Sets Debuting at San Diego Comic-Con 2026
Brand new sets from across the LEGO brand’s most beloved franchises, not specific to SMART Play, are on display flanking the rear of the gateway; as each display case operates as its own destination, inviting fans and enthusiasts to explore and build upon the worlds they love most.
Boldly Build Where No One Has Built Before with the NEW LEGO Icons Star Trek: U.S.S. Enterprise NCC-1701™ Bridge
The LEGO Icons Star Trek: U.S.S. Enterprise NCC-1701™ Bridge (11385), the ultimate tribute to one of the most iconic ships in sci-fi history, is a perfect way to celebrate Star Trek’s 60th anniversary in 2026 – and it reveals at San Diego Comic-Con!
This 1,701-piece set, available at LEGO Stores and LEGO.com exclusively beginning September 1 and available for pre-order now, recreates the iconic bridge and transporter room from the original series in authentic detail with eight LEGO Minifigures representing the Starfleet crew. Turn a dial to beam crew from the transporter room, swish open the turbo lift doors and rock the captain’s chair to simulate warp turbulence and space battles; this is a mission-worthy build for any Trekkie.
Outside of the booth, the U.S.S. Enterprise NCC-1701™ Bridge set will make its first appearance at the Star Trek: The Collector Frontier Panel, accompanied by LEGO set designers Henrik Andersen and Crystal Marie Fontan to explain the process and inspiration that went into recreating the U.S.S. Enterprise. The panel takes place Thursday, July 23, 11:00am to 12:00pm in Room 5AB. For those on the hunt for further LEGO Star Trek sights, be sure to visit the “Star Trek: Boldly Built” activation at the Marriot Marquis on W. Harbor Drive July 23-26, where attendees can take a photo in a LEGO brick-built Captain’s Chair – made out of 83,568 LEGO bricks!
Relive the Classic with the NEW LEGO Donkey Kong™ Arcade
Jump back into a classic age of gaming with the LEGO Donkey Kong Arcade (72051), on display for the first time at San Diego Comic-Con and available in stores August 1. This 1,367-piece collectible set pays homage to the iconic arcade cabinet, complete with Jumpman, Donkey Kong and Lady, plus scaffold, ladder and hammer details straight from the original Nintendo® game.
Pull the lever to release one of the 21 barrels at a time, move Jumpman with the joystick and press the button to make him jump over the barrels — there is even a mechanism to circulate the barrels in a continuous loop to keep the fun rolling! A must-have for adult fans of classic arcade games and retro decor.
Bringing the Swamp to San Diego with NEW LEGO Minifigures Shrek Series
The LEGO Minifigures Shrek Series (71053) brings 12 beloved characters from the franchise to Minifigure form at San Diego Comic-Con, each tucked inside a sealed mystery box for ages six and up. Discover Shrek, Fiona, Donkey, Puss in Boots, Lord Farquaad and more, most with at least one themed accessory like blind mice, a magic mirror or lollipop. Collect them all, play out scenes from the films or put them on display. These are available September 1, but the fairytale will continue in 2027 with more LEGO Shrek!
This summer marks the 25th anniversary of the first Shrek film, which launched a global blockbuster franchise. A new chapter begins next summer, when DreamWorks Animation’s Shrek 5 arrives in cinemas worldwide.
Within and Beyond the Booth
Attendees can explore the LEGO SMART Play™ Gateway from Thursday, July 23 to Sunday, July 26 at booth #2829, where the power of LEGO SMART Play comes to life across every corner of the experience.
Beyond the SMART Play Gateway, fans can attend LEGO-brand panels celebrating major milestones, hunt for exclusive LEGO finds in a scavenger hunt spanning the entire convention floor and take home collectible souvenirs to remember the experience:
LEGO NINJAGO® Celebrates – 15 Years and Counting! NINJAGO voice talent will take the stage to celebrate 15 years of everyone’s favorite minifig ninja team – LEGO NINJAGO! They will talk about their best-loved moments from hundreds of episodes and perform a staged reading of an all-new, exclusive canon scene written by fellow panelists, LEGO NINJAGO: Dragons Rising head writers Kevin Burke & Chris “Doc” Wyatt. Thursday, July 23, 2:15pm-3:15pm in Room 6BCF. In-booth signings July 23, 4:00pm-5:00pm and Friday, July 24 2:30pm-3:30pm. NINJAGO fans will be further pleased to know that the LEGO brand debuted the third installation of its partnership with Crocs™, the NINJAGO collection, at San Diego Comic-Con this morning, The release features Classic Clogs for adults and kids inspired by one of the franchise’s most beloved heroes, Lloyd; fans can further personalize their look with character-inspired Jibbitz™ charm packs.Lost Luggage Scavenger Hunt. Keep your eyes open — LEGO luggage tags are being hidden within the San Diego Convention Center daily, July 23-26. Find one and return it to the LEGO booth to claim a prize package, including exclusive brand artwork commissioned for San Diego Comic-Con 2026.Travel souvenirs to take home from your journey. Visitors can collect limited-edition boarding passes, exclusive LEGO Travel Guides, destination postcards and IP-themed travel stickers in-booth — all designed to commemorate the trip long after the show floor closes.
More Information
All products on display at the show, including LEGO set reveals, can be found at LEGO.com/san-diego-comic-con. For more information on the LEGO Group activities at San Diego Comic-Con, contact press@america.lego.com.
Notes to Editor
Product Information
LEGO® Icons Star Trek: U.S.S. Enterprise NCC-1701™ Bridge (11385)
Age Grade: 18+MSRP: $199.99Piece Count: 1,701Global Launch Date: September 1, 2027 (available for pre-order now) at LEGO Stores and LEGO.comDescription: Set course for a voyage of creativity with the LEGO® Icons Star Trek: U.S.S. Enterprise NCC-1701™ Bridge building set for adults. Recreate the iconic bridge and transporter room that served as the backdrop for epic scenes aboard the legendary starship. Rock the captain’s chair to simulate ship turbulence and turn a dial to beam crew members. Includes eight iconic Star Trek character Minifigures.
LEGO® Donkey Kong™ Arcade (72051)
Age Grade: 18+MSRP: $199.99Piece Count: 1367Global Launch Date: August 1, 2026 at LEGO Stores and select retailersDescription: Join Jumpman on the construction site again with this LEGO® brick model of the iconic Donkey Kong™ arcade game. Pull the lever for Donkey Kong to ‘throw’ barrels one after the other. Move Jumpman with the joystick and press the button to make him leap over the barrels. This set pays homage to the original Donkey Kong arcade cabinet game and makes a fun, nostalgic addition to your game room.
LEGO® Minifigures Shrek Series (71053)
Age Grade: 6+MSRP: $4.99Piece Count: 7Global Launch Date: September 1, 2026 at LEGO Stores and select retailersDescription: Enjoy movie adventures with LEGO® Minifigures Shrek Series mystery boxes. There are 12 detailed characters to collect, including Shrek, Fiona and Donkey, Puss in Boots, Prince Charming, Big Bad Wolf and Lord Farquaad and most come with at least one accessory. Expand your Minifigure collection or use them to play out your favorite scenes from the DreamWorks Animation’s Shrek films. Open your box and find out who’s inside!
About the LEGO Group
The LEGO Group’s mission is to inspire and develop the builders of tomorrow through the power of play. The LEGO System in Play, with its foundation in LEGO bricks, allows children and fans to build and rebuild anything they can imagine.
The LEGO Group was founded in Billund, Denmark in 1932 by Ole Kirk Kristiansen, its name derived from the two Danish words Leg Godt, which mean “Play Well”.
Today, the LEGO Group remains a family-owned company headquartered in Billund. Its products are now sold in more than 130 countries worldwide. For more information: www.LEGO.com.
About The Pokémon Company International
The Pokémon Company International manages the Pokémon property outside of Asia and is responsible for brand management, licensing, marketing, the Pokémon Trading Card Game, the animated TV series, home entertainment and the official Pokémon website. Pokémon was launched in Japan in 1996 and today is one of the most popular children’s entertainment properties in the world. For more information, please visit www.pokemon.co.uk.
STAR WARS and related properties are trademarks and/or copyrights, in the United States and other countries, of Lucasfilm Ltd. and/or its affiliates. © & TM Lucasfilm Ltd.
About Paramount Products & Experiences
Paramount Products & Experiences oversees all licensing, merchandising, and location-based experiences for Paramount, a Skydance Corporation (Nasdaq: PSKY), a leading next generation global media and entertainment company. The division brings to life iconic franchises and beloved characters through innovative products and immersive experiences across categories including toys, apparel, publishing, food and beverage, theme parks, hotels, cruises, attractions, and live entertainment. Its global portfolio is powered by content from brands such as Nickelodeon, Paramount Pictures, CBS, MTV, Comedy Central, and Paramount+, and fan-favorite franchises like PAW Patrol, SpongeBob SquarePants, Teenage Mutant Ninja Turtles, Star Trek, and Yellowstone. To explore our range of consumer products and Paramount-branded merchandise, visit ParamountShop.com.
TM & © 2026 CBS Studios Inc. Star Trek and related marks and logos are trademarks of CBS Studios Inc. All Rights Reserved.
About DreamWorks Animation’s Shrek Franchise
For the past two decades, children of all ages have been enchanted by DreamWorks Animation’s delightful, irreverent adventures of a misunderstood ogre and his ragtag group of roguish fairytale folk. Beginning with Shrek, the 2001 Academy Award® winner for Best Animated Feature, Shrek (Mike Myers), Fiona (Cameron Diaz), Donkey (Oscar® nominee Eddie Murphy), Puss in Boots (Oscar® nominee Antonio Banderas) and their signature friends, family and tormentors have grown into an indelible part of pop culture, reminding audiences around the globe that beauty is in the eye of the beholder.
The four Shrek franchise films have earned more than $2.9 billion worldwide, spawning a global live-touring show, an award-winning Broadway musical that earned eight Tony nominations and 12 Drama Desk nominations, plus an immersive, top-tourist destination in London and popular events and attractions across Universal Studios theme parks worldwide.
From an astonishing consumer products campaign to imaginative digital extensions and a global animation exhibition tour, the iconic age of Shrek now enters a thrilling new era in 2027, as DreamWorks Animation reimagines this wonderous tale for a new generation with Shrek 5. Stars Mike Myers, Cameron Diaz and Eddie Murphy return, now joined by Emmy winning superstar Zendaya (Dune franchise, Euphoria) as Shrek and Fiona’s daughter.
View original content to download multimedia:https://www.prnewswire.com/news-releases/the-lego-group-introduces-the-lego-smart-play-gateway-at-san-diego-comic-con-2026-302833040.html
SOURCE The LEGO Group


 Technology4 days ago
 Coin Market4 days ago
 Technology5 days ago
 Technology5 days ago
 Coin Market3 days ago
 Technology4 days ago
 Technology3 days ago