REDDING, Calif., Sept. 16, 2024 /PRNewswire/ — According to a new market research report titled, ‘Lab Automation Market Size, Share, Forecast, & Trends Analysis by Product (Liquid Handling, Nucleic Acid Purification System, Microplate Reader, ELISA, LIMS, ELN), Application (Drug Discovery, Diagnostics, Genomics),End User—Global Forecast to 2031.
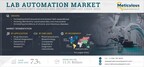
The lab automation market is projected to reach $11.31 billion by 2031, at a CAGR of 7.3% from 2024 to 2031.
Download FREE PDF Brochure Of Lab Automation Market – https://www.meticulousresearch.com/pressrelease/967/lab-automation-market-2031
Rising pharmaceutical and biotech R&D expenditures, the increasing demand for automated laboratories and instruments, the high prevalence of chronic and infectious diseases, and initiatives supporting life sciences R&D are driving the growth of the lab automation market. However, the high costs of advanced lab automation equipment and funding & infrastructure limitations in developing countries are factors restraining the growth of this market.
Furthermore, growth in genomics & proteomics research, the increasing focus on food safety & quality, rising awareness & growing adoption of personalized medicines, and emerging economies are expected to generate growth opportunities for the players operating in the lab automation market. However, equipment maintenance & repair and data security & privacy concerns are major challenges impacting market growth.
Get Insightful Data On Regions, Market Segments, Customer Landscape, And Top Companies (Charts, Tables, Figures And More) – https://www.meticulousresearch.com/download-sample-report/cp_id=1221
Automated Laboratories: Effective Management of Clinical Workflows
Lab automation is being widely adopted in clinical laboratories to increase accuracy and efficiency and reduce costs and errors. In the field of medicine, a diagnostic error can incur very high costs. Hence, automating clinical laboratories can significantly reduce human errors and associated costs.
Automating clinical laboratories can have a positive impact on patient outcomes. Quick and reliable diagnostic results allow medical professionals to initiate appropriate treatments, improving the chances of patient survival. Additionally, limited resources, long waiting times for diagnostic results, and the shortage of skilled laboratory staff can lead to poor patient outcomes. The implementation of lab automation in clinical laboratories helps mitigate these issues and provides quick and reliable results, improving patient outcomes.
In the U.S., an estimated 10–20% of diagnoses are inaccurate and result in 40,000–80,000 deaths each year. Automation improves the ordering, testing, and reporting of diagnostic tests and ensures higher throughput, increased productivity, efficient use of reagents & materials, and standardization, decreasing errors and improving turnaround times.
Browse In-depth Report Now – https://www.meticulousresearch.com/product/lab-automation-market-1221
The players operating in this market are focused on launching new automated diagnostic instruments. For instance:
In May 2024, Abbott Laboratories (U.S.) launched its GLP Systems Track in India to support the high-volume needs of laboratories.In September 2023, Yourgene Health plc (U.K.) launched the Yourgene MagBench Automated DNA Extraction Instrument and Kit for Noninvasive Prenatal Testing (NIPT) workflows.In June 2023, Becton, Dickinson and Company (U.S.) launched its BD FACSDuet Premium Sample Preparation System for cellular diagnostic applications.In January 2023, QIAGEN N.V. (Netherlands) launched the EZ2 Connect MDx Platform for automated sample processing in diagnostic labs.In May 2022, Becton, Dickinson and Company (U.S.) launched BD COR MX, a fully automated, high-throughput infectious disease molecular diagnostics platform.
Lab Automation Market Analysis: Key Segmental Findings
By Product: In 2024, the systems segment is expected to account for the major share of 71.5% of the lab automation market. However, the software segment is expected to grow at the fastest CAGR of 7.4% during the forecast period of 2024–2031.By Application: In 2024, the drug discovery segment is expected to account for the largest share of the market. However, the clinical diagnostics segment is expected to grow at the fastest CAGR during the forecast period of 2024–2031.By End User: In 2024, the pharmaceutical & biotechnology companies’ segment is expected to account for the largest share of 41.0% of the global market.
Explore the Key Market Segments Driving Growth (Download Free Sample) – https://www.meticulousresearch.com/download-sample-report/cp_id=1221
Geographic Analysis:
North America Dominates the Global Market
North America is expected to account for the largest share of 40.8% of the lab automation market. In terms of value, in 2024, the U.S. is expected to account for the major share of 92% of the lab automation market in North America. Pharmaceutical companies in the U.S. are at the forefront of adopting cutting-edge technologies, with a strong emphasis on the implementation of lab automation systems to enhance operational efficiency and gain a competitive edge in the pharmaceutical sector. The adoption of lab automation technologies is driven by several factors, including the surging need for high-throughput analysis, increasing investments in research and development, laboratories’ growing need for increased efficiency, precision, and productivity, and the increasing focus on genomics research and genetic testing. These dynamics are boosting the adoption of lab automation across the country. The U.S. has low market barriers for developing and commercializing pharmaceuticals due to the supportive domestic environment. With the availability of government funding for research activities, robust capital markets, and strong academic research in the country, the U.S. is the world’s largest scientific research base, attracting most global venture capital investments in the biotechnology industry.
Asia-Pacific to Witness Rapid Growth
Asia-Pacific is expected to record the fastest growth over the forecast period, with the regional market reaching $2.74 billion by 2031. The high growth of this regional market is driven by the expanding pharmaceutical & biotechnology industries, rapidly improving healthcare infrastructure, growth in pharmaceutical research, and increasing government funding in APAC. The Asia-Pacific region has become one of the most attractive markets for healthcare & life sciences companies worldwide, primarily due to changing demographics and accelerated economic growth in the region. Countries such as China, India, South Korea, and Indonesia are expanding their healthcare infrastructure, driving the demand for laboratory automation.
Have specific research needs? Request a customized research report – https://www.meticulousresearch.com/request-customization/cp_id=1221
In 2024, China is expected to account for the largest share of the lab automation market in Asia-Pacific. The country’s large market share is mainly attributed to government initiatives focusing on research and development, increasing R&D expenditures of pharmaceutical and biopharmaceutical companies, favorable regulatory policies, the rising prevalence of infectious & chronic diseases, the rising geriatric population, and the increased demand for lab automation among clinical laboratories due to increased disease prevalence.
Germany Continues to Dominate the Lab Automation Market in Europe
In 2024, Germany is expected to account for the largest share of the lab automation market in Europe. Factors such as increasing government investments in the pharmaceutical industry, growing biotech & pharmaceutical R&D expenditures, rising healthcare spending, increasing sample volumes in laboratories due to the rising incidence of chronic and infectious diseases, the increased demand for precision medicines, and the rising focus on genomics research contribute to the country’s largest market share. Germany has a favorable environment for developing and producing research-intensive, high-grade products. According to German Trade & Invest, in 2021, the pharmaceutical industry in Germany invested over $9.1 billion (€7.7 billion) in research and development. Additionally, the government and funding organizations have pledged to substantially increase public & private R&D spending and researchers by 2030 as part of the country’s Sustainable Development Goals (SDG). Thus, increasing government funding for research, the wide availability of technologically advanced laboratory informatics solutions, and laboratories’ need to reduce errors, and associated costs are expected to drive the growth of the lab automation market in Germany.
Need Insights on Regional Data? Check Out Our Detailed Analysis (Download Free Sample) – https://www.meticulousresearch.com/download-sample-report/cp_id=1221
Lab Automation Market: Competition Analysis
This report offers a competitive analysis based on an extensive assessment of the leading players’ product portfolios, geographic presence, and key growth strategies adopted over the past 3–4 years. Major companies in the lab automation market have implemented various strategies to expand their product offerings and global footprints and augment their market shares. The key strategies followed by most companies in the lab automation market include product launches, product enhancements, approvals, partnerships, collaborations, agreements, acquisitions, and expansions. The key players operating in the lab automation market include Thermo Fisher Scientific, Inc. (U.S.), Bio-Rad Laboratories, Inc. (U.S.), Danaher Corporation (U.S.), Revvity, Inc. (U.S.), Agilent Technologies, Inc. (U.S.), Waters Corporation (U.S.), Tecan Group Ltd. (Switzerland), F. Hoffmann-La Roche AG (Switzerland), Siemens Healthineers AG (Germany), Abbott Laboratories (U.S.), Becton, Dickinson and Company (U.S.), Hudson Robotics, Inc. (U.S.), and Hamilton Company (U.S.).
Learn About the Top Companies Influencing Market Dynamics (Download Free Sample) – https://www.meticulousresearch.com/download-sample-report/cp_id=1221
Lab Automation Industry Overview: Latest Developments from Key Industry Players
In July 2024, INPECO SA (Switzerland) launched FlexLab X, a next-generation total lab automation system (TLA), at the Annual Scientific Meeting of the Association for Diagnostics & Laboratory Medicine (ADLM 2024). This system can combine analyzers from different vendors, enable space-saving layouts, offers a sleek graphical user interface, and streamlines workflows.In February 2024, Carbon, Inc. (U.S.) launched its Automatic Operation (AO) suite of solutions designed to meet the needs of dental labs, setting new standards in lab automation.In September 2023, Bio-Rad Laboratories, Inc. launched the PTC Tempo 48/48 and PTC Tempo 384 thermal cyclers that are designed to aid PCR applications such as sequencing, cloning, and genotyping.In August 2023, F. Hoffmann-La Roche Ltd launched the Cobas Connection Modules (CCM) sample conveyor systems to enable flexibility in laboratory designs.In July 2023, Agilent Technologies, Inc. launched the BioTek Gen6 Software, which is used for all BioTek detection instruments. This software also provides an intuitive user interface that offers complete control of BioTek microplate readers for absorbance, fluorescence, and luminescence measurements for endpoint and kinetic assays.In July 2023, Thermo Fisher Scientific, Inc. launched the Diomni Enterprise Software, which provides a digital platform to support testing workflows in order to accommodate rapidly evolving needs.In July 2023, Bio-Rad Laboratories launched the IH-500TM NEXT System, a fully automated system for use with Bio-Rad’s ID Cards for routine testing and specialized testing such as newborn screening.In February 2023, Revvity, Inc. launched the EnVision Nexus Multimode Microplate Reader, which provides high-throughput screening and accelerates drug discovery results.In February 2023, Beckman Coulter Life Sciences collaborated with Sciex (U.S.) to provide comprehensive workflows for high-throughput screening HT-ADME and synthetic biology studies. The Echo MS System, which is based on Sciex’s Acoustic Ejection Mass Spectrometry technology, is now compatible with Beckman’s Echo Liquid Handlers.In February 2023, Tecan Group Ltd. collaborated with Element Biosciences, Inc. (U.S.) to offer a true benchtop NGS workflow with the MagicPrep NGS and AVITI System. This collaboration was aimed at enabling the direct conversion of NGS libraries without affecting sample quality.In June 2022, Beckman Coulter Life Sciences launched the Biomek NGeniuS liquid handling system to automate the labor-intensive process of manual library construction and reagent transfers. The system also eliminates loading errors.In April 2022, Revvity, Inc. collaborated with Scitara Corporation (U.S.) to integrate PerkinElmer’s Signals Research Suite informatics platform and Scitara’s iPaaS universal connectivity solution to facilitate fully connected laboratories along with standard data integrity, data mobility, system flexibility, and user reconfigurability.
The report provides a competitive dashboard summarizing the market positioning of the 20 profiled market players in four quadrants, namely Industry Leaders, Differentiators, Emerging Companies, and Vanguards. These companies are positioned based on various parameters, including revenue, depth of offerings, brand equity, geographic presence, innovation, and organic & inorganic growth strategies. Thermo Fisher Scientific, Inc. (U.S), Danaher Corporation (U.S.), F. Hoffmann-La Roche AG (Switzerland), Hamilton Company (U.S.), Abbott Laboratories (U.S.), and Siemens Healthineers AG (Germany) are positioned in the industry leaders quadrant.
IMMEDIATE DELIVERY AVAILABLE | BUY THIS RESEARCH REPORT (Insights, Charts, Tables, Figures and More)- https://www.meticulousresearch.com/Checkout/13937383
Scope of the Report:
Lab Automation Market Assessment–by Product
SystemsAutomated Liquid Handling SystemsAutomated Nucleic Acid Purification SystemsAutomated ELISA SystemsAutomated Microplate ReadersAutomated Storage & Retrieval SystemsOther Lab Automation SystemsSoftwareLaboratory Information Management Systems (LIMS)Electronic Lab Notebook (ELN)Workstation/Equipment Automation SoftwareScientific Data Management Systems (SDMS)
Lab Automation Market Assessment–by Application
Drug DiscoveryClinical DiagnosticsGenomics & Proteomics ResearchOther Applications
(Note: Other applications include bioprocessing in biotechnology, cell analysis, basic research, forensic analysis, and quality control in the F&B industry.)
Lab Automation Market Assessment–by End User
Pharmaceutical & Biotechnology CompaniesHospitals & Diagnostic LaboratoriesAcademic & Research InstitutesOther End Users
(Note: Other end users include the food & agriculture industries, forensic laboratories, blood banks, and environmental & quality testing laboratories.)
Lab Automation Market Assessment–by Geography
North AmericaU.S.CanadaEuropeGermanyU.K.FranceItalySpainRest of Europe (RoE)Asia-Pacific (APAC)ChinaJapanIndiaRest of APAC (RoAPAC)Latin AmericaMiddle East & Africa
Browse More Related Reports:
Lab Automation Market is projected to hit $11.31 billion by 2031, growing at CAGR of 7.3% from 2024. Discover trends and growth factors driving this sector. – https://www.meticulousresearch.com/product/lab-automation-market-1221
Clinical Lab Automation Market is expected to reach $4.01 billion by 2031, at a CAGR of 7.8% from 2024 to 2031. – https://www.meticulousresearch.com/product/clinical-lab-automation-market-5762
Electronic Lab Notebook Market is expected to grow at a CAGR of 7.1% to reach $787.7 million by 2029. – https://www.meticulousresearch.com/product/electronic-lab-notebook-eln-market-4341
NGS Automation Market is expected to grow at a CAGR of 13.4% from 2022–2029 to reach $1.33 billion by 2029. – https://www.meticulousresearch.com/product/ngs-automation-market-5271
Explore future of Industrial Automation Software Market, projected to hit $59.5 billion by 2029. – https://www.meticulousresearch.com/product/industrial-automation-software-market-5279
Pharmaceutical Automation Market, valued at $11.16 Bn in 2023, is projected to reach $25.11 Bn by 2031, growing at a 10.8% CAGR from $12.21 Bn in 2024. – https://www.meticulousresearch.com/product/pharmaceutical-automation-market-5280
Lab-grown Meat Market is projected to reach $1.99 billion by 2035, at a CAGR of 21.4% during forecast period of 2025–2035. – https://www.meticulousresearch.com/product/lab-grown-meat-market-5293
North America Electronic Lab Notebooks Market is projected to reach $372.7 million by 2030, at a CAGR of 6.8% from 2024 to 2030. – https://www.meticulousresearch.com/product/north-america-electronic-lab-notebook-market-5604
Europe Electronic Lab Notebook (ELN) Market is projected to reach $264.3 million by 2030, at a CAGR of 7% from 2024 to 2030. – https://www.meticulousresearch.com/product/europe-electronic-lab-notebook-market-5683
Pharmacy Automation Market is expected to reach $7.87 billion by 2030, at a CAGR of 7.6% during forecast period 2024–2030. – https://www.meticulousresearch.com/product/pharmacy-automation-market-5700
Life science equipment market is projected to reach $97.96 billion by 2031, at a CAGR of 6.3% from 2024 to 2031 – https://www.meticulousresearch.com/product/life-science-equipment-market-3937
Europe NGS automation Market to be worth $380.4 million by 2030, growing at a 13.4% CAGR from 2024 to 2030. – https://www.meticulousresearch.com/product/europe-ngs-automation-market-5644
North America NGS Automation Market is expected to reach $776.1 million by 2030, at a CAGR of 14% during forecast period 2024–2030 – https://www.meticulousresearch.com/product/north-america-ngs-automation-market-5736
Asia-Pacific NGS Automation Market is expected to reach $371 million by 2031 at a CAGR of 16.3% from 2024 to 2031 – https://www.meticulousresearch.com/product/asia-pacific-ngs-automation-market-5790
Lab Automation Market Research Summary
Particular
Details
Page No
244
Format
PDF
Forecast Period
2024-2031
Base Year
2023
CAGR
7.30 %
Market Size (Value)
$11.31 billion
Market Size (Volume)
NA
Countries Covered
North America (U.S., Canada), Europe (Germany, France, U.K., Italy, Spain, RoE), Asia-Pacific (China, Japan, India, RoAPAC), Latin America, and the Middle East & Africa.
Key Companies
Thermo Fisher Scientific, Inc. (U.S.), Bio-Rad Laboratories, Inc. (U.S.), Danaher Corporation (U.S.), Revvity, Inc. (U.S.), Agilent Technologies, Inc. (U.S.), Waters Corporation (U.S.), Tecan Group Ltd. (Switzerland), F. Hoffmann-La Roche AG (Switzerland), Siemens Healthineers AG (Germany), Abbott Laboratories (U.S.), Becton, Dickinson, and Company (U.S.), Hudson Robotics, Inc. (U.S.), Hamilton Company (U.S.)
Click here to: Get Free Sample Pages of this Report
Hot Industry Reports: Emerging Trends and Market Forecasts
Veterinary Practice Management Software Market by Size, Share, Forecasts, & Trends Analysis – https://www.meticulousresearch.com/product/veterinary-practice-management-software-market-1432
Asia Pacific Orthodontics Market by Size, Share, Forecasts, & Trends Analysis – https://www.meticulousresearch.com/product/asia-pacific-orthodontics-market-4978
Feed Software Market by Size, Share, Forecast, & Trends Analysis – https://www.meticulousresearch.com/product/feed-software-market-2639
Point-of-care Diagnostics Market Size & Trends Analysis 2030 – https://www.meticulousresearch.com/product/point-of-care-diagnostics-market-4871
Soluble Dietary Fibers Market by Size, Share, Forecasts, & Trends Analysis – https://www.meticulousresearch.com/product/soluble-dietary-fibers-market-3953
Genomics Market: Size, Trends & Global Forecast to 2031 – https://www.meticulousresearch.com/product/genomics-market-1262
Healthcare Gamification Market Size, Share, & Growth 2030 – https://www.meticulousresearch.com/product/healthcare-gamification-market-2592
3D Cell Culture Market Size & Growth Insights 2024-2030 – https://www.meticulousresearch.com/product/3d-cell-culture-market-1246
South East Asia Collagen Market by Size, Share, Forecasts, & Trends Analysis – https://www.meticulousresearch.com/product/south-east-asia-collagen-market-3634
Next Generation Sequencing Informatics (NGS) Market Size, Share, Forecast, & Trends Analysis – https://www.meticulousresearch.com/product/ngs-informatics-market-3483
Recombinant Coagulation Factors Market by Size, Share, Forecasts, & Trends Analysis – https://www.meticulousresearch.com/product/recombinant-coagulation-factors-market-1254
Crop Protection Chemicals Market Size, Share, Report, & Trends 2031 – https://www.meticulousresearch.com/product/crop-protection-chemicals-market-2584
Integrated Pest Management (IPM) Pheromones Market by Size, Share, Forecasts, & Trends Analysis – https://www.meticulousresearch.com/product/integrated-pest-management-pheromones-market-5211
Sports Medicine Market: Size, Share, Forecast & Trends – https://www.meticulousresearch.com/product/sports-medicine-market-1215
MRI Infrastructure Capacity Assessment by Size, Share, Forecasts, & Trends Analysis – https://www.meticulousresearch.com/product/mri-infrastructure-capacity-assessment-1217
Digital X-ray Systems Market Size, Share, Forecast, & Trends – https://www.meticulousresearch.com/product/digital-x-ray-systems-market-1183
Sports Technology Market Size, Trends & Forecast to 2030 – https://www.meticulousresearch.com/product/sports-technology-market-5584
Home Healthcare Market by Size, Share, Forecasts, & Trends Analysis – https://www.meticulousresearch.com/product/home-healthcare-market-1280
Next Generation Sequencing Market Size, Share & Trends 2023-2030 – https://www.meticulousresearch.com/product/next-generation-sequencing-market-5040
Cloud Analytics Market Insights: Size, Share & Trends – https://www.meticulousresearch.com/product/cloud-analytics-market-5208
Home Medical Equipment Market by Size, Share, Forecast, & Trends Analysis – https://www.meticulousresearch.com/product/home-medical-equipment-market-1284
IoT in Healthcare Market Size, Share, & Trends 2031 – https://www.meticulousresearch.com/product/iot-in-healthcare-market-4945
Surgical Sutures Market by Size, Share, & Trends 2030 – https://www.meticulousresearch.com/product/surgical-sutures-market-4947
Lab Automation Market: Share, Trends & Forecast Analysis – https://www.meticulousresearch.com/product/lab-automation-market-1221
Asia Pacific EV Battery Market by Size, Share, Forecasts, & Trends Analysis – https://www.meticulousresearch.com/product/asia-pacific-ev-battery-market-5217
Medical Imaging Market: Products, Applications, & Forecasts – https://www.meticulousresearch.com/product/medical-imaging-market-4950
Medical Ceramics Market by Size, Share, Forecast, & Trends Analysis – https://www.meticulousresearch.com/product/medical-ceramics-market-5538
Pharmaceutical Packaging Market Size, & Trends 2031 – https://www.meticulousresearch.com/product/pharmaceutical-packaging-market-5298
Ultrasound Market by Size, Share, Forecasts, & Trends Analysis – https://www.meticulousresearch.com/product/ultrasound-market-4972
Tissue Diagnostics Market Insights: Size, Trends & Forecast – https://www.meticulousresearch.com/product/tissue-diagnostics-market-4971
Contact:
Mr. Khushal Bombe
Meticulous Market Research Inc.
1267 Willis St, Ste 200 Redding,
California, 96001, U.S.
USA: +1-646-781-8004
Europe: +44-203-868-8738
APAC: +91 744-7780008
Email- sales@meticulousresearch.com
Visit Our Website: https://www.meticulousresearch.com/
Connect with us on LinkedIn- https://www.linkedin.com/company/meticulous-research
Meticulousblog.org | Top Market Research Reports Blog – https://meticulousblog.org/
Content Source: https://www.meticulousresearch.com/pressrelease/967/lab-automation-market
Photo: https://mma.prnewswire.com/media/2506511/Lab_Automation_Market.jpg
Logo: https://mma.prnewswire.com/media/1757980/Meticulous_Research_Logo_1.jpg
View original content:https://www.prnewswire.co.uk/news-releases/lab-automation-market-to-reach-11-31-billion-by-2031–driven-by-rising-pharmaceutical–biotech-rd-expenditures-and-increasing-demand-for-automated-laboratories-and-instruments—report-by-meticulous-research-302249256.html


 Technology5 days ago
 Technology5 days ago

 Technology5 days ago
 Technology5 days ago
 Technology5 days ago

 Coin Market5 days ago