Connect with us

Technology

Genomics Market to Reach $70.52 Billion by 2031, Driven by Increasing Incorporation of Genomic Data in Clinical Workflows and Increasing Funding and Investments in Genomics Projects – Exclusive Report by Meticulous Research®

Published

on

REDDING, Calif., Sept. 24, 2024 /PRNewswire/ — According to a new market research report titled, ‘Genomics Market Size, Share, Forecast, & Trends Analysis by Technology (Sequencing, Microarray, Nucleic Acid Extraction), Application (Drug Discovery, Diagnostic, Research), Offering (Instrument, Consumables, Software), End User—Global Forecast to 2031.

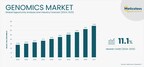
The genomics market is projected to reach $70.52 billion by 2031, at a CAGR of 11.1% from 2024 to 2031.

Download FREE PDF Brochure Of Genomics Market –
https://www.meticulousresearch.com/download-sample-report/cp_id=1262

The rising prevalence of genetic diseases, the increasing incorporation of genomic data in clinical workflows, increasing funding and investments in genomics projects, growing applications of genomics in the healthcare sector, rising pharmaceutical R&D expenditures, and increasing healthcare spending are key factors driving the growth of the genomics market. However, concerns over the security & privacy of genomic data and the lack of standardized approaches in genomics are factors restraining the growth of this market.

Furthermore, the rising adoption of personalized medicines and gene therapies is expected to create opportunities for the players operating in the genomics market. However, the shortage of skilled bioinformatics & genomics personnel and the commercialization & scaling of genomic technologies are major challenges impacting market growth. READ MORE

Increasing Funding and Investments in Genomics Projects Reshaping the Market Landscape

Pharmaceutical and biotechnology companies have been increasingly focused on genomic research since 2003 – the year of completion and publishing of the full sequence of the entire human genome. Furthermore, increasing funding for genomic research, the development of advanced sequencing technologies & bioinformatics tools, and the reducing costs of genomic studies are generating opportunities for pharmaceutical and biotechnology companies to engage more in the research and development of personalized/precision medicine, targeted therapeutics, and vaccines. These factors have also helped companies as well as academic & research institutes to conduct more studies focused on mapping and identifying variants and studying the mechanisms of various rare and genetic diseases.

Get Insightful Data On Regions, Market Segments, Customer Landscape, And Top Companies (Charts, Tables, Figures And More) – https://www.meticulousresearch.com/request-sample-report/cp_id=1262

The pharmaceutical industry is also investing in genomic data-sharing initiatives to accelerate the research and development of novel personalized therapies. Also, research and academic institutes are partaking in genomic studies and collaborating with key pharmaceutical companies to exchange genomic data and discover new personalized therapies for various rare and genetic diseases. Some of the recent funding and investments supporting genomics studies are as follows:

In December 2022, the U.K. government announced $217 million (€175 million) in funding for genomics research, including $130 million (€105 million) to boost the diagnosis of rare genetic diseases in newborns.In September 2022, the Centers for Disease Control and Prevention (CDC) announced $90 million in funding over the next five years to support the Pathogen Genomics Centers of Excellence (PGCoE) network, which is aimed at accelerating innovations and improving technical capacities in molecular epidemiology, pathogen genomes, and bioinformatics for the prevention and control of microbial threats to public health.In March 2022, the National Institutes of Health (NIH) allocated $89 million in funding for advancing genome editing projects to develop new technologies and novel research approaches in the somatic cell genome editing program.According to the UK Parliament article published in December 2022, the U.K. government provided $27 million (£22 million) in funding to Genomics England for sequencing 15,000 to 25,000 participants from diverse backgrounds by 2025 and tackling health inequalities in genomic medicine.

Automation in Next-Generation Sequencing (NGS): A Key Trend in the Genomics Market

The ability to sequence the genes of any organism for clinical and research purposes has proved to be a game changer for public health. Portable handheld sequencing devices are paving the way for the growth of the genomics market, making sequencing cheaper, simpler, and faster without the need for large clinical laboratories. Real-time sequencing has enabled researchers and physicians to quickly access sequencing data and act instantly. Portable nanopore-based sequencers can sequence the entire genome in less than $1,000. Additionally, automating NGS library preparation has helped researchers improve their library quality and achieve consistent yields, enabling the generation of reliable and reproducible NGS data.

NGS automation has also enhanced the efficiency of sequencing in terms of time and cost. The risk of contamination is greatly decreased by reducing human interactions with reagents and samples. According to a study that analyzed the cost breakdown for genome sequencing, lab personnel account for around 15% of the total cost of sequencing in a conventional clinical laboratory. A similar study showed that when an automated system is used for sample preparation, the cost of laboratory personnel decreases to around 4% of the total cost. Thus, automation optimizes & streamlines NGS workflows.

Explore the Key Market Segments Driving Growth (Download Free Sample) – https://www.meticulousresearch.com/download-sample-report/cp_id=1262

Genomics Market Analysis: Key Segmental Findings

By offering: In 2024, the consumables segment is expected to account for the largest share of 68.9% of the genomics market. The segment’s large market share can be attributed to the increasing demand for consumables due to the growing number of genomic tests, more recurring purchases of consumables compared to instruments, and the increasing prevalence of genetic diseases. For instance, according to a report published by MJH Life Sciences (U.S.) in 2022, approximately 300,000 babies are born with sickle cell disease per year globally, and nearly 5% of the world’s population is affected by the disease.By Technology: In 2024, the sequencing segment is expected to register the highest CAGR of 15.3% during the forecast period 2024–2031. The high growth of this segment is driven by the growing adoption of NGS for sequencing, the rising prevalence of cancer & the expanding application of NGS in cancer treatment & research, the declining costs of NGS, and technological advancements in NGS. Additionally, the growing demand for NGS automation, and the development of portable sequencing technologies also support the growth of this segment.

Geographic Analysis:

North America Poised to Dominate the Genomics Market in 2024

Based on geography, the genomics market is segmented into North America, Europe, Asia-Pacific, Latin America, and the Middle East & Africa. In terms of value, in 2024, North America is expected to account for the largest share of 53.3% of the genomics market. This market is projected to reach $36.2 billion by 2031. North America’s dominant position in the genomics market is attributed to government initiatives toward the development of genomic medicine, the increased use of genomics since the COVID-19 pandemic, increasing research in the field of genomics, and the advanced healthcare infrastructure in the region.

Have specific research needs? Request a customized research report – https://www.meticulousresearch.com/request-customization/cp_id=1262

In addition, North America is home to numerous renowned research institutions, universities, and organizations dedicated to genomics research—examples include the Broad Institute, Harvard University, MIT, and the National Institutes of Health (NIH) in the U.S., as well as the University of Toronto, McGill University, and the Ontario Institute for Cancer Research (OICR) in Canada. In North America, genomics is a multidisciplinary field encompassing research, technology development, and applications related to the study of genomes (complete sets of genes within an organism’s DNA). In North America, genomics has been a significant and rapidly evolving field with broad applications in various areas of science and medicine.

In 2024, the U.S. is expected to account for the dominant share of 91.6% of the genomics market in North America. The country’s large market share is mainly attributed to the availability of advanced technologies & resources for healthcare, research funding, government initiatives to promote precision medicine, high public & private investments in genomics, and the availability of skilled professionals in the country.

Asia-Pacific: The Fastest-growing Regional Market

The genomics market in Asia-Pacific is projected to register the highest CAGR of 13.8% during the forecast period. In 2024, China is expected to account for the largest share of 38.9% of the genomics market in Asia-Pacific. Economic growth in many Asia-Pacific countries has increased government focus on the healthcare sector in terms of investments aimed at improving access to healthcare facilities and building better healthcare infrastructure. Rapid urbanization, the need to manage the growing burden of infectious diseases, efforts to improve access to diagnostic services, and rising awareness regarding health and treatment availability are driving the growth of this market. Moreover, rising middle-class populations and their disposable incomes, increasing health insurance penetration, the growing potential of personalized therapies, and public and private investments are expected to support market growth during the forecast period.

Funding from public & private organizations for the development of innovative genomic medicine has increased China’s focus on strengthening its genomics market.

Some of the recent key developments in this market are as follows:

In January 2023, Qitan Technology Co. Ltd. (China) raised $104 million (¥700 million) in a series C round to improve its nanopore sequencing devices and expand its market in China.In June 2022, Chinese sequencing technology company Axbio secured $100 million in Series B funding. The funds supported the development and commercialization of its nanopore-based sequencer and the building of a manufacturing facility.In 2016, the People’s Republic of China announced $9 billion in funding for a 15-year project to collect, analyze, and sequence genomic data and become a global leader in precision medicine.

Need Insights on Regional Data? Check Out Our Detailed Analysis (Download Free Sample) –

Genomics Market: Competition Analysis

This report offers a competitive analysis based on an extensive assessment of the leading players’ product portfolios, geographic presence, and key growth strategies adopted over the past 3–4 years. Major companies in the genomics market have implemented various strategies to expand their product offerings and global footprints and augment their market shares. The key strategies followed by most companies in the genomics market include product launches, expansions, agreements, collaborations, and partnerships. The key players operating in the genomics market include Agilent Technologies, Inc. (U.S.), Bio-Rad Laboratories, Inc. (U.S.), Danaher Corporation (U.S.), Thermo Fisher Scientific Inc. (U.S.), Illumina, Inc. (U.S.), QIAGEN N.V. (Netherlands), Pacific Biosciences of California, Inc. (U.S.), Oxford Nanopore Technologies Plc. (U.K.), Eppendorf SE (Germany), Myriad Genetics, Inc. (U.S.), Revvity, Inc. (Formerly PerkinElmer, Inc.) (U.S.), and BGI Genomics Co. Ltd (China).

The report includes a competitive dashboard that summarizes the market positions of the 20 profiled market players in four quadrants, namely Industry Leaders, Differentiators, Emerging Companies, and Vanguards. These companies are positioned based on various parameters, including revenue, depth of offerings, brand equity, geographic presence, innovation, and organic & inorganic growth strategies. Illumina, Inc. (U.S.), Thermo Fisher Scientific Inc. (U.S.), QIAGEN N.V (U.S.), and Danaher Corporation (U.S.) were positioned in the Industry Leaders quadrant.

Learn About the Top Companies Influencing Market Dynamics (Download Free Sample) –

Genomics Industry Overview: Latest Strategic Developments from Key Industry Players

In January 2024, Thermo Fisher Scientific Inc. (U.S.) received GMP approval from the Italian Medicines Agency (AIFA) for its manufacturing facility for RNA-based products in Monza, Italy.In January 2024, Thermo Fisher launched the Axiom PangenomiX Array, a comprehensive and ethnically diverse genomic coverage on a high-throughput microarray that delivers multi-disease and pharmacogenomic research analysis across global populations.In January 2024, Illumina, Inc. (U.S.) extended its collaboration with Janssen Research & Development, LLC (U.S.) for the development of Illumina’s novel Molecular Residual Disease (MRD) assay, a Whole-genome Sequencing (WGS) multi-cancer research solution that detects circulating tumor DNA (ctDNA).In January 2024, QIAGEN N.V. (Netherlands) announced plans to open its regional headquarters in Riyadh, Saudi Arabia, to further strengthen its footprint in the region. QIAGEN had also signed a Memorandum of Understanding (MoU) with Saudi Arabia’s Ministry of Health, addressing various public health and infection control initiatives.In December 2023, Danaher Corporation (U.S.) acquired Abcam plc (U.K.). Abcam operates as a standalone company and brand within Danaher’s Life Sciences segment, furthering Danaher’s strategy to help map complex diseases and accelerate drug discovery.In September 2023, Integrated DNA Technologies, a subsidiary of Danaher Corporation (U.S.), launched xGen NGS products designed exclusively for the Ultima Genomics UG 100TM platform.In June 2023, Agilent Technologies, Inc. (U.S.) launched Agilent 6495D LC/TQ and Agilent Revident LC/Q-TOF. The company also launched Agilent MassHunter Explorer Profiling software and the new Agilent ChemVista library manager software.In May 2022, Bio-Rad Laboratories, Inc. (U.S.) launched the CFX Duet Real-Time PCR System to support researchers in developing singleplex and duplex quantitative PCR (qPCR) assays.In December 2021, Pacific Biosciences of California, Inc. (U.S.) launched its HiFiViral SARS-CoV-2 Kit, which helps detect the Omicron Variant and provides information important for public health.

IMMEDIATE DELIVERY AVAILABLE | BUY THIS RESEARCH REPORT (Insights, Charts, Tables, Figures and More) – https://www.meticulousresearch.com/Checkout/61289368

Scope of the Report:

Genomics Market Assessment—by Offering

ConsumablesInstrumentsSoftwareServices

Genomics Market Assessment—by Technology

Polymerase Chain Reaction (PCR)SequencingNext-generation Sequencing (NGS)Other Sequencing TechnologiesNucleic Acid Extraction & PurificationMicroarrayOther Technologies

Note: Other sequencing technologies include pyrosequencing, degradome sequencing, Sanger sequencing, Chromatin Immunoprecipitation (ChIP) sequencing, and methylation sequencing.

Note: (Other technologies include cell counting, transfection, and gene editing.)

Click Here For More Details – https://www.meticulousresearch.com/download-sample-report/cp_id=1262

Genomics Market Assessment—by Application

DiagnosticsDrug Discovery & DevelopmentLife Sciences ResearchCancer ResearchStem Cell ResearchOther Life Sciences ResearchOther Applications

Note: Other life sciences research applications include cardiovascular diseases, osteoporosis, immunology, neurobiology, cellular & molecular biology, and diabetes research.

Note: Other applications include agriculture, forensics, and environmental applications.

Genomics Market Assessment—by End User

Pharmaceutical & Biotechnology CompaniesHospitals & ClinicsDiagnostics LaboratoriesContract Research Organizations (CROs)Academic & Research InstitutesOther End Users

Note: Other end users include food & beverage companies, agricultural companies, and forensics.

Browse In-depth Report Now – https://www.meticulousresearch.com/product/genomics-market-1262

Genomics Market Assessment—by Geography

North AmericaU.S.CanadaEuropeGermanyFranceU.K.ItalySpainRest of EuropeAsia-PacificChinaJapanIndiaRest of Asia-PacificLatin AmericaBrazilMexicoRest of Latin AmericaMiddle East & Africa

Browse More Related Reports –

Animal Genetics Market is projected to hit $9.12 billion by 2031, growing at a CAGR of 5.8% from 2024. Discover key trends driving this growth – https://www.meticulousresearch.com/product/animal-genetics-market-5863

Spatial Genomics & Transcriptomics Market is projected to reach $3.23 billion by 2031 at a CAGR of 27.8% from 2024 to 2031  – https://www.meticulousresearch.com/product/spatial-genomics-market-5763

According to this latest publication from Meticulous Research,genetic testing market is projected to reach $ 28.24 billion by 2030, at a CAGR of 10.4% – https://www.meticulousresearch.com/product/genetic-testing-market-5370

Global Artificial Intelligence in genomics market is slated to register a CAGR of 42.8% during forecast period 2022–2029 to reach $6.22 billion by 2029 – https://www.meticulousresearch.com/product/ai-in-genomics-market-5345

Next Generation Sequencing For Industry Outlook is projected to reach $42.7 billion by 2031 at a CAGR of 15.7% from 2024 to 2031 – https://www.meticulousresearch.com/product/NGS-market-industry-outlook-5957

NGS Automation Market is expected to grow at a CAGR of 13.4% from 2022–2029 to reach $1.33 billion by 2029 – https://www.meticulousresearch.com/product/ngs-automation-market-5271

Saudi Arabia’s NGS market, valued at $24.4 Million in 2023, is projected to grow to $50 Million by 2031, with a CAGR of 10.1% from 2024 to 2031 – https://www.meticulousresearch.com/product/saudi-arabia-ngs-market-6002

Latin America NGS Market is expected to register a CAGR of 13.9% from 2024 to 2031 to reach $765.2 million by 2031 – https://www.meticulousresearch.com/product/latin-america-ngs-market-5780

Asia-Pacific Next Generation Sequencing (NGS) Market is expected to grow at a CAGR of 16.9% from 2024 to 2030 to reach $6.38 billion by 2030 – https://www.meticulousresearch.com/product/asia-pacific-next-generation-sequencing-market-5722

North America NGS Market to be worth $13.7 billion by 2030, growing at a 16% CAGR from 2024–2030 – https://www.meticulousresearch.com/product/north-america-ngs-market-5607

Genomics Market Report Summary:

Particulars

Details

Number of Pages

320

Format

PDF

Forecast Period

2024-2031

Base Year

2023

CAGR (2024–2031)

11.1 %

Estimated Market Size (Value)

$70.52 Billion by 2031

Segments Covered

 By Offering

InstrumentsConsumablesSoftwareServices

 By Technology

Polymerase Chain Reaction (PCR)SequencingNGSOther Sequencing TechnologiesNucleic Acid Extraction and PurificationMicroarrayOther Technologies
(Note 1: Other sequencing technologies include pyrosequencing, degradome sequencing, Sanger sequencing, Chromatin Immunoprecipitation (ChIP) sequencing, and methylation sequencing.
Note 2: Other technologies include cell counting, transfection, and gene editing.)

 By Application

DiagnosticsDrug Discovery & DevelopmentLife Science ResearchCancer ResearchStem Cell ResearchOther Life Science ResearchOther Applications
(Note 1: Other life science research applications include cardiovascular diseases, osteoporosis, immunology, neurobiology, cellular and molecular biology, and diabetes research.
Note 2: Other applications include agriculture, forensics, and environmental applications.)

 By End User

Pharmaceutical & Biotechnology CompaniesHospitals & ClinicsDiagnostics LaboratoriesContract Research Organizations (CROs)Academic & Research InstitutesOther End Users
(Note: Other end users include food & beverage companies, agricultural companies, and forensics.)

Countries Covered

North America (U.S. and Canada), Europe (Germany, France, U.K., Italy, Spain, Rest of Europe), Asia-Pacific (China, Japan, India, Rest of Asia-Pacific), Latin America (Brazil, Mexico, Rest of Latin America), and the Middle East & Africa

Key Companies Profiled

Agilent Technologies, Inc. (U.S.), Bio-Rad Laboratories, Inc. (U.S.), Danaher Corporation (U.S.), Thermo Fisher Scientific Inc. (U.S.), Illumina, Inc. (U.S.), QIAGEN N.V. (Netherlands), Pacific Biosciences of California, Inc. (U.S.), Oxford Nanopore Technologies Plc. (U.K.), Eppendorf SE (Germany), Myriad Genetics, Inc. (U.S.), Revvity, Inc. (Formerly PerkinElmer, Inc.) (U.S.), and BGI Genomics Co. Ltd (China)

Click here to: Get Free Sample Pages of this Report

Hot Industry Reports: Emerging Trends and Market Forecasts –

Automated Material Handling Systems Market Size, Share, & Report 2030 – https://www.meticulousresearch.com/product/automated-material-handling-systems-market-5149

Healthcare Cybersecurity Market Size, Share, & Report 2031 – https://www.meticulousresearch.com/product/healthcare-cybersecurity-market-5116

Direct to Consumer (DTC) Pet Food Market by Size, Share, Forecasts, & Trends Analysis – https://www.meticulousresearch.com/product/direct-to-consumer-pet-food-market-5146

Haematococcus Pluvialis Market by Size, Share, Forecasts, & Trends Analysis – https://www.meticulousresearch.com/product/haematococcus-pluvialis-market-5142

South East Asia English Language Learning Market by Size, Share, Forecast, & Trends Analysis – https://www.meticulousresearch.com/product/south-east-asia-english-language-learning-market-5677

Interactive Display Market by Size, Share, Forecasts, & Trends Analysis – https://www.meticulousresearch.com/product/interactive-display-market-5125

Semiconductor and Circuit Manufacturing Market by Size, Share, Forecasts, & Trends Analysis – https://www.meticulousresearch.com/product/semiconductor-and-circuit-manufacturing-market-5092

Automotive Powertrain Sensors Market Trends & Forecast – https://www.meticulousresearch.com/product/automotive-powertrain-sensors-market-5155

Water Quality Testing Market Size, Share, Forecasts, & Trends Analysis – https://www.meticulousresearch.com/product/water-quality-testing-market-5501

Clear Aligners Market Size, Share & Trends: 2023 to 2030 – https://www.meticulousresearch.com/product/clear-aligners-market-5331

Testing, Inspection and Certification Market 2030 Key Trends – https://www.meticulousresearch.com/product/testing-inspection-and-certification-market-5151

Power Tools Market: Size, Share, Trends, & Forecast Analysis – https://www.meticulousresearch.com/product/power-tools-market-5810

Medical Laser Market Growth & Share Insights 2024 – 2031 – https://www.meticulousresearch.com/product/medical-lasers-market-5196

Laser Technology Market by Size, Share, Forecasts, & Trends Analysis – https://www.meticulousresearch.com/product/laser-technology-market-5189

Dialysis Market Size, Share, Growth, & Trends Report 2031 – https://www.meticulousresearch.com/product/dialysis-market-5137

Tertiary Water and Wastewater Treatment Technologies Market by Size, Share, Forecasts, & Trends Analysis – https://www.meticulousresearch.com/product/tertiary-water-and-wastewater-treatment-technologies-market-5185

Parking Management Market by Size, Share, Forecasts, & Trends Analysis – https://www.meticulousresearch.com/product/parking-management-market-5094

Dunaliella Salina Market by Size, Share, Forecasts, & Trends Analysis – https://www.meticulousresearch.com/product/dunaliella-salina-market-5168

Electric Car Market: Power Trends & Forecasts 2024 – https://www.meticulousresearch.com/product/electric-car-market-5187

Pharmaceutical Contract Development and Manufacturing Market – https://www.meticulousresearch.com/product/pharmaceutical-contract-development-and-manufacturing-market-5171

Delivery Drones Market: Trends, Size & Forecasts to 2031 – https://www.meticulousresearch.com/product/delivery-drones-market-5193

Electric Vehicle Market Trends & Forecast Analysis – https://www.meticulousresearch.com/product/electric-vehicle-market-5179

IoT Sensors Market Size, Share, Forecast, & Trends Analysis – https://www.meticulousresearch.com/product/iot-sensors-market-5738

Virtualized Evolved Packet Core Market by Size, Share, Forecasts, & Trends Analysis – https://www.meticulousresearch.com/product/virtualized-evolved-packet-core-market-5201

Seaweed Market by Size, Share, Forecasts, & Trends Analysis – https://www.meticulousresearch.com/product/seaweed-market-5183

Dental 3D Printing Material Market Size, Share, Growth, & Trends – https://www.meticulousresearch.com/product/dental-3d-printing-material-market-5204

SCADA Market Size, Share, Forecast, & Trends Analysis – https://www.meticulousresearch.com/product/scada-market-5186

IoT Security Market by Size, Share, Forecasts, & Trends Analysis – https://www.meticulousresearch.com/product/iot-security-market-5254

Electric Scooter Market Size, Share, Report, & Trends 2031 – https://www.meticulousresearch.com/product/electric-scooter-market-5191

Canada Black Soldier Fly Market by Size, Share, Forecasts, & Trends Analysis – https://www.meticulousresearch.com/product/canada-black-soldier-fly-market-5230

Contact:
Mr. Khushal Bombe
Meticulous Market Research Pvt. Ltd.
1267 Willis St, Ste 200 Redding,
California, 96001, U.S.
USA: +1-646-781-8004
Europe: +44-203-868-8738
APAC: +91 744-7780008
Email- mailto:sales@meticulousresearch.com
Visit Our Website: https://www.meticulousresearch.com/
Connect with us on LinkedIn- https://www.linkedin.com/company/meticulous-research
Meticulousblog.org | Top Market Research Reports Blog – https://meticulousblog.org/
Content Source: https://www.meticulousresearch.com/pressrelease/245/genomics-market

Photo: https://mma.prnewswire.com/media/2514303/Genomics_Market_Size.jpg
Logo: https://mma.prnewswire.com/media/1757980/Meticulous_Research_Logo_1.jpg


View original content to download multimedia:https://www.prnewswire.com/news-releases/genomics-market-to-reach-70-52-billion-by-2031–driven-by-increasing-incorporation-of-genomic-data-in-clinical-workflows-and-increasing-funding-and-investments-in-genomics-projects—exclusive-report-by-meticulous-research-302257383.html

SOURCE Meticulous Market Research Pvt. Ltd.

Continue Reading
Click to comment

Leave a Reply

Your email address will not be published. Required fields are marked *

Technology

In HelloNation, Senior Living Experts Rusty and Kelly Ackerman Explain What Families Should Ask a Senior Living Community

Published

on

By

TRAVERSE CITY, Mich., April 30, 2026 /PRNewswire/ — The article outlines how thoughtful questions reveal care quality, communication practices, and daily life in senior living communities.

What should families focus on when evaluating a senior living community beyond first impressions? HelloNation has released an article that provides clear guidance on how to approach this decision with confidence and clarity.

The article features insights from Senior Living Experts Rusty and Kelly Ackerman of French Manor Assisted Living in Traverse City, Michigan, and highlights how asking the right questions during a senior living community tour can reveal how care and daily life truly function.

The HelloNation article explains that while appearance and atmosphere matter, the most meaningful insights come from asking the right questions. Families who take a thoughtful approach during a senior living community tour can better understand how care, communication, and daily routines operate behind the scenes.

One of the most important areas discussed is how personalized care plans are developed and maintained. The article describes how communities assess individual needs and adjust care over time. It notes that asking about evaluation frequency and how changes in health or mobility are handled gives families a clearer understanding of long-term support.

Communication is another central topic. The article emphasizes the importance of knowing who the main point of contact is and how updates are shared. Consistent communication helps families stay informed and builds trust between residents, staff, and loved ones.

Safety measures are addressed with a focus on specifics. The article encourages families to ask about emergency response times, monitoring systems, and protocols. These safety measures are essential for both urgent situations and everyday peace of mind.

Daily routines also provide valuable insight into community life. The article explains that families should ask what a typical day includes, from meals to activities and rest periods. Observing these routines during a senior living community tour helps determine whether the environment supports both structure and independence.

Staff training is another key factor highlighted in the article. It describes how onboarding and ongoing education prepare caregivers to meet a range of needs. Senior Living Experts note that well-trained staff contribute to consistent care and are better equipped to respond to changing situations.

The article also focuses on resident engagement. Asking about social opportunities, wellness programs, and group activities helps families understand how residents stay connected and active. Strong resident engagement supports emotional well-being and fosters meaningful relationships.

Transitions are another important consideration. The article explains that families should ask how communities support new residents and those with increasing care needs. Understanding this process helps ensure continuity and reduces stress during periods of change.

In addition, the article discusses how feedback is gathered and used. Communities that hold meetings, conduct surveys, or encourage open communication tend to be more responsive. This approach supports a stable and supportive environment for residents and families alike.

Overall, the HelloNation article emphasizes that choosing a senior living community involves more than evaluating physical space. By focusing on personalized care plans, communication, safety measures, staff training, and resident engagement, families can make more informed decisions.

For readers seeking practical guidance, the article provides a clear framework for evaluating options through meaningful questions rather than surface impressions.

What Families Should Ask a Senior Living Community features insights from Rusty and Kelly Ackerman, Senior Living Experts of Traverse City, Michigan, in HelloNation.

About HelloNation
HelloNation is a premier media platform that connects readers with trusted professionals and businesses across various industries. Through its innovative “edvertising” approach that blends educational content with storytelling, HelloNation delivers expert-driven, good-news articles that inform, inspire, and empower. Covering topics from home improvement and health to business strategy and lifestyle, HelloNation highlights leaders making a meaningful impact in their communities.

View original content to download multimedia:https://www.prnewswire.com/news-releases/in-hellonation-senior-living-experts-rusty-and-kelly-ackerman-explain-what-families-should-ask-a-senior-living-community-302759459.html

SOURCE HelloNation

Continue Reading

Technology

Suzano Selects Avondale Global Gateway as Gulf Coast Hub, Bringing Regular Wood Pulp Imports Back to Louisiana for First Time in More Than 30 Years

Published

on

By

Five-year agreement establishes Avondale Global Gateway as a key Gulf Coast terminal for Suzano’s growing North American operations

AVONDALE, La., April 30, 2026 /PRNewswire/ — Avondale Global Gateway (AGG) and Suzano today announced a five-year terminal services agreement that will bring regular wood pulp imports back to Louisiana for the first time in more than 30 years.

Under the agreement, AGG will serve as one of Suzano’s terminals in the Central Gulf Coast for their wood pulp shipments arriving from Brazil, to be distributed across North America by rail. The first vessel is scheduled to arrive at AGG in the first week of May this year.

The agreement marks a significant milestone for both Louisiana and Suzano, the world’s largest pulp supplier and one of Brazil’s biggest exporters which has been present in the American market for over 40 years. Suzano’s decision also aligns with its continued expansion in the region, including its 2024 acquisition of mills in Arkansas and North Carolina from Pactiv Evergreen. As part of its North American growth strategy, Suzano selected Avondale following a two-year evaluation process focused on logistics efficiency, infrastructure, and long-term scalability. The Avondale operation will support this strategy by creating a more centralized and efficient logistics footprint on the Gulf Coast.

“An efficient and resilient supply chain is essential to our business, and Avondale offers the combination of river access, rail connectivity, port infrastructure, and operational flexibility we were looking for,” said Juliana Vizintim, Operations Executive Manager at Suzano. “This partnership strengthens our Gulf Coast logistics platform and enhances supply assurance and efficiency for our customers across North America. At Suzano, we believe it is only good for us if it is good for the world, and we view this milestone as a foundation for long-term value creation—benefiting the local community, our business partners, and our customers. Suzano and Avondale share a common vision focused on collaboration, growth, and building a sustainable future together.”

To support the new operation, AGG has completed major upgrades to 245,000 square feet of warehouse space, including new concrete flooring, five additional loading doors, loading platforms, overhead awnings, and a laser fire detection and suppression system. These improvements were made specifically to meet Suzano’s operational requirements.

In parallel, a $13 million rail expansion is underway at Avondale, funded in part through Louisiana Economic Development’s FastSites program. Together with other site improvements, total investment tied to the Suzano operation is expected to exceed $20 million over time. The project is also expected to support 50 full-time jobs.

“Bringing wood pulp back to Louisiana is a major milestone,” said Adam Anderson, Chairman and CEO of T. Parker Host, parent company of Avondale Global Gateway. “This is new activity for the state, new jobs, and meaningful investment at Avondale. It reflects the kind of long-term industrial growth we believed this site could support and shows what’s possible when the right partner, infrastructure, and location come together.”

Rail service will play a central role in the operation, allowing cargo to move efficiently from vessel to warehouse to inland destinations across the United States. AGG worked closely with Union Pacific to align infrastructure and service capacity ahead of launch.

Since T. Parker Host acquired the former Avondale Shipyard in 2018, the 275-acre site has been steadily redeveloped into a multimodal logistics hub. Today, Avondale supports more than 600 workers across site operations, tenants, and active construction.

About Avondale Global Gateway

Avondale Global Gateway is a multimodal logistics and terminal facility located on the Mississippi River in Jefferson Parish, Louisiana. Operated by T. Parker Host, the site offers deepwater dock access, large-scale warehousing, and Class I rail connectivity, supporting bulk and breakbulk cargo flows across North America. Learn more at www.avondaleglobalgateway.com

About Suzano

Suzano is the world’s largest pulp supplier, a major paper and packaging producer in the Americas, and one of Brazil’s largest employers.

Driven by a deep commitment to sustainability and innovation, Suzano produces responsibly grown raw materials that are exported to more than 100 countries, meeting global demand for bio-based solutions. These materials are used in everyday products that reach more than two billion people, including tissue, packaging, printing and writing paper, personal hygiene products, and textiles.

Founded in Brazil more than 100 years ago, Suzano operates across Latin America, North America, Europe, and Asia. The company’s shares are listed on B3 in São Paulo (SUZB3) and the New York Stock Exchange (SUZ). Learn more at suzano.com.br/en.

View original content to download multimedia:https://www.prnewswire.com/news-releases/suzano-selects-avondale-global-gateway-as-gulf-coast-hub-bringing-regular-wood-pulp-imports-back-to-louisiana-for-first-time-in-more-than-30-years-302759457.html

SOURCE Avondale Global Gateway

Continue Reading

Technology

Dolby Laboratories Reports Second Quarter 2026 Financial Results

Published

on

By

SAN FRANCISCO, April 30, 2026 /PRNewswire/ — Dolby Laboratories, Inc. (NYSE: DLB) today announced the company’s financial results for the second quarter of fiscal 2026.

“We continue to strengthen our position and create growth opportunities across existing and new business areas,” said Kevin Yeaman, President and CEO, Dolby Laboratories. “This quarter, we continued to expand our reach especially in sports with events like the Super Bowl, Winter Olympics and T20 Cricket World Cup available in Dolby and automotive with automakers including BMW and Lexus integrating Dolby into their in-car experiences.”

Second Quarter Fiscal 2026 Financial Highlights

Total revenue was $396 million, compared to $370 million for the second quarter of fiscal 2025.GAAP net income was $95 million or $0.99 per diluted share, compared to GAAP net income of $92 million or $0.94 per diluted share for the second quarter of fiscal 2025. On a non-GAAP basis, second quarter net income was $131 million or $1.37 per diluted share, compared to $131 million or $1.34 per diluted share for the second quarter of fiscal 2025.Dolby repurchased approximately one million shares of its common stock for approximately $65 million, and ended the quarter with approximately $142 million of stock repurchase authorization available going forward.

A complete listing of Dolby’s non-GAAP measures are described and reconciled to the corresponding GAAP measures at the end of this release.

Recent Business Highlights

Various sporting events were shown in Dolby Atmos and/or Dolby Vision including the Super Bowl, the 2026 Olympic Winter Games, and the ICC Men’s T20 Cricket World Cup. Apple TV is streaming Formula One in Dolby Vision.At the 2026 Beijing International Automotive Exhibition (Auto China 2026), BMW and Dolby announced the launch of Dolby Atmos in the new BMW 7 Series and the new BMW iX3 Long Wheelbase.Douyin, the Chinese version of TikTok, is fully supporting content in Dolby Vision.Hisense, TCL and Philips have announced plans to release a wide range of Dolby Vision 2 enabled TVs globally by the end of the year, with Peacock and Canal+ committed to delivering content.Sharp and SK Planet joined the Video Distribution Program, bringing the licensor total to 40.

Dividend

Today, Dolby announced a cash dividend of $0.36 per share of Class A and Class B common stock, payable on May 20, 2026, to stockholders of record as of the close of business on May 12, 2026.

Financial Outlook

Dolby’s financial outlook relies, in part, on estimates of royalty-based revenue that take into consideration various factors that are subject to uncertainty, including consumer demand for electronic products. In addition, actual results could differ materially from the estimates Dolby is providing herein due in part to uncertainty resulting from the macroeconomic effect of certain conditions, including developments concerning trade restrictions and changes in trade or diplomatic relationships, supply chain constraints, international conflicts, geopolitical instability, and fluctuations in inflation and interest rates. The uncertainty resulting from these factors has greatly reduced visibility into Dolby’s future outlook. To the extent possible, the estimates Dolby is providing for future periods reflect certain assumptions about the potential impact of certain of these items, based upon a consideration of currently available external and internal data and information. These assumptions are subject to risks and uncertainties. For more information, see “Forward-Looking Statements” in this press release for a description of certain risks that Dolby faces, and the section captioned “Risk Factors” in its Quarterly Report on Form 10-Q for the second quarter of fiscal 2026, to be filed on or around the date hereof.

Dolby is providing the following estimates for its third quarter of fiscal 2026:

Total revenue is estimated to range from $295 million to $325 million.Licensing revenue is estimated to range from $270 million to $300 million. Gross margins are anticipated to be approximately 86% on a GAAP basis and approximately 88% on a non-GAAP basis.Operating expenses are anticipated to range from $235 million to $245 million on a GAAP basis and from $200 million to $210 million on a non-GAAP basis.Effective tax rate is anticipated to be around 23% on a GAAP basis and around 21% on a non-GAAP basis.Diluted earnings per share is anticipated to range from $0.19 to $0.34 on a GAAP basis and from $0.56 to $0.71 on a non-GAAP basis.

Dolby is providing the following estimates for the full year of fiscal 2026:

Total revenue is expected to range from $1.40 billion to $1.45 billion.Licensing revenue is estimated to range from $1.295 billion to $1.345 billion. Gross margins are anticipated to be approximately 88% on a GAAP basis and approximately 90% on a non-GAAP basis.Operating expenses are anticipated to range from $930 million to $950 million on a GAAP basis and from $780 million to $800 million on a non-GAAP basis.Dolby expects operating margins to be approximately 21% on a GAAP basis and to be approximately 34% on a non-GAAP basis.Effective tax rate is anticipated to be around 23% on a GAAP basis and around 20% on a non-GAAP basis.Diluted earnings per share is anticipated to range from $2.66 to $2.81 on a GAAP basis and from $4.30 to $4.45 on a non-GAAP basis.

Conference Call Information

Members of Dolby management will lead a conference call open to all interested parties to discuss second quarter fiscal 2026 financial results for Dolby Laboratories at 2:00 p.m. PT (5:00 p.m. ET) on Thursday, April 30, 2026.

The conference call can be accessed by registering online at Dolby Laboratories Q2 Fiscal Year 2026 Financial Results, at which time registrants will receive dial-in information as well as a conference ID.

A live audio webcast of the conference call will be available at http://investor.dolby.com where it will be archived for one year.

Non-GAAP Financial Information

To supplement Dolby’s financial statements presented on a GAAP basis, Dolby management uses, and Dolby provides to investors, certain non-GAAP financial measures as an additional tool to evaluate Dolby’s operating results in a manner that focuses on what Dolby’s management believes to be its ongoing business operations and performance. We believe these non-GAAP financial measures are also helpful to investors in enabling comparability of operating performance between periods and among peer companies. Additionally, Dolby’s management regularly uses our supplemental non-GAAP financial measures to make operating decisions, for planning and forecasting purposes and determining bonus payouts. Specifically, Dolby excludes the following as adjustments from one or more of its non-GAAP financial measures:

Stock-based compensation expense: Stock-based compensation, unlike cash-based compensation, utilizes subjective assumptions in the methodologies used to value the various stock-based award types that Dolby grants. These assumptions may differ from those used by other companies. To facilitate more meaningful comparisons between its underlying operating results and those of other companies, Dolby excludes stock-based compensation expense.

Amortization of acquisition-related intangibles: Dolby amortizes intangible assets acquired in connection with business combinations. These intangible assets consist of patents and technology, customer relationships, and other intangibles. Dolby records amortization charges relating to these intangible assets in its GAAP financial statements, and Dolby views these charges as items arising from pre-acquisition activities that are determined by the timing and valuation of its acquisitions. As these amortization charges do not directly correlate to its operations during any particular period, Dolby excludes these charges to facilitate an evaluation of its current operating performance and comparisons to its past operating results. In addition, while amortization expense of acquisition-related intangible assets is excluded from Non-GAAP Net Income, the revenue generated from those assets is not excluded.

Restructuring charges or credits: Restructuring charges are costs associated with restructuring plans and primarily relate to costs associated with exit or disposal activities, employee severance benefits, and asset impairments. Dolby excludes restructuring costs, including any adjustments to charges recorded in prior periods (which may be credits), as Dolby believes that these costs are not representative of its normal operating activities and therefore, excluding these amounts enables a more effective comparison of its past operating performance and to that of other companies.

Income tax adjustments: The income tax effects of the aforementioned non-GAAP adjustments do not directly correlate to its operating performance so Dolby believes that excluding such income tax effects provides a more meaningful view of its underlying operating results to management and investors.

Using the aforementioned adjustments, Dolby provides various non-GAAP financial measures including, but not limited to: non-GAAP net income, non-GAAP diluted earnings per share, non-GAAP gross margin, non-GAAP operating expenses, non-GAAP operating margin, and non-GAAP effective tax rate. Dolby’s management believes it is useful for itself and investors to review both GAAP and non-GAAP measures to assess the performance of Dolby’s business, including as a means to evaluate period-to-period comparisons. Dolby’s management does not itself, nor does it suggest that investors should, consider non-GAAP financial measures in isolation from, superior to, or as a substitute for, financial information prepared in accordance with GAAP. Whenever Dolby uses non-GAAP financial measures, it provides a reconciliation of the non-GAAP financial measures to the most closely applicable GAAP financial measures. Investors are encouraged to review the related GAAP financial measures and the reconciliation of these non-GAAP financial measures to their most directly comparable GAAP financial measures as detailed above and below. Investors are also encouraged to review Dolby’s GAAP financial statements as reported in its US Securities and Exchange Commission (SEC) filings. A reconciliation between GAAP and non-GAAP financial measures is provided at the end of this press release and on the Dolby investor relations website, http://investor.dolby.com

Forward-Looking Statements

Certain statements in this press release and in our earnings calls, including, but not limited to, expected financial results for the third quarter of fiscal 2026 and full year fiscal 2026, Dolby’s ability to expand existing business, navigate challenging periods, pursue its long-term growth opportunities, and advance its other long-term objectives are “forward-looking statements” that inherently involve substantial risks and uncertainties. These forward-looking statements are based on management’s current expectations, and as a result of certain risks and uncertainties, actual results may differ materially from those provided. The following important factors, without limitation, could cause actual results to differ materially from those in the forward-looking statements: the potential impacts of economic conditions on Dolby’s business operations, financial results, and financial position (including the impact to Dolby partners and disruption of the supply chain and delays in shipments of consumer products; the level at which Dolby technologies are incorporated into products and the consumer demand for such products; delays in the development and release of new products or services that contain Dolby technologies; delays in royalty reporting or delinquent payment by partners or licensees; lengthening sales cycles; the impact to the overall cinema market including adverse impact to Dolby’s revenue recognized on box-office sales and demand for cinema products and services; and macroeconomic conditions that affect discretionary spending and access to products that contain Dolby technologies); risks associated with geopolitical issues and international conflicts; risks associated with trends in the markets in which Dolby operates, including the broadcast, mobile, consumer electronics, PC, and other markets; the loss of, or reduction in sales by, a key customer, partner, or licensee; pricing pressures; risks relating to changing trends in the way that content is distributed and consumed; risks relating to conducting business internationally, including trade restrictions and changes in diplomatic or trade relationships; risks relating to maintaining patent coverage; the timing of Dolby’s receipt of royalty reports and payments from its licensees, including recoveries; changes in tax regulations; timing of revenue recognition under licensing agreements and other contractual arrangements; Dolby’s ability to develop, maintain, and strengthen relationships with industry participants; Dolby’s ability to develop and deliver innovative products and technologies in response to new and growing markets; competitive risks; risks associated with conducting business in countries that have historically limited recognition and enforcement of intellectual property and contractual rights; risks associated with the health of the motion picture and cinema industries generally; Dolby’s ability to increase its revenue streams and to expand its business generally, and to continue to expand its business beyond its current technology offerings; risks associated with acquiring and successfully integrating businesses or technologies; and other risks detailed in Dolby’s SEC filings and reports, including the risks identified under the section captioned “Risk Factors” in its Quarterly Report on Form 10-Q filed on or around the date hereof. Dolby may not actually achieve the plans, intentions, or expectations disclosed in its forward-looking statements. Forward-looking statements are based upon information available to us as of the date of such statements, and while Dolby believes such information forms a reasonable basis for such statements, such information may be limited or incomplete. These statements are inherently uncertain and investors are cautioned not to unduly rely upon these statements. Except as required by law, Dolby disclaims any obligation to update information contained in these forward-looking statements whether as a result of new information, future events, or otherwise.

About Dolby

Dolby Laboratories (NYSE: DLB) is a world leader in immersive entertainment. From movies and TV, to music, sports, gaming, and beyond, Dolby transforms the science of sight and sound into spectacular experiences for billions of people worldwide across all their favorite devices. We partner with artists, storytellers, and the brands you love to transform entertainment and digital experiences through groundbreaking innovations like Dolby Atmos, Dolby Vision, Dolby Cinema, and Dolby OptiView.

Dolby, Dolby Atmos, Dolby Vision, Dolby Cinema, Dolby OptiView, and the double-D symbol are among the registered and unregistered trademarks of Dolby Laboratories in the United States and/or other countries. Other trademarks remain the property of their respective owners.

DOLBY LABORATORIES, INC.

INTERIM CONDENSED CONSOLIDATED STATEMENTS OF OPERATIONS

(in thousands, except per share amounts; unaudited)

Fiscal Quarter Ended

Fiscal Year-To-Date Ended

March 27,
2026

March 28,
2025

March 27,
2026

March 28,
2025

Revenue:

  Licensing

$          372,245

$          346,006

$          692,016

$          676,485

  Products and services

23,385

23,555

50,320

50,075

Total revenue

395,630

369,561

742,336

726,560

Cost of revenue:

  Cost of licensing

24,043

19,685

44,805

40,795

  Cost of products and services

20,688

16,152

43,134

35,816

Total cost of revenue

44,731

35,837

87,939

76,611

Gross profit

350,899

333,724

654,397

649,949

Operating expenses:

  Research and development

63,651

61,707

132,728

128,345

  Sales and marketing

96,163

89,629

187,715

184,028

  General and administrative

75,955

70,415

146,198

140,507

  Restructuring charges

2,184

4,210

12,650

9,426

Total operating expenses

237,953

225,961

479,291

462,306

Operating income

112,946

107,763

175,106

187,643

Other income/(expense):

  Interest income/(expense), net

5,024

3,559

9,142

6,205

  Other income, net

1,729

8,928

7,053

12,453

Total other income

6,753

12,487

16,195

18,658

Income before income taxes

119,699

120,250

191,301

206,301

Provision for income taxes

(24,245)

(28,024)

(42,166)

(46,005)

Net income including noncontrolling interest

95,454

92,226

149,135

160,296

Less: net income attributable to noncontrolling interest

(539)

(433)

(893)

(681)

Net income attributable to Dolby Laboratories, Inc.

$           94,915

$           91,793

$          148,242

$          159,615

Net income per share:

Basic

$              1.00

$              0.95

$              1.55

$              1.66

Diluted

$              0.99

$              0.94

$              1.54

$              1.64

Weighted-average shares outstanding:

Basic

95,218

96,329

95,342

95,972

Diluted

95,515

97,471

96,273

97,581


DOLBY LABORATORIES, INC.

INTERIM CONDENSED CONSOLIDATED BALANCE SHEETS

(in thousands; unaudited)

March 27,
2026

September 26,
2025

ASSETS

Current assets:

Cash and cash equivalents

$          594,282

$          701,893

Restricted cash

79,523

91,468

Short-term investments

460

703

Accounts receivable, net

391,293

331,096

Contract assets, net

238,924

180,804

Inventories, net

31,929

30,424

Prepaid expenses and other current assets

78,298

51,873

Total current assets

1,414,709

1,388,261

Long-term investments

81,220

80,205

Property, plant, and equipment, net

461,841

470,608

Operating lease right-of-use assets

44,759

33,204

Goodwill and intangible assets, net

919,378

926,957

Deferred taxes

209,321

214,361

Other non-current assets

118,266

114,164

Total assets

$        3,249,494

$        3,227,760

LIABILITIES AND STOCKHOLDERS’ EQUITY

Current liabilities:

Accounts payable

$           20,688

$           17,840

Accrued liabilities

405,200

369,256

Income taxes payable

15

8,928

Contract liabilities

38,837

31,382

Operating lease liabilities

9,866

10,384

Total current liabilities

474,606

437,790

Non-current contract liabilities

24,084

29,687

Non-current operating lease liabilities

39,826

28,494

Other non-current liabilities

83,846

99,843

Total liabilities

622,362

595,814

Stockholders’ equity:

Class A common stock

53

54

Class B common stock

40

40

Retained earnings

2,630,175

2,634,980

Accumulated other comprehensive loss

(12,276)

(12,517)

Total stockholders’ equity – Dolby Laboratories, Inc.

2,617,992

2,622,557

Noncontrolling interest

9,140

9,389

Total stockholders’ equity

2,627,132

2,631,946

Total liabilities and stockholders’ equity

$        3,249,494

$        3,227,760


DOLBY LABORATORIES, INC.

INTERIM CONDENSED CONSOLIDATED STATEMENTS OF CASH FLOWS

(in thousands; unaudited)

Fiscal Year-To-Date Ended

March 27,
2026

March 28,
2025

Operating activities:

Net income including noncontrolling interest

$          149,135

$          160,296

Adjustments to reconcile net income to net cash provided by operating activities:

Depreciation and amortization

48,242

43,899

Stock-based compensation

67,919

66,734

Amortization of operating lease right-of-use assets

5,417

5,725

Provision for credit losses

3,691

1,967

Deferred income taxes

5,212

(3,741)

Share of net income of equity method investees, net of cash distributions

(1,933)

(1,325)

Other non-cash items affecting net income

(1,741)

(443)

Changes in operating assets and liabilities:

Accounts receivable, net

(104,083)

(420)

Contract assets, net

(60,474)

(32,864)

Inventories

3,853

(1,155)

Operating lease right-of-use assets

(17,177)

(1,608)

Prepaid expenses and other assets

(33,842)

26,577

Accounts payable and accrued liabilities

82,873

27,267

Income taxes, net

(6,067)

5,906

Contract liabilities

7,478

3,282

Operating lease liabilities

11,029

(5,682)

Other non-current liabilities

(12,227)

(12,739)

Net cash provided by operating activities

147,305

281,676

Investing activities:

Proceeds from sales of marketable securities

15,911

Proceeds from sale of assets held for sale

16,881

Proceeds from sale of intangible assets

6,623

Purchases of property, plant, and equipment

(13,690)

(13,676)

Business combinations, net of cash and restricted cash acquired, and other related payments

(1,362)

Purchases of intangible assets

(37,775)

Net cash provided by/(used in) investing activities

(44,842)

17,754

Financing activities:

Proceeds from issuance of common stock

15,293

26,124

Repurchase of common stock

(135,004)

(49,999)

Payment of excise tax on repurchase of common stock

(261)

Payment of cash dividend

(68,674)

(63,377)

Distributions to noncontrolling interest

(1,106)

(981)

Shares repurchased for tax withholdings on vesting of restricted stock

(32,222)

(33,950)

Net cash used in financing activities

(221,713)

(122,444)

Effect of foreign exchange rate changes on cash, cash equivalents, and restricted cash

(306)

(4,396)

Net increase/(decrease) in cash, cash equivalents, and restricted cash

(119,556)

172,590

Cash, cash equivalents, and restricted cash at beginning of period

793,361

577,752

Cash, cash equivalents, and restricted cash at end of period

$          673,805

$          750,342


Licensing Revenue by Market

(unaudited)

The following table presents the composition of our licensing revenue and percentage of total licensing revenue for all periods presented (in thousands, except percentage amounts):

Fiscal Quarter Ended

Fiscal Year-To-Date Ended

Market

March 27, 2026

March 28, 2025

March 27, 2026

March 28, 2025

Broadcast

$  119,199

32 %

$    94,249

27 %

$  219,462

32 %

$  210,011

31 %

Mobile

94,240

25 %

100,123

29 %

169,189

24 %

161,647

24 %

CE

40,949

11 %

38,140

11 %

86,551

13 %

87,597

13 %

PC

59,463

16 %

58,402

17 %

88,180

13 %

89,658

13 %

Other

58,394

16 %

55,092

16 %

128,634

18 %

127,572

19 %

Total licensing revenue

$  372,245

100 %

$  346,006

100 %

$  692,016

100 %

$  676,485

100 %


GAAP to Non-GAAP Reconciliations

(unaudited)

The following tables present Dolby’s GAAP financial measures reconciled to the non-GAAP financial measures included in this release for the
second quarters of fiscal 2026 and fiscal 2025:

Net income:

Fiscal Quarter Ended

(in thousands)

March 27,
2026

March 28,
2025

GAAP net income attributable to Dolby Laboratories, Inc.

$       94,915

$       91,793

Stock-based compensation (1)

30,708

30,664

Amortization of acquisition-related intangibles (2)

9,713

10,078

Restructuring charges

2,184

4,210

Income tax adjustments

(6,190)

(6,017)

Non-GAAP net income attributable to Dolby Laboratories, Inc.

$     131,330

$     130,728

(1) Stock-based compensation included in above line items:

Cost of products and services

$            424

$            414

Research and development

9,807

9,043

Sales and marketing

10,216

10,640

General and administrative

10,261

10,567

(2) Amortization of acquisition-related intangibles included in above line items:

Cost of licensing

$        6,589

$        6,720

Cost of products and services

772

728

Sales and marketing

356

317

General and administrative

1,555

1,872

Other income, net

441

441

Diluted earnings per share:

Fiscal Quarter Ended

March 27,
2026

March 28,
2025

GAAP diluted earnings per share

$         0.99

$         0.94

Stock-based compensation

0.32

0.32

Amortization of acquisition-related intangibles

0.10

0.10

Restructuring charges

0.02

0.04

Income tax adjustments

(0.06)

(0.06)

Non-GAAP diluted earnings per share

$         1.37

$         1.34

Weighted-average shares outstanding – diluted (in thousands)

95,515

97,471


The following tables present a reconciliation between GAAP and non-GAAP versions of the estimated financial measures for the third quarter of
fiscal 2026 and full year fiscal 2026 included in this release:

Gross margin:

Q3 2026

Fiscal 2026

GAAP gross margin

86.0 %

88.0 %

Stock-based compensation

0.1 %

0.1 %

Amortization of acquisition-related intangibles

1.9 %

1.9 %

Non-GAAP gross margin

88.0 %

90.0 %

Operating expenses (in millions):

Q3 2026

Fiscal 2026

GAAP operating expenses (low – high end of range)

$235 – $245

$930 – $950

Stock-based compensation

(32)

(128)

Amortization of acquisition-related intangibles

(3)

(9)

Restructuring charges

(13)

Non-GAAP operating expenses (low – high end of range)

$200 – $210

$780 – $800

Operating margin:

Fiscal 2026

GAAP operating margin

21% +/-

Stock-based compensation

9 %

Amortization of acquisition-related intangibles

3 %

Restructuring charges

1 %

Non-GAAP operating margin

34% +/-

Effective tax rate:

Q3 2026

Fiscal 2026

GAAP effective tax rate

23.0 %

23.0 %

Stock-based compensation (low – high end of range)

(2%) – 1%

(2%) – 0%

Amortization of acquisition-related intangibles (low – high end of range)

(1%) – 0%

(1%) – 0%

Non-GAAP effective tax rate

21.0 %

20.0 %

Diluted earnings per share:

Q3 2026

Fiscal 2026

Low

High

Low

High

GAAP diluted earnings per share (low – high end of range)

$           0.19

$         0.34

$           2.66

$         2.81

Stock-based compensation

0.34

0.34

1.34

1.34

Amortization of acquisition-related intangibles

0.11

0.11

0.43

0.43

Restructuring charges

0.13

0.13

Income tax adjustments

(0.08)

(0.08)

(0.26)

(0.26)

Non-GAAP diluted earnings per share (low – high end of range)

$           0.56

$         0.71

$           4.30

$         4.45

Weighted-average shares outstanding – diluted (in thousands)

95,000

95,000

95,700

95,700

Investor Contact:
Peter Goldmacher
415-254-7415
peter.goldmacher@dolby.com 

Media Contact:
media@dolby.com


View original content to download multimedia:https://www.prnewswire.com/news-releases/dolby-laboratories-reports-second-quarter-2026-financial-results-302759263.html

SOURCE Dolby Laboratories, Inc.

Continue Reading

Trending