Connect with us

Technology

JCET Revenues of Q3 2024 and Q3 YTD 2024 Hit New Record High, Q3 Net Profit after Deducting Non-Recurring Items Increased by 19.5% Year-on-Year

Published

on

Q3 2024 Financial Highlights:

Revenue was RMB 9.49 billion, an increase of 14.9% year-on-year and 9.8% quarter-on-quarter, a record quarter in the company’s history.Net profit attributable to owners of the parent was RMB 0.46 billion. Net profit attributable to owners of the parent after deducting non-recurring gains and losses was RMB 0.44 billion, an increase of 19.5% year-on-year.

Q3 YTD 2024 Financial Highlights:

Revenue was RMB 24.98 billion, an increase of 22.3% year-on-year, a record high in the company’s history.Net profit attributable to owners of the parent was RMB 1.08 billion, an increase of 10.6% year-on-year.Earnings per share was RMB 0.60, as compared to RMB 0.54 in Q3 YTD 2023.

SHANGHAI, Oct. 25, 2024 /PRNewswire/ — Today, JCET Group (SSE: 600584), a leading global provider of integrated circuit (IC) back-end manufacturing and technology services, announced its financial results for the third quarter of 2024. The financial report shows that in the third quarter of 2024, JCET achieved revenue of RMB 9.49 billion, an increase of 14.9% year-on-year, a record quarter in the company’s history, and net profit attributable to owners of the parent of RMB 0.46 billion. Net profit attributable to owners of the parent after deducting non-recurring gains and losses was RMB 0.44 billion in Q3 2024, an increase of 19.5% year-on-year. In Q3 YTD 2024, JCET achieved revenue of RMB 24.98 billion, an increase of 22.3% year-on-year, a record high in the company’s history, and net profit attributable to owners of the parent of RMB 1.08 billion, an increase of 10.6% year-on-year.

The operations of JCET factories have rebounded since 2024, and the company’s capacity utilization rate is continuously increasing. In the first three quarters of this year, all business sector recovery has stabilized, and the company’s earlier strategic layout began to contribute incremental growth. In the first three quarters, the revenues of the four major applications, including communications, consumer, computing, and automotive electronics all achieved double-digit year-on-year growth, with communication electronics achieving a significant growth of nearly 40% year-on-year. The company strengthened inventory control and supply chain management to ensure efficient circulation of capital, generating RMB 3.93 billion cash from operations in Q3 YTD 2024, a year-on-year increase of 29.7%.

JCET’s acquisition of 80% equity of SanDisk (Shanghai), a global leading factory for memory chip packaging, has completed. This will further enhance the company’s intelligent manufacturing and expand its market share in the memory and computing electronics. JCET microelectronics microsystem integration high-end manufacturing base has been put into use, providing one-stop IC back-end manufacturing services and addressing global customers’ demand for high-performance chips.

Mr. Li Zheng, CEO of JCET, said, “JCET has actively promoted innovation in advanced packaging technology and capacity layout in recent years. Since the beginning of this year, the company business has continued to rebound, and its revenue in the first three quarters hits a new high in the company’s history. JCET will continue to focus on advanced technology and high value-added markets to support sustainable development.”

For more information, please refer to the JCET Q3 2024 Report. 

CONSOLIDATED BALANCE SHEET (Unaudited)                                                                

RMB in millions

Sep 30, 2024

Dec 31, 2023

ASSETS

Current assets

  Currency funds

9,257

7,325

  Trading financial assets

2,003

2,306

  Derivative financial assets

3

4

  Accounts receivable

5,916

4,185

  Receivables financing

35

38

  Prepayments

133

104

  Other receivables

117

87

  Inventories

4,740

3,195

  Other current assets

514

375

Total current assets

22,718

17,619

Non-current assets

  Long-term receivables

33

33

  Long-term equity investments

826

695

  Other equity investments

434

447

  Investment properties

83

86

  Fixed assets

21,431

18,744

  Construction in progress

2,728

1,053

  Right-of-use assets

515

563

  Intangible assets

745

662

  Goodwill

3,546

2,248

  Long-term prepaid expenses

10

17

  Deferred tax assets

493

364

  Other non-current assets

57

48

Total non-current assets

30,901

24,960

Total assets

53,619

42,579

LIABILITIES AND EQUITY  

Sep 30, 2024

Dec 31, 2023

Current liabilities

  Short-term borrowings

1,187

1,696

  Notes payable

338

223

  Accounts payable

8,143

4,782

  Contract liabilities

316

185

  Employee benefits payable

751

781

  Taxes and surcharges payable

275

167

  Other payables

385

354

  Current portion of long-term liabilities

4,215

1,491

  Other current liabilities

1

3

Total current liabilities

15,611

9,682

Non-current liabilities

  Long-term borrowings

7,331

5,777

  Lease liabilities

504

530

  Long-term payables

833

0

  Long-term employee benefits payable

15

14

  Deferred income

424

384

  Deferred tax liabilities

393

0

  Other non-current liabilities

28

41

Total non-current liabilities

9,528

6,746

Total liabilities

25,139

16,428

Equity

  Paid-in capital

1,789

1,789

  Capital reserves

15,230

15,237

  Accumulated other comprehensive income

410

543

  Specialized reserves

1

0

  Surplus reserves

257

257

  Unappropriated profit

9,137

8,239

Total equity attributable to owners of the parent

26,824

26,065

Minority shareholders

1,656

86

Total equity

28,480

26,151

Total liabilities and equity

53,619

42,579

CONSOLIDATED INCOME STATEMENT (Unaudited)                                                                                                     

RMB in millions, except share data

Three months ended

Nine months ended

Sep 30, 2024

Sep 30, 2023

Sep 30, 2024

Sep 30, 2023

Revenue

9,491

8,257

24,978

20,430

Less: Cost of sales

8,331

7,071

21,748

17,596

          Taxes and surcharges

21

36

56

82

          Selling expenses

69

55

187

155

          Administrative expenses

100

190

533

536

          Research and development expenses

413

413

1,232

1,082

          Finance expenses

119

26

108

77

            Including: Interest expenses

105

84

297

215

                     Interest income

69

35

210

70

Add: Other income

39

103

125

176

         Investment income / (loss)

0

(12)

(14)

(34)

            Including: Income / (loss) from investments in associates and joint ventures

(14)

(12)

(43)

(34)

         Gain / (loss) on changes in fair value of financial assets/liabilities 

3

17

(2)

62

         Credit impairment (loss is expressed by “-“)

6

(2)

(1)

(3)

         Asset impairment (loss is expressed by “-“)

(13)

(26)

(51)

(26)

         Gain / (loss) on disposal of assets 

(2)

5

3

21

Operating profit / (loss)

471

551

1,174

1,098

Add: Non-operating income

0

0

1

3

Less: Non-operating expenses

1

1

3

5

Profit / (loss) before income taxes

470

550

1,172

1,096

Less: Income tax expenses

16

72

101

122

Net profit / (loss) 

454

478

1,071

974

Classified by continuity of operations

  Profit / (loss) from continuing operations

454

478

1,071

974

Classified by ownership

  Net profit / (loss) attributable to owners of the parent

457

478

1,076

974

  Net profit / (loss) attributable to minority shareholders

(3)

0

(5)

0

Add: Unappropriated profit at beginning of period

8,680

7,293

8,239

7,154

Less: Cash dividends declared

0

0

178

357

Unappropriated profit at end of period (attributable to owners of the parent)

9,137

7,771

9,137

7,771

Other comprehensive income, net of tax

(181)

(70)

(133)

280

Comprehensive income attributable to owners of the parent

(181)

(70)

(133)

280

Comprehensive income not be reclassified to profit or loss

0

(7)

(13)

10

  Remeasurement gains or losses of a defined benefit plan

0

0

0

1

  Change in the fair value of other equity investments

0

(7)

(13)

9

Comprehensive income to be reclassified to profit or loss

(181)

(63)

(120)

270

  Exchange differences of foreign currency financial statements

(181)

(63)

(120)

270

Total comprehensive income

273

867

938

1,254

  Including:

     Total comprehensive income attributable to owners of the parent

276

408

943

1,254

     Total comprehensive income attributable to minority shareholders

(3)

0

(5)

0

Earnings per share

  Basic earnings per share

0.25

0.26

0.60

0.54

  Diluted earnings per share

0.25

0.26

0.60

0.54

CONSOLIDATED CASH FLOW STATEMENT (Unaudited)                                                                                                                                                          

RMB in millions

Three months ended

Nine months ended

Sep 30, 2024

Sep 30, 2023

Sep 30, 2024

Sep 30, 2023

CASH FLOWS FROM OPERATING ACTIVITIES

  Cash receipts from the sale of goods and the rendering of services

9,011

7,574

25,601

20,737

  Receipts of taxes and surcharges refunds

139

52

337

267

  Other cash receipts relating to operating activities

92

126

375

289

Total cash inflows from operating activities

9,242

7,752

26,313

21,293

  Cash payments for goods and services

6,742

5,840

17,996

14,293

  Cash payments to and on behalf of employees

1,198

899

3,446

2,972

  Payments of all types of taxes and surcharges

284

180

573

646

  Other cash payments relating to operating activities

111

221

364

349

Total cash outflows from operating activities

8,335

7,140

22,379

18,260

Net cash flows from operating activities

907

612

3,934

3,033

CASH FLOWS FROM INVESTING ACTIVITIES

  Cash receipts from returns of investments

3,600

3,601

12,650

11,881

  Cash receipts from investment income

15

15

30

68

  Net cash receipts from disposal of fixed assets, intangible assets and other long-term assets

1

99

6

131

Total cash inflows from investing activities

3,616

3,715

12,686

12,080

  Cash payments to acquire fixed assets, intangible assets and other long-term assets

1,219

845

3,089

2,434

  Cash payments for investments

4,000

5,181

12,350

11,161

  Net cash payments for acquisition of subsidiaries and other business units

1,520

0

1,520

0

Total cash outflows from investing activities

6,739

6,026

16,959

13,595

Net cash flows from investing activities

(3,123)

(2,311)

(4,273)

(1,515)

CASH FLOWS FROM FINANCING ACTIVITIES

  Cash proceeds from investments by others

0

32

776

262

      Including: Cash receipts from capital contributions from minority shareholders of subsidiaries

0

0

765

86

  Cash receipts from borrowings

2,050

4,823

5,057

6,487

Total cash inflows from financing activities

2,050

4,855

5,833

6,749

  Cash repayments for debts

1,048

3,723

3,011

5,464

  Cash payments for distribution of dividends or profit and interest expenses

83

78

435

545

  Other cash payments relating to financing activities

21

22

74

69

Total cash outflows from financing activities

1,152

3,823

3,520

6,078

Net cash flows from financing activities

898

1,032

2,313

671

EFFECT OF EXCHANGE RATE CHANGES ON CASH AND CASH EQUIVALENTS

(46)

(7)

(42)

30

NET INCREASE IN CASH AND CASH EQUIVALENTS

(1,364)

(674)

1,932

2,219

Add: Cash and cash equivalents at beginning of period

10,621

5,346

7,325

2,453

CASH AND CASH EQUIVALENTS AT END OF PERIOD

9,257

4,672

9,257

4,672


About JCET Group

JCET Group is the world’s leading integrated-circuit manufacturing and technology services provider, offering a full range of turnkey services that include semiconductor package integration design and characterization, R&D, wafer probe, wafer bumping, package assembly, final test and drop shipment to vendors around the world.

Our comprehensive portfolio covers a wide spectrum of semiconductor applications such as mobile, communication, compute, consumer, automotive, and industrial, through advanced wafer-level packaging, 2.5D/3D, System-in-Package, and reliable flip chip and wire bonding technologies. JCET Group has two R&D centers in China and Korea, eight manufacturing locations in China, Korea, and Singapore, and sales centers around the world, providing close technology collaboration and efficient supply-chain manufacturing to our global customers.

View original content to download multimedia:https://www.prnewswire.com/news-releases/jcet-revenues-of-q3-2024-and-q3-ytd-2024-hit-new-record-high-q3-net-profit-after-deducting-non-recurring-items-increased-by-19-5-year-on-year-302287142.html

SOURCE JCET Group

Continue Reading
Click to comment

Leave a Reply

Your email address will not be published. Required fields are marked *

Technology

HydraForce, Elevāt, and Bosch Rexroth Announce Enhanced Remote OTA Update Capabilities for Off-Highway Equipment

Published

on

By

SEATTLE, July 23, 2026 /PRNewswire/ — Building on their strategic collaboration, HydraForce, a global leader in motion control systems and Elevāt, an industrial IoT and applied AI platform provider, announced a significant advancement in remote machine management.

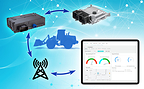
The HydraForce Connected Control Unit (CCU) from Bosch, integrated with Elevāt software, is now capable of providing remote access and performing over-the-air (OTA) updates on Bosch Rexroth BODAS controllers.

This enhanced capability empowers HydraForce and Elevāt customers to streamline operations, reduce downtime, and significantly improve machine performance and serviceability. By leveraging the integrated solution, OEMs can use the Elevāt platform to remotely diagnose issues and deploy critical software updates to the BODAS controllers on their equipment without requiring on-site service personnel.

“The ability to remotely access and update Bosch Rexroth BODAS controllers using the Elevāt platform takes our collaborative vision of bridging hydraulics, electronics, and digital services to the next level,” said Russ Schneidewind, director of business developmentat at HydraForce.  “The cooperation between Elevāt and Bosch Rexroth is directly addressing the industry’s need for complete, future-ready solutions.”

Adam Livesay, co-founder and CEO of Elevāt, commented, “At Elevāt, we believe the future of equipment service is connected, intelligent, and proactive. This collaboration helps OEMs deliver the next generation of service by  accelerating software deployment and enabling faster issue resolution in the field. The addition of remote BODAS controller updates is another key milestone toward a fully integrated ecosystem that simplifies the connection between hardware, software, and digital services—helping manufacturers bring intelligent equipment to market faster while creating new opportunities for recurring customer value.”

HydraForce and Elevāt plan to further their collaboration with additional remote machine management capabilities to be announced in the future.

About HydraForce HydraForce is a global designer and manufacturer of motion control systems, encompassing hydraulic cartridge valves, manifolds and electronic controls for a variety of off-highway industries, including farming, construction, marine, material handling, mining, and forestry. HydraForce was acquired by Bosch Rexroth, becoming a significant part of the Compact Hydraulics Business Unit. Bosch Rexroth and HydraForce combine their presence in complementary regions to provide comprehensive coverage in Europe and North America, while enabling growth in Asia.

About Bosch Rexroth As one of the world’s leading suppliers of drive and control technologies, Bosch Rexroth ensures efficient, powerful and safe movement in machines and systems of any size. The company bundles global application experience in the market segments of Mobile and Industrial Applications as well as Factory Automation. With its intelligent components, customized system solutions, engineering and services, Bosch Rexroth is creating the necessary environment for fully connected applications. Bosch Rexroth offers its customers hydraulics, electric drive and control technology, gear technology and linear motion and assembly technology, including software and interfaces to the Internet of Things. With locations in over 80 countries, around 31,900 associates generated sales revenue of 6.5 billion euros in 2025.  To learn more, please visit www.boschrexroth.com.

About Bosch Having established a presence in North America in 1906, today the Bosch Group employs around 38,000 associates in more than 100 locations in the North American region (as of Dec. 31, 2024). According to preliminary figures, Bosch generated consolidated sales of $18.7 billion in the U.S., Mexico and Canada in 2025. For more information visit www.bosch.us, www.bosch.mx and www.bosch.ca. The Bosch Group is a leading global supplier of technology and services. It employs roughly 412,000 associates worldwide (as of December 31, 2025). According to preliminary figures, the company generated sales of 91 billion euros in 2025. Its operations are divided into four business sectors: Mobility, Industrial Technology, Consumer Goods, and Energy and Building Technology. With its business activities, the company aims to use technology to help shape universal trends such as automation, electrification, digitalization, connectivity, and an orientation to sustainability. In this context, Bosch’s broad diversification across regions and industries strengthens its innovativeness and robustness. Bosch uses its proven expertise in sensor technology, software, and services to offer customers cross-domain solutions from a single source. It also applies its expertise in connectivity and artificial intelligence in order to develop and manufacture user-friendly, sustainable products. With technology that is “Invented for life,” Bosch wants to help improve quality of life and conserve natural resources. The Bosch Group comprises Robert Bosch GmbH and its roughly 490 subsidiary and regional companies in over 60 countries. Including sales and service partners, Bosch’s global manufacturing, engineering, and sales network covers nearly every country in the world. Bosch’s innovative strength is key to the company’s further development. At 136 locations across the globe, Bosch employs some 82,000 associates in research and development. The company was set up in Stuttgart in 1886 by Robert Bosch (1861-1942) as “Workshop for Precision Mechanics and Electrical Engineering.” The special ownership structure of Robert Bosch GmbH guarantees the entrepreneurial freedom of the Bosch Group, making it possible for the company to plan over the long term and to undertake significant upfront investments in the safeguarding of its future. Ninety-four percent of the share capital of Robert Bosch GmbH is held by Robert Bosch Stiftung GmbH, a limited liability company with a charitable purpose. The remaining shares are held by Robert Bosch GmbH and by a company owned by the Bosch family. The majority of voting rights are held by Robert Bosch Industrietreuhand KG. It is entrusted with the task of safeguarding the company’s long-term existence and in particular its financial independence – in line with the mission handed down in the will of the company’s founder, Robert Bosch. Additional information is available online at www.bosch-press.com, www.bosch.com.

About Elevāt Elevāt is a leading industrial IoT and applied AI platform purpose-built for off-highway OEMs. Elevāt enables manufacturers to connect machines, unlock actionable intelligence, and deliver next-generation digital services across the entire equipment lifecycle. Additional information is available online at www.getelevat.com

View original content to download multimedia:https://www.prnewswire.com/news-releases/hydraforce-elevt-and-bosch-rexroth-announce-enhanced-remote-ota-update-capabilities-for-off-highway-equipment-302833060.html

SOURCE Elevat, Inc

Continue Reading

Technology

FutureSports launches as new index provider transforming sports statistics into tradable financial instruments

Published

on

By

Backed by leading financial and sports institutions, firm will leverage partnerships to bring critical new hedging vehicles to sports ecosystem

CHICAGO, July 23, 2026 /PRNewswire/ — FutureSports, the new independent index administrator transforming professional and college sports statistics into rules-based, benchmark financial indexes, today announced its emergence from stealth. Backed by a broad range of leading financial and sports institutions, FutureSports in the coming months will announce a series of partnerships, collaborations and products that will bring significant new risk management and trading opportunities to the massive ecosystem supporting the most popular sports.

FutureSports previously raised a seed investment round co-led by Marquee Ventures, spun out of the ownership group of the Chicago Cubs. Major financial industry leaders joined the round, including CME Ventures (the corporate venture capital division of CME Group), Robinhood Markets, Inc., WEDBUSH and DRW Special Investments (an investment arm of DRW). Other investors include Motivate VC, Phoenix Capital Ventures, and John and Linda Henry (Fenway Sports Group).

The company also announced the addition of industry experts to its board of directors, including Chairman Mark Wassersug, longtime Chief Operating & Information Officer of Intercontinental Exchange (ICE); Tim McCourt, Senior Managing Director, Global Head of Equity, FX, and Alternative Products at CME Group, and Erik Hammer, Managing Partner at Marquee Ventures.

The firm will soon unveil its first series of exclusive partnerships with major sports leagues, paving the way for institutional investors and companies in and around the sports industry to manage their risk in an unprecedented fashion and participate in regulated, tradable, broad-based index futures contracts based on team and athlete statistical performance. FutureSports creates rules-based financial indexes, known as FutureSports Performance Indexes (FSPI), that accurately represent the performance of teams and athletes in prominent sports leagues. By utilizing transparent, rules-based methodologies based on officially reported statistical outcomes, the company creates continuous values designed to underpin tradable financial products, such as listed derivatives, exchange-traded funds (ETFs) and over-the-counter (OTC) swaps.

Potential market participants will include league broadcasting partners, team and athlete sponsors and endorsers, insurers, stadium owners and operators, private equity investors, lenders, and apparel manufacturers. Asset managers, pension funds and professional trading firms are expected to participate in the contracts and contribute to liquidity in this new uncorrelated asset class. Retail investors will also be able to participate in the first-of-their-kind trading vehicles, which the company expects to capture the interest of sophisticated traders looking for more traditional financial trading instruments

Leigh Taylforth, FutureSports Co-Founder, said: “The global sporting industry generates $650 billion a year, yet there has been no liquid, robust opportunity to hedge the extensive and varied industry risks that range from weather events, to injuries, to unanticipated behavior issues and more. That is about to change. We’ve been truly gratified to see the interest our business has generated within the sports and sports-adjacent industries and the quality of investors we have attracted already.”

Rhett Dinsdale, FutureSports Co-Founder, said: “Up until today, we have been operating in stealth mode while developing our products and establishing key relationships that we expect to be fundamental to our success as we move forward. The recent rise in popularity of prediction markets has only reinforced the concept we created several years ago, that sports as an asset class has huge utility within the sports and entertainment industries, with indexes serving as key institutional instruments to manage risk. What is sorely needed is the type of reliable data and financial instruments that institutional investors have leveraged for so long within the regulated derivatives industry, and we’re excited to bring these to market.”

The Executive team includes Co-Founders Taylforth and Dinsdale, who each have more than 20 years of experience in derivatives trading for market makers, investment banks and hedge funds, along with:

Dave Abbott, Chief Technology Officer – formerly Managing Director at Sportradar;Steve Byrd, Head of Partnerships – formerly Chief Operating Officer (COO) at STATS LLC & Chief Commercial Officer at Sportradar US;Jodie Gunzberg, Head of Index Services – formerly Managing Director at S&P Dow Jones Indices, Morgan Stanley & CoinDesk;Tom Jenkins, Head of Business Development – formerly Head of Index Partnerships & Strategy at FTSE Russell;Josh Kravitt, Head of Operations – formerly Director at CME Ventures;Sunny Modi, Head of Product – formerly Head of BI at Ardent Leisure Group;Mike Philipp, Chief Legal & Strategy Officer – formerly partner at Morgan, Lewis & Bockius LLP;Charlie Thornton, Chief Regulatory Affairs Officer – formerly Chief of Staff and COO at the U.S. Commodity Futures Trading Commission (CFTC).

About FutureSports

Under development since 2022 and launched in 2026, Chicago-based FutureSports has created a proprietary index methodology for measuring on-field, on-ice and on-court performance for a range of professional sporting teams and athletes. Partnering with many of the most recognizable sports leagues and financial market participants, FutureSports transforms live, play-by-play statistical data into rules-based, benchmark indexes that may be referenced by exchange-listed financial products. The indexes are designed to serve the same benchmarking function as the leading equity, commodity and fixed income indexes utilized every day across major global exchanges to track performance and hedge risk in the financial markets. For more information, visit www.futuresports.com.


View original content to download multimedia:https://www.prnewswire.com/news-releases/futuresports-launches-as-new-index-provider-transforming-sports-statistics-into-tradable-financial-instruments-302832829.html

SOURCE FutureSports

Continue Reading

Technology

Capital Group Canada Launches Three Active Equity ETFs on TSX

Published

on

By

The ETF suite now includes five active equity ETFs and two active fixed income ETFs designed to sit at the core of investment portfolios

TORONTO, July 23, 2026 /CNW/ — Capital International Asset Management (Canada), Inc. (“Capital Group Canada”) has launched three new active exchange-traded funds (ETFs) that begin trading on the Toronto Stock Exchange (TSX) today. The three equity strategies are designed to give options for investors looking to diversify their portfolios with non-domestic exposures including U.S., international and developed market securities.  

The new active ETFs are:

CAPU – Capital Group U.S. Equity Select ETF (Canada): Seeks long-term growth of capital and income through investments primarily in common stocks of U.S. issuers.CAPN – Capital Group International Developed Equity Select ETF (Canada): Seeks to provide prudent growth of capital through investments primarily in equity securities of issuers in developed markets outside North America. CAPQ – Capital Group Global Developed Equity Select ETF (Canada): Seeks to provide prudent growth of capital through investments primarily in equity securities of issuers in developed markets.

“As demand for ETFs continues to grow, our expanded lineup gives investors more ways to access Capital Group’s distinctive active investment approach, including our deep research capabilities and multiple portfolio manager system,” said Rick Headrick, president of Capital Group Canada. “As one of the world’s largest active investment managers with over 90 years of experience, we are able to share the benefits of our global scale and offer competitively priced active ETFs designed to sit at the core of an investor’s portfolio.”

“Clients tell us they are looking beyond borders for opportunities to build diversified portfolios,” said Angela Shim, head of product and development at Capital Group Canada. “The three equity strategies expand Capital Group Canada’s core offerings in U.S., international, and global equities, giving investors flexible solutions that can help them navigate global markets and stay focused on their long-term investment goals.”

The three ETFs closed their initial offering of units on July 22, 2026.

The additions expand Capital Group Canada’s ETF lineup to seven, building on a prior launch of two equity and two fixed income ETFs. Details of Capital Group Canada’s full suite of active ETFs can be found here.

About Capital Group

Capital International Asset Management (Canada), Inc. is part of Capital Group, a global investment management firm originating in Los Angeles, California. As Capital Group approaches its 100th anniversary in 2031, its long-term strategy remains firmly rooted in its mission to improve people’s lives through successful investing. With over 9,000 associates and 34 offices around the world, Capital Group manages US$3.6 trillion in assets for millions of wealth management and institutional clients around the world*.

*As of June 30, 2026.

For more information, visit: www.capitalgroup.com/ca/en

SOURCE Capital Group Canada

Continue Reading

Trending