Technology
Noise Detection and Monitoring Market to Grow by USD 7.19 Billion (2024-2028) as New Product Launches Drive Revenue; AI-Powered Market Evolution Report – Technavio
Published
1 year agoon
By
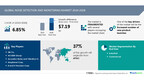
NEW YORK, Oct. 30, 2024 /PRNewswire/ — Report on how AI is driving market transformation – The global noise detection and monitoring market size is estimated to grow by USD 7.19 billion from 2024-2028, according to Technavio. The market is estimated to grow at a CAGR of 6.85% during the forecast period. Increased number of new product launches is driving market growth, with a trend towards integration of wireless connectivity in noise detection and monitoring devices. However, data privacy and security concerns poses a challenge. Key market players include 3M Co., ACOEM Group, Acoustics Noise and Vibration Ltd, Amphenol Corp., B and K Precision Corp., Bruel and Kjaer, Castle Group Ltd., CESVA INSTRUMENTS SLU, Cisco Systems Inc., EXAIR LLC, Honeywell International Inc., HT Italia SrL, Instrumex, NTi Audio AG, PCE Holding GmbH, Pulsar Instruments Plc, Sauermann Group, SINUS Messtechnik GmbH, SVANTEK, and Testo SE and Co. KGaA.
AI-Powered Market Evolution Insights. Our comprehensive market report ready with the latest trends, growth opportunities, and strategic analysis- View your snapshot now
Forecast period
2024-2028
Base Year
2023
Historic Data
2018 – 2022
Segment Covered
End-user (Industrial and Commercial), Component (Hardware and Software), and Geography (North America, APAC, Europe, South America, and Middle East and Africa)
Region Covered
North America, APAC, Europe, South America, and Middle East and Africa
Key companies profiled
3M Co., ACOEM Group, Acoustics Noise and Vibration Ltd, Amphenol Corp., B and K Precision Corp., Bruel and Kjaer, Castle Group Ltd., CESVA INSTRUMENTS SLU, Cisco Systems Inc., EXAIR LLC, Honeywell International Inc., HT Italia SrL, Instrumex, NTi Audio AG, PCE Holding GmbH, Pulsar Instruments Plc, Sauermann Group, SINUS Messtechnik GmbH, SVANTEK, and Testo SE and Co. KGaA
Key Market Trends Fueling Growth
Wireless and portable noise detection and monitoring solutions provide businesses with greater flexibility in deploying devices at various locations, including remote or temporary sites, without the need for extensive wiring or infrastructure. These solutions require minimal infrastructure investments, reducing installation costs, and offer scalability to expand monitoring networks as needed. Real-time monitoring enables prompt action in critical situations, such as occupational safety or regulatory compliance. Portable devices are user-friendly and accessible, catering to businesses seeking easy-to-use, on-the-go solutions. The rising demand for wireless and portable noise detection and monitoring devices is significantly driving the growth of the global market.
The Noise Detection and Monitoring market is experiencing significant growth due to rising sound pollution levels in both commercial and residential areas. Medium-term and long-term monitoring solutions are in high demand, with sound level meters and noise dosimeters being popular choices. WIFI and Ethernet connectivity enable real-time data transmission for effective noise management. Battery-based portable noise monitors offer flexibility. Noise Pollution negatively impacts human-health, leading to heart diseases, cardiovascular problems, cognitive impairment, stress, diabetes, anxiety, and depression, among other chronic diseases. Regulatory acts mandate noise monitoring in various sectors, including the health sector and urbanization. Noise Emissions from industries, traffic, and construction sites require continuous monitoring. Smart City projects prioritize noise reduction as part of their Corporate Responsibility. Cost of implementation and integration difficulties are challenges, but the benefits to human-health and the environment outweigh the costs. Component suppliers focus on hardware and software innovations for building acoustics and portable noise monitoring. Standardization efforts are ongoing to ensure interoperability and accuracy. Applications in healthcare and wildlife conservation continue to expand.
Insights on how AI is driving innovation, efficiency, and market growth- Request Sample!
Market Challenges
The noise detection and monitoring market is witnessing significant growth due to the increasing use of Internet of Things (IoT) and connectivity in noise detection devices. However, ensuring data privacy and protection against cyber threats is crucial for companies offering these devices. Noise detection devices generate vast amounts of audio data, which must be processed, analyzed, and interpreted using advanced software. This data may inadvertently capture conversations or other sensitive personal information, raising concerns about unauthorized access or misuse. Moreover, some noise detection systems can identify individuals or specific devices based on their unique noise patterns, potentially leading to privacy breaches. To mitigate these risks, companies must implement data security measures and comply with relevant data protection regulations. By addressing these concerns, the noise detection and monitoring market can continue to grow and provide valuable insights into noise levels, patterns, and sources.The Noise Monitoring Industry is witnessing significant growth due to increasing concerns over sound pollution from various sources like machines, speakers, horns, and music systems. Challenges such as environmental impact, occupational safety, urbanization, and noise emissions call for effective noise detection and monitoring solutions. Smart City projects are driving the market, with corporate responsibility playing a crucial role. However, cost of implementation and integration difficulties pose challenges. Portable noise monitoring solutions, including hardware and software, are gaining popularity due to their flexibility. Core competencies of key players include building acoustics, sampling method, precision type, connectivity, and solutions. Component suppliers provide essential components like microphones and sound level meters. Alliances, directories, databases, and subsegments like permanent and short-term monitoring contribute to the market’s growth. Limited standardization and component availability are key issues. Advanced technologies like artificial neural networks and sound level meters with wind noise suppressors enhance precision. Dosimeters and sound level meters are essential tools for human health and wildlife protection. The market encompasses a wide range of applications, from healthcare to urban planning.
Insights into how AI is reshaping industries and driving growth- Download a Sample Report
Segment Overview
This noise detection and monitoring market report extensively covers market segmentation by
End-user1.1 Industrial1.2 CommercialComponent2.1 Hardware2.2 SoftwareGeography3.1 North America3.2 APAC3.3 Europe3.4 South America3.5 Middle East and Africa
1.1 Industrial- The global noise detection and monitoring market caters to various industries, with significant demand coming from manufacturing, oil and gas, mining, construction, and aerospace sectors. These industries have large workforces exposed to loud noises from tools like drills, chainsaws, detonators, and pneumatics. Prolonged exposure to these high-decibel environments can lead to permanent hearing loss. In response, employers provide PPE and monitor noise levels to adhere to safety regulations. The manufacturing industry, in particular, accounts for a large share of the market due to its noisy tasks such as grinding, blasting, drilling, hammering, drop forging, and crushing. To address this issue, vendors offer innovative solutions like Honeywell’s in-ear dosimetry system, which measures noise levels reaching the eardrum for real-time tracking and documentation of potential hearing loss. This focus on worker safety and regulatory compliance is expected to fuel the growth of the global noise detection and monitoring market during the forecast period.
Download complimentary Sample Report to gain insights into AI’s impact on market dynamics, emerging trends, and future opportunities- including forecast (2024-2028) and historic data (2018 – 2022)
Research Analysis
The Noise Detection and Monitoring Market encompasses solutions that identify and measure noise levels in various environments to mitigate their adverse impacts. Driven by growing concerns over Environmental Impact and Occupational Safety, this industry is witnessing significant growth due to Urbanization and increasing Noise Emissions from machines, speakers, music systems, horns, and other devices. Smart City projects are integrating noise monitoring systems to ensure a livable urban environment. Corporate Responsibility and applications in Healthcare are also fueling the demand for accurate and precise noise monitoring solutions. However, the cost of implementation and integration difficulties pose challenges to the industry’s growth. Limited standardization and sampling methods also impact the market’s expansion. Core competencies of key players include connectivity, solution offerings, and alliances. The noise monitoring industry aims to protect human health and wildlife from the detrimental effects of noise pollution.
Market Research Overview
The Noise Detection and Monitoring Market encompasses solutions and technologies designed to measure and manage noise emissions, with a focus on Environmental Impact and Occupational Safety. Urbanization and the resulting increase in sound pollution from machines, speakers, music systems, horns, and other devices have driven demand for noise monitoring tools. Smart City projects prioritize noise monitoring as part of their corporate responsibility, integrating hardware and software solutions for real-time data collection and analysis. Components include portable and fixed noise monitoring systems, sound level meters, dosimeters, microphones, and wind noise suppressors. Precision types range from sound level meters to artificial neural networks. Connectivity options include WIFI and Ethernet, with battery-based and commercial or residential applications. Subsegments include building acoustics, sampling methods, and different monitoring durations such as short-term, medium-term, and long-term. Applications extend to healthcare, where noise pollution is linked to negative impacts on human health, including heart diseases, cardiovascular problems, cognitive impairment, stress, diabetes, anxiety, and depression. Despite advancements, challenges include cost of implementation, integration difficulties, and limited standardization. Alliances, directories, and databases facilitate collaboration and knowledge sharing within the noise monitoring industry. Regulatory acts govern noise levels and set standards for noise monitoring tools.
Table of Contents:
1 Executive Summary
2 Market Landscape
3 Market Sizing
4 Historic Market Size
5 Five Forces Analysis
6 Market Segmentation
End-userIndustrialCommercialComponentHardwareSoftwareGeographyNorth AmericaAPACEuropeSouth AmericaMiddle East And Africa
7 Customer Landscape
8 Geographic Landscape
9 Drivers, Challenges, and Trends
10 Company Landscape
11 Company Analysis
12 Appendix
About Technavio
Technavio is a leading global technology research and advisory company. Their research and analysis focuses on emerging market trends and provides actionable insights to help businesses identify market opportunities and develop effective strategies to optimize their market positions.
With over 500 specialized analysts, Technavio’s report library consists of more than 17,000 reports and counting, covering 800 technologies, spanning across 50 countries. Their client base consists of enterprises of all sizes, including more than 100 Fortune 500 companies. This growing client base relies on Technavio’s comprehensive coverage, extensive research, and actionable market insights to identify opportunities in existing and potential markets and assess their competitive positions within changing market scenarios.
Contacts
Technavio Research
Jesse Maida
Media & Marketing Executive
US: +1 844 364 1100
UK: +44 203 893 3200
Email: media@technavio.com
Website: www.technavio.com/
View original content to download multimedia:https://www.prnewswire.com/news-releases/noise-detection-and-monitoring-market-to-grow-by-usd-7-19-billion-2024-2028-as-new-product-launches-drive-revenue-ai-powered-market-evolution-report—technavio-302290567.html
SOURCE Technavio
You may like
Technology
TOTAL PLAY ANNOUNCES REVENUE OF Ps.11,177 MILLION AND EBITDA OF Ps.4,849 MILLION IN THE FIRST QUARTER OF 2026
Published
23 minutes agoon
April 24, 2026By
—Growth of 115,020 net subscribers in Totalplay Residencial in the period strengthens the company’s service revenues—
—EBITDA less Capex and interest reached Ps.883 million, the highest level ever recorded for a first quarter—
—A 9% reduction in debt with cost from loans provides additional strength to the company’s capital structure—
MEXICO CITY, April 23, 2026 /PRNewswire/ — Total Play Telecomunicaciones, S.A.P.I. de C.V. (“Total Play”), a leading telecommunications company in Mexico, which offers internet access, pay television and telephony services, through one of the largest 100% fiber optic networks in the country, announced today financial results for the first quarter of 2026.
“The growing preference of millions of homes for our technologically advanced internet services, with superior stability and speed, resulted in a net increase of 115,020 subscribers in the quarter, which continued to drive the company’s revenue,” commented Eduardo Kuri, CEO of Total Play. “The growth of our operations was consistent with the Capex which represented only 22% of revenue, and interest payments that decreased double-digit, in the context of lower debt with cost at the company. This resulted in a 51% increase in cash generation — defined as EBITDA less Capex and interest paid — reaching a record high of Ps.883 million in the period.”
“Regarding the balance sheet, we began this quarter with the amortization schedule for the Senior Secured Notes due 2028 — through a principal payment of US$15 million for the period — which adds to the US$56 million amortization of the remaining balance of the Senior Notes due in 2025 — done in the previous quarter — which, among other debt payments, contributed to a 9% reduction in our balance of debt with cost from loans,” added Mr. Kuri. “Simultaneously, we were able to decrease our lease liabilities by 30% and our trade payables by 22%, further strengthening Total Play’s solid capital structure.”
First quarter results
Revenue for the quarter was Ps.11,177 million, 3% higher than Ps.10,843 million for the same period of the previous year. Total costs and expenses were Ps.6,328 million, compared to Ps.5,761 million in the prior year.
As a result, Total Play’s EBITDA was Ps.4,849 million, from Ps.5,082 million a year ago; the quarter’s EBITDA margin was 43%. The company reported operating profit of Ps.301 million, compared to Ps.763 million a year earlier.
Total Play reported a net loss of Ps.1,327 million from a loss of Ps.1,961 million in the same quarter of 2025.
Q1 2025
Q1 2026
Change
Ps.
%
Revenue from services
$10,843
$11,177
$334
3 %
EBITDA
$5,082
$4,849
$(233)
(5) %
Operating income
$763
$301
$(462)
(61) %
Net result
$(1,961)
$(1,327)
$634
32 %
Amounts in millions of pesos.
EBITDA: Earnings before interest, taxes, depreciation, and amortization.
Revenue from services
The company’s revenue increased 3%, as a result of 3% growth in sales in the residential segment and 4% growth in revenue from the enterprise segment.
Totalplay Residential’s revenue increase to Ps.9,848 million, up from Ps.9,570 million the previous year, is related to a 4% increase in the number of the company’s service subscribers compared to the same quarter of the previous year, reaching 5,554,374 this period — a figure that includes 67,856 small and medium-sized businesses. Compared to the previous quarter, the subscriber base increased by 115,020 users. The company believes that the number of subscribers achieved this quarter reflects its remarkable ability to offer technologically advanced internet services — with superior stability and speed — continuous innovation in its entertainment platform, and service excellence.
Average revenue per subscriber (ARPU) for the quarter was Ps.588, compared to Ps.597 a year ago. The decrease in ARPU is largely related to a growing proportion of double-play subscribers compared to triple-play subscribers within the total residential subscriber base.
The number of homes passed by Total Play in Mexico at the end of this period was 19.5 million, compared to 17.6 million a year ago.
Penetration — the proportion of homes passed by Total Play that have the company’s telecommunications services — was 28.5% at the end of the quarter from 30.2% a year ago.
Revenue from the enterprise segment was Ps.1,329 million, up from Ps.1,273 million in the previous year, as a result of contracting Total Play services for the development of corporate client projects.
Costs and expenses
Total costs and expenses increased 10% as a result of a 4% increase in service costs and a 12% increase in expenses.
The increase in costs to Ps.1,663 million from Ps.1,597 million in the previous year, results mainly from higher costs related to memberships, maintenance and support, partially offset by lower content costs — as a result of a higher proportion of double play users in the mix of residential service subscribers and the negotiation of terms, in an optimal way, with content producers —.
The increase in expenses to Ps.4,665 million from Ps.4,164 million reflects higher maintenance, personnel, advertising and promotion expenses, in the context of the company’s growing operations.
EBITDA and net result
Total Play’s EBITDA was Ps.4,849 million compared to Ps.5,082 million the previous year.
Relevant variations below EBITDA were the following:
An increase of Ps.229 million in depreciation and amortization, as a result of user acquisition costs — telecommunications equipment, labor and installation in the period.
A Decrease of Ps.189 million in accrued interest payable, in the context of reducing the company’s debt with cost balance during the period.
Changes in the fair value of financial instruments of Ps.921 million, due to costs related to hedging options in the previous year.
Other financial income of Ps.31 million, compared to other expenses of Ps.200 million in the previous year, as a result of costs related to debt issuances a year ago.
A, increase of Ps.109 million in exchange losses as a result of net liability monetary position in foreign currency, together with greater depreciation of the peso against the basket of currencies in which the company’s monetary liabilities are denominated this quarter, compared to the previous year.
Total Play reported a net loss of Ps.1,327 million from a net loss of Ps.1,961 million in the same period of 2025.
Balance sheet
As of March 31, 2026, the company’s debt with cost from loans was Ps.55,477 million, 9% lower than the Ps.60,806 million of the previous year. The reduction resulted from various debt with cost amortizations during the period, including US$15 million of the company’s Senior Secured Notes due 2028 this quarter and US$56 million of the remaining Senior Notes due 2025, done last November, partially offset by the issuance of US$200 million in Additional Notes to the Senior Secured Notes due 2032, announced in April 2025.
Lease liabilities were Ps.2,756 million, 30% lower compared to Ps.3,917 million in the previous year.
Cash and cash equivalents, as well as restricted cash in trusts, was Ps.6,477 million, compared to Ps.10,008 million a year ago. As a result, the company’s net debt was Ps.51,756 million, 5% lower compared to Ps.54,715 million in the previous year.
The debt ratio — Net Debt / EBITDA of the last two quarters annualized — was 2.62 times.
Total Play’s fixed assets — which include accumulated investment in fiber optics, telecommunications equipment and subscriber acquisition costs, among other assets — were Ps.79,312 million, compared to Ps.85,944 million a year ago.
About Total Play
Total Play is a leading Triple Play provider in Mexico that, thanks to the widest direct-to-home fiber optic network in the country, offers entertainment and technologically advanced services with the highest quality and speed in the market. For the latest news and updates about Total Play, visit: www.totalplay.com.mx.
Total Play is a Grupo Salinas company (www.gruposalinas.com), a group of dynamic, fast-growing, and technologically advanced companies focused on creating economic value through market innovation and goods and services that improve standards of living; social value to improve community well-being; and environmental value by reducing the negative impact of its business activities. Created by Mexican entrepreneur Ricardo B. Salinas (www.ricardosalinas.com), Grupo Salinas operates as a management development and decision forum for the top leaders of member companies. Each of the Grupo Salinas companies operates independently, with its own management, board of directors, and shareholders. Grupo Salinas has no equity holdings. The group of companies shares a common vision, values, and strategies for achieving rapid growth, superior results, and world-class performance.
Except for historical information, the matters discussed in this press release are concepts about the future that involve risks and uncertainty that may cause actual results to differ materially from those projected. Other risks that may affect Total Play and its subsidiaries are presented in documents sent to the securities authorities.
Investor Relations:
Bruno Rangel
Rolando Villarreal
+ 52 (55) 1720 9167
+ 52 (55) 1720 9167
jrangelk@totalplay.com.mx
rvillarreal@totalplay.com.mx
Press Relations:
Luciano Pascoe
Tel. +52 (55) 1720 1313 ext. 36553
lpascoe@gruposalinas.com.mx
TOTAL PLAY TELECOMUNICACIONES, S.A.P.I. DE C.V.
Consolidated Quarterly Income Statements
(Millions of Mexican pesos)
1Q 25
1Q 26
Change
$
%
$
%
$
%
Revenue from services
10,843
100 %
11,177
100 %
334
3 %
Cost of services
(1,597)
(15 %)
(1,663)
(15 %)
(66)
(4 %)
Gross profit
9,246
85 %
9,514
85 %
268
3 %
General expenses
(4,164)
(38 %)
(4,665)
(42 %)
(501)
(12 %)
EBITDA
5,082
47 %
4,849
43 %
(233)
(5 %)
Depreciation and amortization
(4,319)
(40 %)
(4,548)
(41 %)
(229)
(5 %)
Operating profit
763
7 %
301
3 %
(462)
(61 %)
Financial cost:
Interest revenue
56
1 %
30
0 %
(26)
(46 %)
Accrued interest expense
(1,770)
(16 %)
(1,581)
(14 %)
189
11 %
Change in fair value of financial instruments
(924)
(9 %)
(3)
(0 %)
921
100 %
Other financial (expenses) income
(200)
(2 %)
31
0 %
231
—
Foreign exchange (loss) – Net
(40)
(0 %)
(149)
(1 %)
(109)
n.m.
(2,878)
(27 %)
(1,672)
(15 %)
1,206
42 %
Loss before income tax provisions
(2,115)
(20 %)
(1,371)
(12 %)
744
35 %
Income tax provision
154
1 %
44
0 %
(110)
(71 %)
Net loss for the period
(1,961)
(18 %)
(1,327)
(12 %)
634
32 %
TOTAL PLAY TELECOMUNICACIONES, S.A.P.I. DE C.V.
Consolidated Statements of Financial Position
(Millions of Mexican pesos)
As of March 2025
As of March 2026
Cambio
$
%
$
%
$
%
ASSETS
Current Assets:
Cash and cash equivalents
7,132
6 %
4,342
4 %
(2,790)
(39 %)
Restricted cash in trusts
2,876
3 %
2,135
2 %
(741)
(26 %)
Customers – net
2,902
3 %
3,016
3 %
114
4 %
Recoverable taxes
3,365
3 %
2,293
2 %
(1,072)
(32 %)
Inventories
2,416
2 %
2,146
2 %
(270)
(11 %)
Derivative financial instruments
193
0 %
–
0 %
(193)
(100 %)
Other current assets
873
1 %
883
1 %
10
1 %
Total current assets
19,757
18 %
14,815
15 %
(4,942)
(25 %)
Non-Current Assets:
Property, plant and equipmente – Net
85,944
77 %
79,312
81 %
(6,632)
(8 %)
Rights-of-use assets -Net
2,849
3 %
1,652
2 %
(1,197)
(42 %)
Trademarks and other assets
2,620
2 %
2,464
3 %
(156)
(6 %)
Total non-current assets
91,413
82 %
83,428
85 %
(7,985)
(9 %)
Total assets
1,11,170
100 %
–
98,243
100 %
(12,927)
(12 %)
LIABILITIES AND STOCKHOLDERS’ EQUITY
Short-Term Liabilities
Financial debt
9,240
8 %
5,435
6 %
(3,805)
(41 %)
Lease liabilities
2,367
2 %
1,749
2 %
(618)
(26 %)
Trade payables
12,719
11 %
9,913
10 %
(2,806)
(22 %)
Reverse factoring
1,483
1 %
278
0 %
(1,205)
(81 %)
Other short-term liabilities
3,814
3 %
3,255
3 %
(559)
(15 %)
Total short-term liabilities
29,623
27 %
20,630
21 %
(8,993)
(30 %)
Long-Term Liabilities
Financial debt
51,566
46 %
50,042
51 %
(1,524)
(3 %)
Lease liabilities
1,550
1 %
1,007
1 %
(543)
(35 %)
Employee benefits
101
0 %
148
0 %
47
47 %
Deferred income tax
12,950
12 %
13,741
14 %
791
6 %
Total liabilities
95,790
86 %
85,568
87 %
(10,222)
(11 %)
EQUITY:
Capital stock
8,201
7 %
8,060
8 %
(141)
(2 %)
Retained earnings
(15,836)
(14 %)
(17,171)
(17 %)
(1,335)
(8 %)
Other comprehensive income
23,015
21 %
21,786
22 %
(1,229)
(5 %)
Total equity
15,380
14 %
12,675
13 %
(2,705)
(18 %)
Total liabilities and equity
1,11,170
100 %
98,243
100 %
(12,927)
(12 %)
TOTAL PLAY TELECOMUNICACIONES, S.A.P.I. DE C.V.
Consolidated Statements of Cash Flows
(Millions of Mexican pesos)
3M 25
3M 26
$
$
Operating activities:
Loss before income tax provision
(2,115)
(1,371)
Items not requiring the use of resources:
Depreciation and amortization
4,320
4,548
Employee benefits
9
10
Items related to investing or financing activities:
Accrued interest income
(56)
(30)
Accrued interest expense
1,770
1,581
Other financial transactions
1,122
(27)
Unrealized exchange (gain) loss
(89)
262
4,961
4,973
Resources (used in) generated by operating activities:
Customers and unearned revenue
315
134
Other receivables
–
2
Related parties, net
53
(104)
Taxes to be recovered
353
260
Inventories
292
400
Advance payments
(76)
(179)
Trade payables
(906)
(1,092)
Other payables
299
434
Cash flows generated by operating activities
5,291
4,828
Investing activities:
Acquisition of property, plant and equipment
(2,601)
(2,425)
Other assets
(234)
75
Collected interest
56
31
Cash flows used in investing activities
(2,779)
(2,319)
Financing activities:
Capital repayments
–
–
Loans (paid) received
4,312
(58)
Leasing cash flows
(822)
(449)
Restricted Cash in Trusts
(488)
(371)
Reverse factoring
(107)
(80)
Derivative financial instruments
265
–
Interest payment
(1,895)
(1,541)
Cash flows used in financing activities
1,265
(2,499)
Net increase in cash and cash equivalents
3,777
10
Cash and cash equivalents at the beginning of the year
3,355
4,332
Cash and cash equivalents at the end of the year
7,132
4,342
View original content:https://www.prnewswire.com/news-releases/total-play-announces-revenue-of-ps11-177-million-and-ebitda-of-ps4-849-million-in-the-first-quarter-of-2026–302752403.html
SOURCE Total Play Telecomunicaciones, S.A.P.I. de C.V.
Technology
QNAP Launches QSW-M7230-2X4F24T L3 Lite 100GbE Managed Switch, Featuring MC-LAG and AVoIP
Published
23 minutes agoon
April 24, 2026By
TAIPEI, April 23, 2026 /PRNewswire/ — QNAP® Systems, Inc., a leading computing, networking, and storage solution innovator, today announced the launch of the QSW-M7230-2X4F24T, a new L3 Lite managed 100GbE switch designed for enterprise network upgrades, high-performance storage environments, large-scale media production, virtualization, and AI-driven workloads. The new switch enables organizations to build a scalable 100GbE core network while maintaining cost efficiency and protecting existing infrastructure investments.
As data-intensive applications continue to accelerate—from AI computing and virtualization to collaborative media workflows—enterprises are increasingly challenged to evolve beyond 10GbE networks without incurring disruptive, large-scale replacements. The QSW-M7230-2X4F24T addresses this transition by providing a flexible, multi-speed architecture that allows enterprises to introduce higher-speed connectivity where it matters most, while expanding the core network over time.
Featuring 100GbE backbones, 25GbE server uplinks, and 24-port 10GbE access, the QSW-M7230-2X4F24T offers seamless multi-speed integration. It allows enterprises to deploy high-performance 25GbE/100GbE where needed while preserving existing 10GbE assets, effectively minimizing upgrade complexity and maximizing infrastructure value.
“By combining 100GbE, 25GbE, and high-density 10GbE connectivity in a 1U form factor, the QSW-M7230-2X4F24T delivers exceptional flexibility and cost efficiency among its class,” said Ronald Hsu, Product Manager at QNAP. “It is an ideal solution for enterprises seeking a practical path to 100GbE without compromising current investments or future scalability.”
Optimized for AI and high-performance storage, the QSW-M7230-2X4F24T offers 10G/25G/100G multi-speed links with a 1080Gbps capacity, supporting PFC and ECN for lossless Ethernet. It combines L3 Lite management (including static routing and advanced VLANs) with an MC-LAG architecture to provide enhanced network resilience and high availability, ensuring uninterrupted service and eliminating single points of failure for critical business infrastructure.
For media and AV over IP deployments, the switch further strengthens multicast control and time synchronization. With support for IGMP Snooping, VLAN-based traffic segmentation, and a high-precision clock with PTP Boundary Clock, the QSW-M7230-2X4F24T minimizes audio-video synchronization issues commonly encountered in multi-display environments. This makes it well suited for broadcast production, live event venues, command centers, and enterprise video applications.
In addition, the QSW-M7230-2X4F24T supports AMIZcloud, QNAP’s cloud-based centralized management platform. Without requiring additional hardware or software controllers, IT teams can remotely monitor and manage multiple switches across locations, simplifying troubleshooting and reducing ongoing operational overhead.
For more information and to view the full QNAP lineup, please visit www.qnap.com.
View original content to download multimedia:https://www.prnewswire.com/news-releases/qnap-launches-qsw-m7230-2x4f24t-l3-lite-100gbe-managed-switch-featuring-mc-lag-and-avoip-302745716.html
SOURCE QNAP Systems, Inc.
Technology
SnapInspect Now Fully Qualified Yardi® Ecosystem Partner
Published
23 minutes agoon
April 24, 2026By
Interface is available now to SnapInspect clients using Yardi Voyager®
DALLAS, April 24, 2026 /PRNewswire/ — SnapInspect today announced it is now a fully qualified Yardi® Standard Interface Vendor, joining the approved network for Yardi, the leading provider of connected real estate software solutions. With this interface, companies using Yardi Voyager® can access their property management system data via the interface with SnapInspect.
With a focus on streamlining operations and increasing efficiency, Yardi Voyager and its single connected solution suite allow companies to manage operations, execute leasing, run analytics, and provide effective resident, owner and investor services. By interfacing with Yardi, vendors can provide Yardi clients with solutions that empower them within the Yardi ecosystem.
The Yardi ecosystem services the most vendors, APIs, units and square footage in the industry with more than 450 active interface partners in the Yardi network. Yardi’s goal is to make it easier for clients to choose best-for-you products that allow harmony across the many platforms they use. Yardi welcomes SnapInspect to the most robust platform ecosystem in the real estate industry.
“Commercial property teams have always had the data; they just haven’t always had it in one place. This integration closes the gap between inspections and maintenance operations, so every inspection finding flows directly into a work order, and everything is visible between profiles,” said new Yardi interface vendor, SnapInspect
For the complete list of the Yardi ecosystem, please visit: yardi.com/interface-vendors.
About Yardi
Yardi® develops industry-leading software for all types and sizes of real estate companies across the world. With over 10,000 employees, Yardi is working with our clients to drive significant innovation in the real estate industry. For more information on how Yardi is Energized for Tomorrow, visit yardi.com.
About SnapInspect
SnapInspect is a cloud-based property inspection software platform used by property managers, asset owners, and enterprise operators across the USA, Canada, and Dubai. The platform enables teams to conduct detailed property inspections, generate professional condition reports instantly, and track property maintenance analytics and asset condition data across entire portfolios. SnapInspect integrates natively with leading property management systems as a qualified interface vendor. Learn more at www.snapinspect.com
Photo – https://mma.prnewswire.com/media/2964560/Image.jpg
View original content:https://www.prnewswire.co.uk/news-releases/snapinspect-now-fully-qualified-yardi-ecosystem-partner-302752418.html
TOTAL PLAY ANNOUNCES REVENUE OF Ps.11,177 MILLION AND EBITDA OF Ps.4,849 MILLION IN THE FIRST QUARTER OF 2026
QNAP Launches QSW-M7230-2X4F24T L3 Lite 100GbE Managed Switch, Featuring MC-LAG and AVoIP
SnapInspect Now Fully Qualified Yardi® Ecosystem Partner
Send Rakhi to UK swiftly with UK Gifts Portal
Whiteboard Series with NEAR | Ep: 45 Joel Thorstensson from ceramic.network
New Gooseneck Omni Antennas Offer Enhanced Signals in a Durable Package
Why You Should Build on #NEAR – Co-founder Illia Polosukhin at CV Labs
Whiteboard Series with NEAR | Ep: 45 Joel Thorstensson from ceramic.network
NEAR End of Year Town Hall 2021: The Open Web World, MetaBUILD 2 Hackathon and 2021 recap
Trending
-
Technology4 days agoHarmonic Enables DIRECTV to Reimagine Nationwide DTH Service
-
Coin Market4 days agoCloud hosting firm Vercel confirms ‘limited’ hack of user info
-
Technology4 days agoThe Plumbing Sales Coach expands offerings with new Blueprint training program
-
Coin Market2 days agoKalshi mulls crypto expansion with perpetual futures launch: Report
-
Technology5 days agoTCL Solar: Powering Pakistan with advanced solar module innovation
-
Technology5 days agoTCL Solar: Powering Pakistan with advanced solar module innovation
-
Technology4 days agoTVU Networks and Tencent Cloud Unveil Next-Generation Cloud Production Solution at NAB 2026
-
Technology5 days agoBREAKTHROUGH PRIZE ANNOUNCES 2026 LAUREATES
