Technology
Nano Positioning Systems Market to Grow by USD 183.95 Million (2024-2028), Report on AI-Redefined Market Landscape and Nanotechnology Applications – Technavio
Published
1 year agoon
By
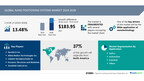
NEW YORK, Dec. 12, 2024 /PRNewswire/ — Report with market evolution powered by AI – The global nano positioning systems market size is estimated to grow by USD 183.95 million from 2024-2028, according to Technavio. The market is estimated to grow at a CAGR of 13.48% during the forecast period. Wide application of nanotechnology is driving market growth, with a trend towards growing focus on development of hybrid nano positioning systems. However, high sensitivity of nano positioning systems to environmental conditions poses a challenge. Key market players include Aerotech Inc., Allied Motion Technologies Inc., CEDRAT TECHNOLOGIES SA, Dynamic Structures and Materials LLC, Grayfield Optical Inc., Harbin Core Tomorrow Science and Technology Co. Ltd., ISP System, Mad City Labs Inc., MICRONIX USA, MKS Instruments Inc., Novanta Inc., OME Technology Co. Ltd., OWIS GmbH, Physik Instrumente GmbH and Co. KG, Piezosystem Jena GmbH, Prior Scientific Instruments Ltd., Pro Lite Technology Ltd., SmarAct GmbH, Thorlabs Inc., and WITTENSTEIN SE.
Key insights into market evolution with AI-powered analysis. Explore trends, segmentation, and growth drivers- View Free Sample PDF
Nano Positioning Systems Market Scope
Report Coverage
Details
Base year
2023
Historic period
2018 – 2022
Forecast period
2024-2028
Growth momentum & CAGR
Accelerate at a CAGR of 13.48%
Market growth 2024-2028
USD 183.95 million
Market structure
Fragmented
YoY growth 2022-2023 (%)
13.32
Regional analysis
North America, Europe, APAC, Middle East and Africa, and South America
Performing market contribution
North America at 37%
Key countries
US, China, France, UK, and Germany
Key companies profiled
Aerotech Inc., Allied Motion Technologies Inc., CEDRAT TECHNOLOGIES SA, Dynamic Structures and Materials LLC, Grayfield Optical Inc., Harbin Core Tomorrow Science and Technology Co. Ltd., ISP System, Mad City Labs Inc., MICRONIX USA, MKS Instruments Inc., Novanta Inc., OME Technology Co. Ltd., OWIS GmbH, Physik Instrumente GmbH and Co. KG, Piezosystem Jena GmbH, Prior Scientific Instruments Ltd., Pro Lite Technology Ltd., SmarAct GmbH, Thorlabs Inc., and WITTENSTEIN SE
Market Driver
The nanopositioning systems industry is experiencing significant growth due to increasing demands for devices with higher accuracy and speed. Optics, microscopy, semiconductor manufacturing, and photonics packaging are key applications driving this trend. Unique sensor arrangements offer error-free measurement in three coordinate axes, providing nano-metric precision. Advanced positioning systems, such as MEMS and capacitive sensors, use ceramic technology for miniaturization. Piezoelectric actuators and sensors, including strain gauge and piezoresistive, enable mechanical integration and force generation with lower energy consumption. Nanotechnology and biotechnology applications, including QUT, robot vision, service robots, autonomous vehicle systems, biomedical engineering, healthcare, quantum computing, nanoscale electronics, and tools and systems, are expanding the industry’s scope. Optical scanning, bio-nanotechnology, and optical alignment are essential in the aerospace and automotive sectors for tight tolerances in microelectronics, microchips, and optical devices. Diagnostic and therapeutic purposes, biological samples, nanometer-scale accuracy, and rapid response times are critical in imaging, communication, and sensing applications. High-tech companies and startups are investing in nanopositioning systems to meet the demands of various industries. However, trade disputes and shutting down of some manufacturers may impact the market. Sub-nanometer resolution, optical components like lenses, mirrors, prisms, and fibers, and advanced control algorithms are essential for future developments.
Nano positioning systems have long been recognized for their high accuracy in various industries. However, these traditional systems encounter limitations in terms of speed, adaptability, and versatility for diverse applications. To address these challenges, hybrid nano positioning systems have emerged as a promising solution. These systems integrate multiple positioning technologies, combining the strengths of traditional macro-positioning systems with advanced nano positioning techniques. Macro-positioning systems offer coarse positioning and general movement, while nano positioning elements provide fine-tuned control for high precision at the nanoscale. An illustrative example is the integration of piezoelectric actuators with servo motors, which enhances performance across a broader range of applications. This hybrid approach enables improved speed, adaptability, and versatility for nano positioning systems.
Request Sample of our comprehensive report now to stay ahead in the AI-driven market evolution!
Market Challenges
The nanopositioning systems industry faces challenges in achieving high accuracy and speed in devices using optics for microscopy, semiconductor manufacturing, photonics packaging, and biotechnology applications. Unique sensor arrangements are essential for error-free measurement along three coordinate axes, requiring nanometer-level precision. Trade disputes and shutting down of factories pose risks, but increasing application scope in advanced positioning systems drives growth. MEMS technologies using capacitive sensors, ceramic technology, and miniaturization are key trends. Piezoelectric actuators, sensors like strain gauge and piezoresistive sensors, mechanical integration, and force generation are important for nanotechnology and biotechnology applications. Lowered energy consumption is a priority. Nanopositioning systems are used in quantum computing, nanoscale electronics, tools and systems, optical scanning, bio-nanotechnology, optical alignment, aerospace, automotive, quality control, and more. Applications include diagnostic and therapeutic purposes, drug delivery, imaging agents, personalized medicine, medical devices, and more. High-tech companies and startups are investing in piezoelectric technology for sub-nanometer resolution and rapid response times. Optical technologies, imaging, communication, sensing applications, and nanometer-level accuracy are key areas of focus. Optical components like lenses, mirrors, prisms, and fibers are essential.Nano positioning systems are essential for manipulating objects at the nanometer level. These systems are highly sensitive to environmental conditions, particularly temperature and humidity. Temperature fluctuations can cause material properties and dimensions to change, impacting the stability and calibration of the system. Thermal expansion and contraction must be carefully managed to minimize errors. Similarly, humidity can affect the performance of nano positioning systems by altering their electrical properties or causing condensation. Maintaining a stable and controlled environment is crucial for ensuring the accuracy and precision of these advanced systems.
Discover how AI is revolutionizing market trends- Get your access now!
Segment Overview
This nano positioning systems market report extensively covers market segmentation by
Application 1.1 Optics1.2 Automotive1.3 Industrial1.4 OthersType 2.1 Capacitive sensor2.2 Piezoresistive sensor2.3 Piezoelectric sensorGeography 3.1 North America3.2 Europe3.3 APAC3.4 Middle East and Africa3.5 South America
1.1 Optics- The global fiber optics market is experiencing significant growth due to the increasing number of data centers, rising Internet traffic, and growing disposable income of consumers. This trend is driving the demand for advanced fiber-optic components, leading to an increased need for precise measurement using nano positioning systems. Major players in the fiber-optics industry, such as SANWA Denki Kogyo Co., Ltd. And Cisco Systems, Inc., are expanding their presence through mergers and acquisitions (M&A), further fueling the demand for nano positioning systems. The commercialization of 5G technology and subsequent data growth, as well as substantial investments in fiber-optic infrastructure, are additional factors contributing to the market’s expansion. For instance, NTT DATA Corporation’s new data center campus in Maharashtra, India, and Peninsula Fiber Network, LLC and 123NET’s partnership for fiber-optic network investments in Michigan, USA, highlight the market’s growth potential. These developments underscore the importance of nano positioning systems in the fiber-optics industry, ensuring accurate component manufacturing and assembly for the expanding global market.
Download a Sample of our comprehensive report today to discover how AI-driven innovations are reshaping competitive dynamics
Research Analysis
Nano positioning systems are advanced technology solutions that offer precise and high-speed motion control in three coordinate axes. These systems utilize unique sensor arrangements and control algorithms to ensure error-free measurement and alignment of devices, such as microscopy systems, semiconductor manufacturing equipment, photonics packaging systems, and optical devices. The accuracy and speed of these systems are crucial in various industries, including biotechnology, robot vision, service robots, autonomous vehicle systems, biomedical engineering, and the aerospace and automotive sectors. In microelectronics, nano positioning systems enable the manufacturing of microchips and optical devices with tight tolerances, ensuring optimal optical performance for diagnostic applications. Piezo actuators and optical alignment techniques are commonly used in these systems to achieve sub-nanometer positioning accuracy.
Nano positioning systems are advanced technology devices that offer nanometer-level accuracy and rapid response times. They utilize unique sensor arrangements and error-free measurement capabilities to control movement along three coordinate axes. These systems are finding increasing application scope in various industries, including semiconductor manufacturing, photonics packaging, and microscopy. Optics play a crucial role in these systems, with applications ranging from optical scanning and alignment to optical performance enhancement in microelectronics and optical devices. The nanopositioning systems industry is witnessing significant advancements, with the development of MEMS (Micro-Electro-Mechanical Systems) technologies using capacitive sensors, piezoelectric actuators, and strain gauge sensors. Ceramic technology and miniaturization are also key trends, enabling lower energy consumption and mechanical integration. Nanotechnology and biotechnology applications, such as QUT (Quartz Ultrasonic Transducers) and robot vision, are also driving growth. Trade disputes and shutting down of factories pose challenges, but the industry is expected to continue expanding due to the growing demand for advanced positioning systems in sectors like healthcare, quantum computing, nanoscale electronics, and the aerospace and automotive industries. Nano positioning systems are essential for achieving tight tolerances and ensuring quality control in various applications, including microchips, nanoparticles, drug delivery, and imaging agents for biomedical applications. Personalized medicine and medical devices markets are also significant consumers of these systems. Piezoelectric technology offers sub-nanometer resolution and rapid response times, making it a popular choice for many applications. Optical components, such as lenses, mirrors, prisms, and fibers, are also important in these systems, as they play a crucial role in achieving optimal optical performance. High-tech companies and startups are investing heavily in research and development to push the boundaries of nanopositioning technology and create innovative solutions for various industries.
Table of Contents:
1 Executive Summary
2 Market Landscape
3 Market Sizing
4 Historic Market Size
5 Five Forces Analysis
6 Market Segmentation
ApplicationOpticsAutomotiveIndustrialOthersTypeCapacitive SensorPiezoresistive SensorPiezoelectric SensorGeographyNorth AmericaEuropeAPACMiddle East And AfricaSouth America
7 Customer Landscape
8 Geographic Landscape
9 Drivers, Challenges, and Trends
10 Company Landscape
11 Company Analysis
12 Appendix
About Technavio
Technavio is a leading global technology research and advisory company. Their research and analysis focuses on emerging market trends and provides actionable insights to help businesses identify market opportunities and develop effective strategies to optimize their market positions.
With over 500 specialized analysts, Technavio’s report library consists of more than 17,000 reports and counting, covering 800 technologies, spanning across 50 countries. Their client base consists of enterprises of all sizes, including more than 100 Fortune 500 companies. This growing client base relies on Technavio’s comprehensive coverage, extensive research, and actionable market insights to identify opportunities in existing and potential markets and assess their competitive positions within changing market scenarios.
Contacts
Technavio Research
Jesse Maida
Media & Marketing Executive
US: +1 844 364 1100
UK: +44 203 893 3200
Email: media@technavio.com
Website: www.technavio.com/
View original content to download multimedia:https://www.prnewswire.com/news-releases/nano-positioning-systems-market-to-grow-by-usd-183-95-million-2024-2028-report-on-ai-redefined-market-landscape-and-nanotechnology-applications—technavio-302330412.html
SOURCE Technavio
You may like
Technology
In HelloNation, Senior Living Experts Rusty and Kelly Ackerman Explain What Families Should Ask a Senior Living Community
Published
10 minutes agoon
April 30, 2026By
TRAVERSE CITY, Mich., April 30, 2026 /PRNewswire/ — The article outlines how thoughtful questions reveal care quality, communication practices, and daily life in senior living communities.
What should families focus on when evaluating a senior living community beyond first impressions? HelloNation has released an article that provides clear guidance on how to approach this decision with confidence and clarity.
The article features insights from Senior Living Experts Rusty and Kelly Ackerman of French Manor Assisted Living in Traverse City, Michigan, and highlights how asking the right questions during a senior living community tour can reveal how care and daily life truly function.
The HelloNation article explains that while appearance and atmosphere matter, the most meaningful insights come from asking the right questions. Families who take a thoughtful approach during a senior living community tour can better understand how care, communication, and daily routines operate behind the scenes.
One of the most important areas discussed is how personalized care plans are developed and maintained. The article describes how communities assess individual needs and adjust care over time. It notes that asking about evaluation frequency and how changes in health or mobility are handled gives families a clearer understanding of long-term support.
Communication is another central topic. The article emphasizes the importance of knowing who the main point of contact is and how updates are shared. Consistent communication helps families stay informed and builds trust between residents, staff, and loved ones.
Safety measures are addressed with a focus on specifics. The article encourages families to ask about emergency response times, monitoring systems, and protocols. These safety measures are essential for both urgent situations and everyday peace of mind.
Daily routines also provide valuable insight into community life. The article explains that families should ask what a typical day includes, from meals to activities and rest periods. Observing these routines during a senior living community tour helps determine whether the environment supports both structure and independence.
Staff training is another key factor highlighted in the article. It describes how onboarding and ongoing education prepare caregivers to meet a range of needs. Senior Living Experts note that well-trained staff contribute to consistent care and are better equipped to respond to changing situations.
The article also focuses on resident engagement. Asking about social opportunities, wellness programs, and group activities helps families understand how residents stay connected and active. Strong resident engagement supports emotional well-being and fosters meaningful relationships.
Transitions are another important consideration. The article explains that families should ask how communities support new residents and those with increasing care needs. Understanding this process helps ensure continuity and reduces stress during periods of change.
In addition, the article discusses how feedback is gathered and used. Communities that hold meetings, conduct surveys, or encourage open communication tend to be more responsive. This approach supports a stable and supportive environment for residents and families alike.
Overall, the HelloNation article emphasizes that choosing a senior living community involves more than evaluating physical space. By focusing on personalized care plans, communication, safety measures, staff training, and resident engagement, families can make more informed decisions.
For readers seeking practical guidance, the article provides a clear framework for evaluating options through meaningful questions rather than surface impressions.
What Families Should Ask a Senior Living Community features insights from Rusty and Kelly Ackerman, Senior Living Experts of Traverse City, Michigan, in HelloNation.
About HelloNation
HelloNation is a premier media platform that connects readers with trusted professionals and businesses across various industries. Through its innovative “edvertising” approach that blends educational content with storytelling, HelloNation delivers expert-driven, good-news articles that inform, inspire, and empower. Covering topics from home improvement and health to business strategy and lifestyle, HelloNation highlights leaders making a meaningful impact in their communities.
View original content to download multimedia:https://www.prnewswire.com/news-releases/in-hellonation-senior-living-experts-rusty-and-kelly-ackerman-explain-what-families-should-ask-a-senior-living-community-302759459.html
SOURCE HelloNation
Technology
Suzano Selects Avondale Global Gateway as Gulf Coast Hub, Bringing Regular Wood Pulp Imports Back to Louisiana for First Time in More Than 30 Years
Published
11 minutes agoon
April 30, 2026By
Five-year agreement establishes Avondale Global Gateway as a key Gulf Coast terminal for Suzano’s growing North American operations
AVONDALE, La., April 30, 2026 /PRNewswire/ — Avondale Global Gateway (AGG) and Suzano today announced a five-year terminal services agreement that will bring regular wood pulp imports back to Louisiana for the first time in more than 30 years.
Under the agreement, AGG will serve as one of Suzano’s terminals in the Central Gulf Coast for their wood pulp shipments arriving from Brazil, to be distributed across North America by rail. The first vessel is scheduled to arrive at AGG in the first week of May this year.
The agreement marks a significant milestone for both Louisiana and Suzano, the world’s largest pulp supplier and one of Brazil’s biggest exporters which has been present in the American market for over 40 years. Suzano’s decision also aligns with its continued expansion in the region, including its 2024 acquisition of mills in Arkansas and North Carolina from Pactiv Evergreen. As part of its North American growth strategy, Suzano selected Avondale following a two-year evaluation process focused on logistics efficiency, infrastructure, and long-term scalability. The Avondale operation will support this strategy by creating a more centralized and efficient logistics footprint on the Gulf Coast.
“An efficient and resilient supply chain is essential to our business, and Avondale offers the combination of river access, rail connectivity, port infrastructure, and operational flexibility we were looking for,” said Juliana Vizintim, Operations Executive Manager at Suzano. “This partnership strengthens our Gulf Coast logistics platform and enhances supply assurance and efficiency for our customers across North America. At Suzano, we believe it is only good for us if it is good for the world, and we view this milestone as a foundation for long-term value creation—benefiting the local community, our business partners, and our customers. Suzano and Avondale share a common vision focused on collaboration, growth, and building a sustainable future together.”
To support the new operation, AGG has completed major upgrades to 245,000 square feet of warehouse space, including new concrete flooring, five additional loading doors, loading platforms, overhead awnings, and a laser fire detection and suppression system. These improvements were made specifically to meet Suzano’s operational requirements.
In parallel, a $13 million rail expansion is underway at Avondale, funded in part through Louisiana Economic Development’s FastSites program. Together with other site improvements, total investment tied to the Suzano operation is expected to exceed $20 million over time. The project is also expected to support 50 full-time jobs.
“Bringing wood pulp back to Louisiana is a major milestone,” said Adam Anderson, Chairman and CEO of T. Parker Host, parent company of Avondale Global Gateway. “This is new activity for the state, new jobs, and meaningful investment at Avondale. It reflects the kind of long-term industrial growth we believed this site could support and shows what’s possible when the right partner, infrastructure, and location come together.”
Rail service will play a central role in the operation, allowing cargo to move efficiently from vessel to warehouse to inland destinations across the United States. AGG worked closely with Union Pacific to align infrastructure and service capacity ahead of launch.
Since T. Parker Host acquired the former Avondale Shipyard in 2018, the 275-acre site has been steadily redeveloped into a multimodal logistics hub. Today, Avondale supports more than 600 workers across site operations, tenants, and active construction.
About Avondale Global Gateway
Avondale Global Gateway is a multimodal logistics and terminal facility located on the Mississippi River in Jefferson Parish, Louisiana. Operated by T. Parker Host, the site offers deepwater dock access, large-scale warehousing, and Class I rail connectivity, supporting bulk and breakbulk cargo flows across North America. Learn more at www.avondaleglobalgateway.com
About Suzano
Suzano is the world’s largest pulp supplier, a major paper and packaging producer in the Americas, and one of Brazil’s largest employers.
Driven by a deep commitment to sustainability and innovation, Suzano produces responsibly grown raw materials that are exported to more than 100 countries, meeting global demand for bio-based solutions. These materials are used in everyday products that reach more than two billion people, including tissue, packaging, printing and writing paper, personal hygiene products, and textiles.
Founded in Brazil more than 100 years ago, Suzano operates across Latin America, North America, Europe, and Asia. The company’s shares are listed on B3 in São Paulo (SUZB3) and the New York Stock Exchange (SUZ). Learn more at suzano.com.br/en.
View original content to download multimedia:https://www.prnewswire.com/news-releases/suzano-selects-avondale-global-gateway-as-gulf-coast-hub-bringing-regular-wood-pulp-imports-back-to-louisiana-for-first-time-in-more-than-30-years-302759457.html
SOURCE Avondale Global Gateway
Technology
Dolby Laboratories Reports Second Quarter 2026 Financial Results
Published
11 minutes agoon
April 30, 2026By
SAN FRANCISCO, April 30, 2026 /PRNewswire/ — Dolby Laboratories, Inc. (NYSE: DLB) today announced the company’s financial results for the second quarter of fiscal 2026.
“We continue to strengthen our position and create growth opportunities across existing and new business areas,” said Kevin Yeaman, President and CEO, Dolby Laboratories. “This quarter, we continued to expand our reach especially in sports with events like the Super Bowl, Winter Olympics and T20 Cricket World Cup available in Dolby and automotive with automakers including BMW and Lexus integrating Dolby into their in-car experiences.”
Second Quarter Fiscal 2026 Financial Highlights
Total revenue was $396 million, compared to $370 million for the second quarter of fiscal 2025.GAAP net income was $95 million or $0.99 per diluted share, compared to GAAP net income of $92 million or $0.94 per diluted share for the second quarter of fiscal 2025. On a non-GAAP basis, second quarter net income was $131 million or $1.37 per diluted share, compared to $131 million or $1.34 per diluted share for the second quarter of fiscal 2025.Dolby repurchased approximately one million shares of its common stock for approximately $65 million, and ended the quarter with approximately $142 million of stock repurchase authorization available going forward.
A complete listing of Dolby’s non-GAAP measures are described and reconciled to the corresponding GAAP measures at the end of this release.
Recent Business Highlights
Various sporting events were shown in Dolby Atmos and/or Dolby Vision including the Super Bowl, the 2026 Olympic Winter Games, and the ICC Men’s T20 Cricket World Cup. Apple TV is streaming Formula One in Dolby Vision.At the 2026 Beijing International Automotive Exhibition (Auto China 2026), BMW and Dolby announced the launch of Dolby Atmos in the new BMW 7 Series and the new BMW iX3 Long Wheelbase.Douyin, the Chinese version of TikTok, is fully supporting content in Dolby Vision.Hisense, TCL and Philips have announced plans to release a wide range of Dolby Vision 2 enabled TVs globally by the end of the year, with Peacock and Canal+ committed to delivering content.Sharp and SK Planet joined the Video Distribution Program, bringing the licensor total to 40.
Dividend
Today, Dolby announced a cash dividend of $0.36 per share of Class A and Class B common stock, payable on May 20, 2026, to stockholders of record as of the close of business on May 12, 2026.
Financial Outlook
Dolby’s financial outlook relies, in part, on estimates of royalty-based revenue that take into consideration various factors that are subject to uncertainty, including consumer demand for electronic products. In addition, actual results could differ materially from the estimates Dolby is providing herein due in part to uncertainty resulting from the macroeconomic effect of certain conditions, including developments concerning trade restrictions and changes in trade or diplomatic relationships, supply chain constraints, international conflicts, geopolitical instability, and fluctuations in inflation and interest rates. The uncertainty resulting from these factors has greatly reduced visibility into Dolby’s future outlook. To the extent possible, the estimates Dolby is providing for future periods reflect certain assumptions about the potential impact of certain of these items, based upon a consideration of currently available external and internal data and information. These assumptions are subject to risks and uncertainties. For more information, see “Forward-Looking Statements” in this press release for a description of certain risks that Dolby faces, and the section captioned “Risk Factors” in its Quarterly Report on Form 10-Q for the second quarter of fiscal 2026, to be filed on or around the date hereof.
Dolby is providing the following estimates for its third quarter of fiscal 2026:
Total revenue is estimated to range from $295 million to $325 million.Licensing revenue is estimated to range from $270 million to $300 million. Gross margins are anticipated to be approximately 86% on a GAAP basis and approximately 88% on a non-GAAP basis.Operating expenses are anticipated to range from $235 million to $245 million on a GAAP basis and from $200 million to $210 million on a non-GAAP basis.Effective tax rate is anticipated to be around 23% on a GAAP basis and around 21% on a non-GAAP basis.Diluted earnings per share is anticipated to range from $0.19 to $0.34 on a GAAP basis and from $0.56 to $0.71 on a non-GAAP basis.
Dolby is providing the following estimates for the full year of fiscal 2026:
Total revenue is expected to range from $1.40 billion to $1.45 billion.Licensing revenue is estimated to range from $1.295 billion to $1.345 billion. Gross margins are anticipated to be approximately 88% on a GAAP basis and approximately 90% on a non-GAAP basis.Operating expenses are anticipated to range from $930 million to $950 million on a GAAP basis and from $780 million to $800 million on a non-GAAP basis.Dolby expects operating margins to be approximately 21% on a GAAP basis and to be approximately 34% on a non-GAAP basis.Effective tax rate is anticipated to be around 23% on a GAAP basis and around 20% on a non-GAAP basis.Diluted earnings per share is anticipated to range from $2.66 to $2.81 on a GAAP basis and from $4.30 to $4.45 on a non-GAAP basis.
Conference Call Information
Members of Dolby management will lead a conference call open to all interested parties to discuss second quarter fiscal 2026 financial results for Dolby Laboratories at 2:00 p.m. PT (5:00 p.m. ET) on Thursday, April 30, 2026.
The conference call can be accessed by registering online at Dolby Laboratories Q2 Fiscal Year 2026 Financial Results, at which time registrants will receive dial-in information as well as a conference ID.
A live audio webcast of the conference call will be available at http://investor.dolby.com where it will be archived for one year.
Non-GAAP Financial Information
To supplement Dolby’s financial statements presented on a GAAP basis, Dolby management uses, and Dolby provides to investors, certain non-GAAP financial measures as an additional tool to evaluate Dolby’s operating results in a manner that focuses on what Dolby’s management believes to be its ongoing business operations and performance. We believe these non-GAAP financial measures are also helpful to investors in enabling comparability of operating performance between periods and among peer companies. Additionally, Dolby’s management regularly uses our supplemental non-GAAP financial measures to make operating decisions, for planning and forecasting purposes and determining bonus payouts. Specifically, Dolby excludes the following as adjustments from one or more of its non-GAAP financial measures:
Stock-based compensation expense: Stock-based compensation, unlike cash-based compensation, utilizes subjective assumptions in the methodologies used to value the various stock-based award types that Dolby grants. These assumptions may differ from those used by other companies. To facilitate more meaningful comparisons between its underlying operating results and those of other companies, Dolby excludes stock-based compensation expense.
Amortization of acquisition-related intangibles: Dolby amortizes intangible assets acquired in connection with business combinations. These intangible assets consist of patents and technology, customer relationships, and other intangibles. Dolby records amortization charges relating to these intangible assets in its GAAP financial statements, and Dolby views these charges as items arising from pre-acquisition activities that are determined by the timing and valuation of its acquisitions. As these amortization charges do not directly correlate to its operations during any particular period, Dolby excludes these charges to facilitate an evaluation of its current operating performance and comparisons to its past operating results. In addition, while amortization expense of acquisition-related intangible assets is excluded from Non-GAAP Net Income, the revenue generated from those assets is not excluded.
Restructuring charges or credits: Restructuring charges are costs associated with restructuring plans and primarily relate to costs associated with exit or disposal activities, employee severance benefits, and asset impairments. Dolby excludes restructuring costs, including any adjustments to charges recorded in prior periods (which may be credits), as Dolby believes that these costs are not representative of its normal operating activities and therefore, excluding these amounts enables a more effective comparison of its past operating performance and to that of other companies.
Income tax adjustments: The income tax effects of the aforementioned non-GAAP adjustments do not directly correlate to its operating performance so Dolby believes that excluding such income tax effects provides a more meaningful view of its underlying operating results to management and investors.
Using the aforementioned adjustments, Dolby provides various non-GAAP financial measures including, but not limited to: non-GAAP net income, non-GAAP diluted earnings per share, non-GAAP gross margin, non-GAAP operating expenses, non-GAAP operating margin, and non-GAAP effective tax rate. Dolby’s management believes it is useful for itself and investors to review both GAAP and non-GAAP measures to assess the performance of Dolby’s business, including as a means to evaluate period-to-period comparisons. Dolby’s management does not itself, nor does it suggest that investors should, consider non-GAAP financial measures in isolation from, superior to, or as a substitute for, financial information prepared in accordance with GAAP. Whenever Dolby uses non-GAAP financial measures, it provides a reconciliation of the non-GAAP financial measures to the most closely applicable GAAP financial measures. Investors are encouraged to review the related GAAP financial measures and the reconciliation of these non-GAAP financial measures to their most directly comparable GAAP financial measures as detailed above and below. Investors are also encouraged to review Dolby’s GAAP financial statements as reported in its US Securities and Exchange Commission (SEC) filings. A reconciliation between GAAP and non-GAAP financial measures is provided at the end of this press release and on the Dolby investor relations website, http://investor.dolby.com.
Forward-Looking Statements
Certain statements in this press release and in our earnings calls, including, but not limited to, expected financial results for the third quarter of fiscal 2026 and full year fiscal 2026, Dolby’s ability to expand existing business, navigate challenging periods, pursue its long-term growth opportunities, and advance its other long-term objectives are “forward-looking statements” that inherently involve substantial risks and uncertainties. These forward-looking statements are based on management’s current expectations, and as a result of certain risks and uncertainties, actual results may differ materially from those provided. The following important factors, without limitation, could cause actual results to differ materially from those in the forward-looking statements: the potential impacts of economic conditions on Dolby’s business operations, financial results, and financial position (including the impact to Dolby partners and disruption of the supply chain and delays in shipments of consumer products; the level at which Dolby technologies are incorporated into products and the consumer demand for such products; delays in the development and release of new products or services that contain Dolby technologies; delays in royalty reporting or delinquent payment by partners or licensees; lengthening sales cycles; the impact to the overall cinema market including adverse impact to Dolby’s revenue recognized on box-office sales and demand for cinema products and services; and macroeconomic conditions that affect discretionary spending and access to products that contain Dolby technologies); risks associated with geopolitical issues and international conflicts; risks associated with trends in the markets in which Dolby operates, including the broadcast, mobile, consumer electronics, PC, and other markets; the loss of, or reduction in sales by, a key customer, partner, or licensee; pricing pressures; risks relating to changing trends in the way that content is distributed and consumed; risks relating to conducting business internationally, including trade restrictions and changes in diplomatic or trade relationships; risks relating to maintaining patent coverage; the timing of Dolby’s receipt of royalty reports and payments from its licensees, including recoveries; changes in tax regulations; timing of revenue recognition under licensing agreements and other contractual arrangements; Dolby’s ability to develop, maintain, and strengthen relationships with industry participants; Dolby’s ability to develop and deliver innovative products and technologies in response to new and growing markets; competitive risks; risks associated with conducting business in countries that have historically limited recognition and enforcement of intellectual property and contractual rights; risks associated with the health of the motion picture and cinema industries generally; Dolby’s ability to increase its revenue streams and to expand its business generally, and to continue to expand its business beyond its current technology offerings; risks associated with acquiring and successfully integrating businesses or technologies; and other risks detailed in Dolby’s SEC filings and reports, including the risks identified under the section captioned “Risk Factors” in its Quarterly Report on Form 10-Q filed on or around the date hereof. Dolby may not actually achieve the plans, intentions, or expectations disclosed in its forward-looking statements. Forward-looking statements are based upon information available to us as of the date of such statements, and while Dolby believes such information forms a reasonable basis for such statements, such information may be limited or incomplete. These statements are inherently uncertain and investors are cautioned not to unduly rely upon these statements. Except as required by law, Dolby disclaims any obligation to update information contained in these forward-looking statements whether as a result of new information, future events, or otherwise.
About Dolby
Dolby Laboratories (NYSE: DLB) is a world leader in immersive entertainment. From movies and TV, to music, sports, gaming, and beyond, Dolby transforms the science of sight and sound into spectacular experiences for billions of people worldwide across all their favorite devices. We partner with artists, storytellers, and the brands you love to transform entertainment and digital experiences through groundbreaking innovations like Dolby Atmos, Dolby Vision, Dolby Cinema, and Dolby OptiView.
Dolby, Dolby Atmos, Dolby Vision, Dolby Cinema, Dolby OptiView, and the double-D symbol are among the registered and unregistered trademarks of Dolby Laboratories in the United States and/or other countries. Other trademarks remain the property of their respective owners.
DOLBY LABORATORIES, INC.
INTERIM CONDENSED CONSOLIDATED STATEMENTS OF OPERATIONS
(in thousands, except per share amounts; unaudited)
Fiscal Quarter Ended
Fiscal Year-To-Date Ended
March 27,
2026
March 28,
2025
March 27,
2026
March 28,
2025
Revenue:
Licensing
$ 372,245
$ 346,006
$ 692,016
$ 676,485
Products and services
23,385
23,555
50,320
50,075
Total revenue
395,630
369,561
742,336
726,560
Cost of revenue:
Cost of licensing
24,043
19,685
44,805
40,795
Cost of products and services
20,688
16,152
43,134
35,816
Total cost of revenue
44,731
35,837
87,939
76,611
Gross profit
350,899
333,724
654,397
649,949
Operating expenses:
Research and development
63,651
61,707
132,728
128,345
Sales and marketing
96,163
89,629
187,715
184,028
General and administrative
75,955
70,415
146,198
140,507
Restructuring charges
2,184
4,210
12,650
9,426
Total operating expenses
237,953
225,961
479,291
462,306
Operating income
112,946
107,763
175,106
187,643
Other income/(expense):
Interest income/(expense), net
5,024
3,559
9,142
6,205
Other income, net
1,729
8,928
7,053
12,453
Total other income
6,753
12,487
16,195
18,658
Income before income taxes
119,699
120,250
191,301
206,301
Provision for income taxes
(24,245)
(28,024)
(42,166)
(46,005)
Net income including noncontrolling interest
95,454
92,226
149,135
160,296
Less: net income attributable to noncontrolling interest
(539)
(433)
(893)
(681)
Net income attributable to Dolby Laboratories, Inc.
$ 94,915
$ 91,793
$ 148,242
$ 159,615
Net income per share:
Basic
$ 1.00
$ 0.95
$ 1.55
$ 1.66
Diluted
$ 0.99
$ 0.94
$ 1.54
$ 1.64
Weighted-average shares outstanding:
Basic
95,218
96,329
95,342
95,972
Diluted
95,515
97,471
96,273
97,581
DOLBY LABORATORIES, INC.
INTERIM CONDENSED CONSOLIDATED BALANCE SHEETS
(in thousands; unaudited)
March 27,
2026
September 26,
2025
ASSETS
Current assets:
Cash and cash equivalents
$ 594,282
$ 701,893
Restricted cash
79,523
91,468
Short-term investments
460
703
Accounts receivable, net
391,293
331,096
Contract assets, net
238,924
180,804
Inventories, net
31,929
30,424
Prepaid expenses and other current assets
78,298
51,873
Total current assets
1,414,709
1,388,261
Long-term investments
81,220
80,205
Property, plant, and equipment, net
461,841
470,608
Operating lease right-of-use assets
44,759
33,204
Goodwill and intangible assets, net
919,378
926,957
Deferred taxes
209,321
214,361
Other non-current assets
118,266
114,164
Total assets
$ 3,249,494
$ 3,227,760
LIABILITIES AND STOCKHOLDERS’ EQUITY
Current liabilities:
Accounts payable
$ 20,688
$ 17,840
Accrued liabilities
405,200
369,256
Income taxes payable
15
8,928
Contract liabilities
38,837
31,382
Operating lease liabilities
9,866
10,384
Total current liabilities
474,606
437,790
Non-current contract liabilities
24,084
29,687
Non-current operating lease liabilities
39,826
28,494
Other non-current liabilities
83,846
99,843
Total liabilities
622,362
595,814
Stockholders’ equity:
Class A common stock
53
54
Class B common stock
40
40
Retained earnings
2,630,175
2,634,980
Accumulated other comprehensive loss
(12,276)
(12,517)
Total stockholders’ equity – Dolby Laboratories, Inc.
2,617,992
2,622,557
Noncontrolling interest
9,140
9,389
Total stockholders’ equity
2,627,132
2,631,946
Total liabilities and stockholders’ equity
$ 3,249,494
$ 3,227,760
DOLBY LABORATORIES, INC.
INTERIM CONDENSED CONSOLIDATED STATEMENTS OF CASH FLOWS
(in thousands; unaudited)
Fiscal Year-To-Date Ended
March 27,
2026
March 28,
2025
Operating activities:
Net income including noncontrolling interest
$ 149,135
$ 160,296
Adjustments to reconcile net income to net cash provided by operating activities:
Depreciation and amortization
48,242
43,899
Stock-based compensation
67,919
66,734
Amortization of operating lease right-of-use assets
5,417
5,725
Provision for credit losses
3,691
1,967
Deferred income taxes
5,212
(3,741)
Share of net income of equity method investees, net of cash distributions
(1,933)
(1,325)
Other non-cash items affecting net income
(1,741)
(443)
Changes in operating assets and liabilities:
Accounts receivable, net
(104,083)
(420)
Contract assets, net
(60,474)
(32,864)
Inventories
3,853
(1,155)
Operating lease right-of-use assets
(17,177)
(1,608)
Prepaid expenses and other assets
(33,842)
26,577
Accounts payable and accrued liabilities
82,873
27,267
Income taxes, net
(6,067)
5,906
Contract liabilities
7,478
3,282
Operating lease liabilities
11,029
(5,682)
Other non-current liabilities
(12,227)
(12,739)
Net cash provided by operating activities
147,305
281,676
Investing activities:
Proceeds from sales of marketable securities
—
15,911
Proceeds from sale of assets held for sale
—
16,881
Proceeds from sale of intangible assets
6,623
—
Purchases of property, plant, and equipment
(13,690)
(13,676)
Business combinations, net of cash and restricted cash acquired, and other related payments
—
(1,362)
Purchases of intangible assets
(37,775)
—
Net cash provided by/(used in) investing activities
(44,842)
17,754
Financing activities:
Proceeds from issuance of common stock
15,293
26,124
Repurchase of common stock
(135,004)
(49,999)
Payment of excise tax on repurchase of common stock
—
(261)
Payment of cash dividend
(68,674)
(63,377)
Distributions to noncontrolling interest
(1,106)
(981)
Shares repurchased for tax withholdings on vesting of restricted stock
(32,222)
(33,950)
Net cash used in financing activities
(221,713)
(122,444)
Effect of foreign exchange rate changes on cash, cash equivalents, and restricted cash
(306)
(4,396)
Net increase/(decrease) in cash, cash equivalents, and restricted cash
(119,556)
172,590
Cash, cash equivalents, and restricted cash at beginning of period
793,361
577,752
Cash, cash equivalents, and restricted cash at end of period
$ 673,805
$ 750,342
Licensing Revenue by Market
(unaudited)
The following table presents the composition of our licensing revenue and percentage of total licensing revenue for all periods presented (in thousands, except percentage amounts):
Fiscal Quarter Ended
Fiscal Year-To-Date Ended
Market
March 27, 2026
March 28, 2025
March 27, 2026
March 28, 2025
Broadcast
$ 119,199
32 %
$ 94,249
27 %
$ 219,462
32 %
$ 210,011
31 %
Mobile
94,240
25 %
100,123
29 %
169,189
24 %
161,647
24 %
CE
40,949
11 %
38,140
11 %
86,551
13 %
87,597
13 %
PC
59,463
16 %
58,402
17 %
88,180
13 %
89,658
13 %
Other
58,394
16 %
55,092
16 %
128,634
18 %
127,572
19 %
Total licensing revenue
$ 372,245
100 %
$ 346,006
100 %
$ 692,016
100 %
$ 676,485
100 %
GAAP to Non-GAAP Reconciliations
(unaudited)
The following tables present Dolby’s GAAP financial measures reconciled to the non-GAAP financial measures included in this release for the
second quarters of fiscal 2026 and fiscal 2025:
Net income:
Fiscal Quarter Ended
(in thousands)
March 27,
2026
March 28,
2025
GAAP net income attributable to Dolby Laboratories, Inc.
$ 94,915
$ 91,793
Stock-based compensation (1)
30,708
30,664
Amortization of acquisition-related intangibles (2)
9,713
10,078
Restructuring charges
2,184
4,210
Income tax adjustments
(6,190)
(6,017)
Non-GAAP net income attributable to Dolby Laboratories, Inc.
$ 131,330
$ 130,728
(1) Stock-based compensation included in above line items:
Cost of products and services
$ 424
$ 414
Research and development
9,807
9,043
Sales and marketing
10,216
10,640
General and administrative
10,261
10,567
(2) Amortization of acquisition-related intangibles included in above line items:
Cost of licensing
$ 6,589
$ 6,720
Cost of products and services
772
728
Sales and marketing
356
317
General and administrative
1,555
1,872
Other income, net
441
441
Diluted earnings per share:
Fiscal Quarter Ended
March 27,
2026
March 28,
2025
GAAP diluted earnings per share
$ 0.99
$ 0.94
Stock-based compensation
0.32
0.32
Amortization of acquisition-related intangibles
0.10
0.10
Restructuring charges
0.02
0.04
Income tax adjustments
(0.06)
(0.06)
Non-GAAP diluted earnings per share
$ 1.37
$ 1.34
Weighted-average shares outstanding – diluted (in thousands)
95,515
97,471
The following tables present a reconciliation between GAAP and non-GAAP versions of the estimated financial measures for the third quarter of
fiscal 2026 and full year fiscal 2026 included in this release:
Gross margin:
Q3 2026
Fiscal 2026
GAAP gross margin
86.0 %
88.0 %
Stock-based compensation
0.1 %
0.1 %
Amortization of acquisition-related intangibles
1.9 %
1.9 %
Non-GAAP gross margin
88.0 %
90.0 %
Operating expenses (in millions):
Q3 2026
Fiscal 2026
GAAP operating expenses (low – high end of range)
$235 – $245
$930 – $950
Stock-based compensation
(32)
(128)
Amortization of acquisition-related intangibles
(3)
(9)
Restructuring charges
—
(13)
Non-GAAP operating expenses (low – high end of range)
$200 – $210
$780 – $800
Operating margin:
Fiscal 2026
GAAP operating margin
21% +/-
Stock-based compensation
9 %
Amortization of acquisition-related intangibles
3 %
Restructuring charges
1 %
Non-GAAP operating margin
34% +/-
Effective tax rate:
Q3 2026
Fiscal 2026
GAAP effective tax rate
23.0 %
23.0 %
Stock-based compensation (low – high end of range)
(2%) – 1%
(2%) – 0%
Amortization of acquisition-related intangibles (low – high end of range)
(1%) – 0%
(1%) – 0%
Non-GAAP effective tax rate
21.0 %
20.0 %
Diluted earnings per share:
Q3 2026
Fiscal 2026
Low
High
Low
High
GAAP diluted earnings per share (low – high end of range)
$ 0.19
$ 0.34
$ 2.66
$ 2.81
Stock-based compensation
0.34
0.34
1.34
1.34
Amortization of acquisition-related intangibles
0.11
0.11
0.43
0.43
Restructuring charges
—
—
0.13
0.13
Income tax adjustments
(0.08)
(0.08)
(0.26)
(0.26)
Non-GAAP diluted earnings per share (low – high end of range)
$ 0.56
$ 0.71
$ 4.30
$ 4.45
Weighted-average shares outstanding – diluted (in thousands)
95,000
95,000
95,700
95,700
Investor Contact:
Peter Goldmacher
415-254-7415
peter.goldmacher@dolby.com
Media Contact:
media@dolby.com
View original content to download multimedia:https://www.prnewswire.com/news-releases/dolby-laboratories-reports-second-quarter-2026-financial-results-302759263.html
SOURCE Dolby Laboratories, Inc.
In HelloNation, Senior Living Experts Rusty and Kelly Ackerman Explain What Families Should Ask a Senior Living Community
Suzano Selects Avondale Global Gateway as Gulf Coast Hub, Bringing Regular Wood Pulp Imports Back to Louisiana for First Time in More Than 30 Years
Dolby Laboratories Reports Second Quarter 2026 Financial Results
Send Rakhi to UK swiftly with UK Gifts Portal
Whiteboard Series with NEAR | Ep: 45 Joel Thorstensson from ceramic.network
New Gooseneck Omni Antennas Offer Enhanced Signals in a Durable Package
Why You Should Build on #NEAR – Co-founder Illia Polosukhin at CV Labs
Whiteboard Series with NEAR | Ep: 45 Joel Thorstensson from ceramic.network
NEAR End of Year Town Hall 2021: The Open Web World, MetaBUILD 2 Hackathon and 2021 recap
Trending
-
Coin Market5 days ago
US DOJ sentences man to 70 months in prison for role in $263M scam group
-
Technology5 days agoDJI Launches Beginner-Friendly Camera Drone Series with Lito X1 and Lito 1
-
Technology4 days agoNeusoft Showcases Full-Stack & Global Innovations at Auto China 2026
-
Coin Market3 days agoPrice predictions 4/27: SPX, DXY, BTC, ETH, XRP, BNB, SOL, DOGE, HYPE, ADA
-
Technology5 days agoLianlian DigiTech Returns to Money20/20 Asia to Expand Partnerships, Share Industry Trends, and Explore AI-Enabled Global Financial Infrastructure
-
Technology5 days agoWorld IP Day 2026: PitchMark launches Ideas.Exchange to help creators safeguard and license ideas in the age of AI
-
Coin Market4 days ago
Trump’s official memecoin extends slide as he hosts exclusive investor gala
-
Coin Market4 days ago
Ethereum Foundation unstakes 17K ETH after nearing 70K staked ETH milestone
