Technology
S&P 500 Q3 2024 Buybacks Decrease 4.0% from Q2 2024, as 12-month Expenditure Increases 4.7% from Previous Year; Earnings Per Share Increases from Buybacks Improves; Buybacks Tax Results in a 0.42% Reduction in Q3 Operating Earnings and 0.48% Reduction in Q3 Earnings
Published
1 year agoon
By
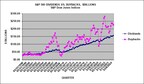
S&P 500 Q3 2024 buybacks were $226.6 billion, down 4.0% from Q2 2024’s $235.9 billion and up 22.1% from Q3 2023’s $185.6 billionThe 12-month September 2024 expenditure of $918.4 billion was up 16.7% from the prior 12-month expenditure of $787.3 billion Consumer Discretionary increased spending by 13.5%, as Information Technology and Health Care reduced their spending by 6.4% and 10.2% respectively The net buyback 1% tax reduced Q3 2024 operating earnings by 0.42% and As Reported GAAP by 0.48%
NEW YORK, Dec. 13, 2024 /PRNewswire/ — S&P Dow Jones Indices (S&P DJI) today announced the preliminary S&P 500® stock buybacks or share repurchases data for Q3 2024.
Historical data on S&P 500 buybacks is available at www.spdji.com/indices/equity/sp-500.
Key Takeaways:
Q3 2024 share repurchases were $226.6 billion, down 4.0% from Q2 2024’s $235.9 billion expenditure, and up 22.1% from Q3 2023’s $185.6 billion.For the 12-months ending September 2024, buybacks were $918.4 billion, up from $787.3 billion for the prior 12-month September 2023 period; the 12-month peak was in June 2022 with $1.005 trillion.332 companies reported buybacks of at least $5 million for the quarter, up from 324 in Q2 2024 and up from 281 in Q3 2023; 381 companies did some buybacks for the quarter, up from 373 in Q2 2024 and up from 362 in Q3 2023; 425 companies did some buybacks in the last 12-month period, up from 420 in the prior 12-month period.Buybacks remained top heavy, as concentration increased, with the top 20 S&P 500 companies accounting for 53.2% of Q3 2024 buybacks, up from Q2 2024’s 52.3%, and above the historical average of 47.6% and the pre-COVID historical average of 44.5%.13.7% of companies reduced share counts used for earnings per share (EPS) by at least 4% year-over-year, up from Q2 2024’s 12.7% and down from Q3 2023’s 13.8%; for Q3 2024 174 issues increased their shares used for EPS over Q2 2024, and 277 reduced them.S&P 500 Q3 2024 dividends increased 2.4% to a record $157.0 billion from Q2 2024’s $153.4 billion and were 8.9% greater than the $144.2 billion in Q3 2023.For the 12-month’s ending September, dividends set a record $616.2 billion payments, up 6.2% on an aggregate basis from the prior 12-month September 2023’s $580.2 billion.Total shareholders return of buybacks and dividends decreased to $383.6 billion in Q3 2024, down 1.5% from Q2 2024’s $389.3 billion and up 16.3% from Q3 2023’s $329.8 billion.Total shareholder returns for the 12-months ending September 2024 increased 12.2% to $1.535 trillion from the prior 12-month periods $1.367 trillion.The 1% tax on net buybacks, which started in 2023, reduced the Q3 2024 S&P 500 operating earnings by 0.42%, down from Q2 2024’s 0.45%, as it reduced As Reported GAAP earnings by 0.48%, down from the prior 0.49%. For the 12-month September 2024 period, the 1% tax on net buybacks reduced earnings by 0.45% for operating and 0.50% for As Reported.
“After declining in 2023, companies have increased their buyback expenditure, but have remained in a dollar range for the first three quarters of 2024. This was amidst significant stock price increases with the result being fewer shares purchased and less of an upward EPS push. Additionally, with big-cap stocks up nearly 30% year-to-date, it is difficult for companies to keep up with that much of an increase in their buyback budget, especially with two-thirds paying dividends in addition to buybacks. However, Q4 2024 buybacks appear to have increased so far, even as stock prices have moved up, as companies’ stock-up on issues needed for employee options, and ahead of any uncertainty over 2025 buyback restrictions or an increase in the 1% buyback tax,” said Howard Silverblatt, Senior Index Analyst at S&P Dow Jones Indices.
1% Buyback Excise Tax:
The 1% excise tax on net buybacks reduced Q3 2024 operating earnings by 0.42%, down from Q2 2024’s 0.45% and up from the 0.39% for Q3 2023. The 12-month impact was 0.45%, up from the 12-month September 2023’s 41%. The tax on As Reported GAAP earnings impact decreased to 0.48%, down from Q2 2024’s 0.49% and up from Q3 2023’s 0.42%. The 12-month impact was 0.50%, up from September 2023’s 0.46%.
Silverblatt added: “The 1% tax remains a manageable expense and has not impacted overall buybacks at this point. However, given the initial 1% buyback tax had bipartisan support and remains an attractive cash generator, there is an expectation that some increase or potential change to the type of buybacks that are taxed will remain on the table as the U.S. budget negotiations start. Given the current corporate sensitivity to costs, a buyback tax rate of 2% to 2.5% was seen as impacting both buybacks and the EPS impact of share-count-reduction, which is already at a lower level due to higher stock prices. Under an increased tax, some of the expenditures may shift from buybacks to dividends. However, any shift would not be on a-dollar-for-dollar basis as dividends remain a long-term pure cash-flow item which must be incorporated into corporate budgets.”
Q3 2024 GICS® Sector Analysis:
Information Technology maintained its lead in buybacks, even as it decreased its expenditure by 6.4%, representing 28.2% of all buybacks for the quarter. Q3 2024 expenditures declined to $64.0 billion, compared to Q2 2024’s $68.4 billion, and was up 31.8% from Q3 2023’s $48.6 billion expenditure. For the 12-months ending September 2024, the sector increased its expenditure 23.4% to $249.5 billion, representing 26.8% of all S&P 500 buybacks, compared to $199.3 billion spent in the prior 12-month period ending September 2023, which represented 25.3% of all buybacks.
Financials decreased buybacks by 2.7% for Q3 2024 as it collectively spent $44.1 billion on buybacks, accounting for 19.4% of all S&P 500 buybacks. This was down for the quarter compared to Q2 2024’s expenditure of $45.3 billion, and up 50.3% from Q3 2023’s $29.3 billion. For the 12-month September 2024 period, Financials spent $161.8 billion, up from $131.4 billion for the prior 12-month period.
Healthcare decreased its Q3 2024 expenditure by 10.2%, spending $16.9 billion, compared to the Q2 2024 expenditure of $18.8 billion, and was up 13.0% from the Q3 2023 $15.0 billion expenditure. For the 12-months ending September 2024, the sector spent $74.4 billion, down from the prior period’s expenditure of $76.0 billion.
Consumer Discretionary increased their spending in Q3 2024 by 13.5% to $20.6 billion, up from the prior $18.2 billion and up 9.5% from the Q3 2023 expenditure of $18.8 billion.
Energy increased their spending by 9.9% to $18.3 billion from Q2 2024’s $16.7 billion and was 12.8% higher than the $16.2 billion spent in Q3 2023.
Issues:
The five issues with the highest total buybacks for Q3 2024 were:
Apple (AAPL): continued to dominate the issue level buybacks, as it again spent the most of any issue with its Q3 2024 expenditure, ranking as the 4th highest in S&P 500 history. For the quarter, the company spent $25.4 billion, down from Q2 2024’s $28.8 billion (which is the largest in index history). Apple holds 18 of the top 20 record quarters (Meta Platforms holds #16 and QUALCOMM holds #18). For the 12-months ending September 2024, Apple spent $100.4 billion on buybacks, up from the prior 12-month period’s $83.0 billion. Over the five-year period, Apple has spent $448 billion, and $695 billion over the ten-year period.Alphabet (GOOG/L): $15.3 billion for Q3 2024, down from $15.7 billion in Q2 2024; the 12-month expenditure was $62.9 billion versus the prior expenditure of $60.7 billion.NVIDA (NVDA): $12.7 billion for Q3 2024, up from $8.8 billion in Q2 2024; the 12-month expenditure was $34.5 billion versus $10.4 billion.Meta Platforms (META): $12.4 billion for Q3 2024, up from $9.5 billion in Q2 2024; the 12-month expenditure was $48.2 billion versus $26.1 billion.JP Morgan (JPM): $6.4 billion for Q3 2024, up from $5.3 billion in Q2 2024; the 12-month expenditure was $16.8 billion versus $7.5 billion.
For more information about S&P Dow Jones Indices, please visit https://www.spglobal.com/spdji/en/.
S&P Dow Jones Indices
S&P 500 proforma net buyback tax impact
TAX
TAX % OF
TAX % OF
$ BILLIONS
OPERATING
AS REPORTED
12 Mo Sep,’24
$8.50
0.45 %
0.50 %
12 Mo Sep,’23
$7.16
0.41 %
0.46 %
9/30/2024
$2.11
0.42 %
0.48 %
6/30/2024
$2.20
0.45 %
0.49 %
3/31/2024
$2.18
0.47 %
0.54 %
2023
$7.24
0.40 %
0.45 %
2022 proforma
$8.47
0.51 %
0.58 %
2021 proforma
$7.93
0.45 %
0.47 %
S&P Dow Jones Indices
S&P 500, $ U.S. BILLIONS
(preliminary in bold)
PERIOD
MARKET
OPERATING
AS REPORTED
DIVIDEND &
VALUE
EARNINGS
EARNINGS
DIVIDENDS
BUYBACKS
DIVIDEND
BUYBACK
BUYBACK
$ BILLIONS
$ BILLIONS
$ BILLIONS
$ BILLIONS
$ BILLIONS
YIELD
YIELD
YIELD
12 Mo Sep,’24 Prelim.
$48,701
$1,902.69
$1,685.91
$616.16
$918.40
1.27 %
1.89 %
3.15 %
12 Mo Sep,’23
$35,938
$1,756.47
$1,541.07
$580.21
$787.26
1.61 %
2.19 %
3.81 %
2023
$40,039
$1,787.36
$1,610.73
$588.23
$795.16
1.47 %
1.99 %
3.46 %
2022
$32,133
$1,656.66
$1,453.43
$564.57
$922.68
1.76 %
2.87 %
4.63 %
2021
$40,356
$1,762.75
$1,675.22
$511.23
$881.72
1.27 %
2.18 %
3.45 %
2020
$31,659
$1,019.04
$784.21
$483.18
$519.76
1.53 %
1.64 %
3.17 %
2019
$26,760
$1,304.76
$1,158.22
$485.48
$728.74
1.81 %
2.72 %
4.54 %
2018
$21,027
$1,281.66
$1,119.43
$456.31
$806.41
2.17 %
3.84 %
6.01 %
9/30/2024 Prelim
$48,701
$502.01
$441.41
$157.04
$226.56
1.27 %
1.89 %
3.15 %
6/28/2024
$45,843
$489.95
$445.96
$153.41
$235.93
1.32 %
1.91 %
3.23 %
3/28/2024
$44,078
$458.28
$397.38
$151.61
$236.82
1.35 %
1.85 %
3.20 %
12/31/2023
$40,039
$452.44
$401.16
$154.10
$219.09
1.47 %
1.99 %
3.46 %
9/30/2023
$35,938
$437.90
$399.35
$144.18
$185.62
1.61 %
2.19 %
3.81 %
6/30/2023
$37,162
$457.93
$405.66
$143.20
$174.92
1.55 %
2.19 %
3.74 %
3/31/2023
$34,342
$439.08
$404.57
$146.76
$215.53
1.67 %
2.50 %
4.17 %
12/31/2022
$32,133
$421.55
$331.50
$146.07
$211.19
1.76 %
2.87 %
4.63 %
9/30/2022
$30,119
$422.94
$373.04
$140.34
$210.84
1.83 %
3.26 %
5.09 %
6/30/2022
$31,903
$395.02
$360.21
$140.56
$219.64
1.70 %
3.15 %
4.85 %
3/31/2022
$38,288
$417.16
$388.68
$137.60
$281.01
1.37 %
2.57 %
3.94 %
12/31/2021
$40,356
$480.35
$456.72
$133.90
$270.10
1.27 %
2.18 %
3.45 %
9/30/2021
$36,538
$441.26
$420.64
$130.04
$234.64
1.37 %
2.03 %
3.40 %
S&P Dow Jones Indices
S&P 500 SECTOR BUYBACKS
SECTOR $ MILLIONS
Q3,’24
Q2,’24
Q3,’23
12MoSep,’24
12MoSep,’23
5-YEARS
10-YEARS
Consumer Discretionary
$20,605
$18,156
$18,809
$83,536
$73,592
$365,235
$791,744
Consumer Staples
$7,734
$10,466
$5,014
$39,240
$22,595
$161,100
$369,936
Energy
$18,313
$16,669
$16,233
$65,200
$73,623
$204,808
$293,020
Financials
$44,054
$45,286
$29,303
$161,844
$131,433
$713,734
$1,334,993
Healthcare
$16,906
$18,825
$14,960
$74,441
$75,956
$379,165
$789,673
Industrials
$15,852
$16,829
$14,286
$76,647
$63,513
$305,574
$659,760
Information Technology
$63,981
$68,356
$48,554
$245,911
$199,264
$1,163,809
$2,035,428
Materials
$4,454
$5,192
$5,278
$17,849
$18,753
$92,855
$154,619
Real Estate
$204
$728
$853
$1,795
$2,178
$11,644
$21,673
Communication Services
$33,818
$34,478
$32,020
$148,137
$124,343
$589,004
$641,074
Utilities
$636
$940
$306
$3,797
$2,010
$13,284
$22,427
TOTAL
$226,557
$235,926
$185,615
$918,398
$787,260
$4,000,212
$7,114,347
SECTOR BUYBACK MAKEUP %
Q3,’24
Q2,’24
Q3,’23
12MoSep,’24
12MoSep,’23
5-YEARS
10-YEARS
Consumer Discretionary
9.09 %
7.70 %
10.13 %
9.10 %
9.35 %
9.13 %
11.13 %
Consumer Staples
3.41 %
4.44 %
2.70 %
4.27 %
2.87 %
4.03 %
5.20 %
Energy
8.08 %
7.07 %
8.75 %
7.10 %
9.35 %
5.12 %
4.12 %
Financials
19.44 %
19.20 %
15.79 %
17.62 %
16.69 %
17.84 %
18.76 %
Healthcare
7.46 %
7.98 %
8.06 %
8.11 %
9.65 %
9.48 %
11.10 %
Industrials
7.00 %
7.13 %
7.70 %
8.35 %
8.07 %
7.64 %
9.27 %
Information Technology
28.24 %
28.97 %
26.16 %
26.78 %
25.31 %
29.09 %
28.61 %
Materials
1.97 %
2.20 %
2.84 %
1.94 %
2.38 %
2.32 %
2.17 %
Real Estate
0.09 %
0.31 %
0.46 %
0.20 %
0.28 %
0.29 %
0.30 %
Communication Services
14.93 %
14.61 %
17.25 %
16.13 %
15.79 %
14.72 %
9.01 %
Utilities
0.28 %
0.40 %
0.16 %
0.41 %
0.26 %
0.33 %
0.32 %
TOTAL
100.00 %
100.00 %
100.00 %
100.00 %
100.00 %
100.00 %
100.00 %
S&P Dow Jones Indices
S&P 500 20 LARGEST Q3 2024 BUYBACKS, $ MILLIONS
Company
Ticker
Sector
Q3 2024
Q2 2024
Q3 2023
12-Months
12-Months
5-Year
10-Year
Indicated
Buybacks
Buybacks
Buybacks
Sep,’24
Sep,’23
Buybacks
Buybacks
Dividend
$ Million
$ Million
$ Million
$ Million
$ Million
$ Million
$ Million
$ Million
Apple
AAPL
Information Technology
$25,361
$28,810
$21,315
$100,390
$82,981
$447,515
$695,312
$15,204
Alphabet
GOOGL
Communication Services
$15,291
$15,684
$15,787
$62,862
$60,720
$254,992
$286,684
$4,687
NVIDIA
NVDA
Information Technology
$12,676
$8,795
$4,570
$34,463
$10,373
$57,727
$63,828
$984
Meta Platforms
META
Communication Services
$12,361
$9,507
$5,657
$48,203
$26,141
$160,186
$186,187
$4,369
JPMorgan Chase
JPM
Financials
$6,361
$5,336
$2,382
$16,804
$7,549
$59,191
$128,042
$14,226
Visa
V
Financials
$5,867
$4,535
$3,756
$16,921
$12,231
$57,955
$91,193
$3,942
Exxon Mobil
XOM
Energy
$5,512
$5,326
$4,412
$18,505
$17,767
$47,485
$57,614
$17,594
Chevron
CVX
Energy
$4,714
$2,930
$3,334
$13,932
$14,698
$37,297
$41,992
$11,090
Microsoft
MSFT
Information Technology
$4,107
$4,210
$4,831
$16,530
$21,503
$121,743
$196,231
$24,678
Bank of America
BAC
Financials
$3,534
$3,535
$1,000
$10,380
$4,763
$59,117
$119,907
$7,021
Wells Fargo
WFC
Financials
$3,435
$6,012
$1,480
$17,798
$9,507
$59,433
$128,399
$5,446
Aptiv
APTV
Consumer Discretionary
$3,076
$431
$0
$4,429
$129
$4,759
$8,387
$0
Mastercard
MA
Financials
$2,935
$2,643
$1,908
$9,580
$9,699
$37,409
$59,130
$2,178
Marathon Petroleum
MPC
Energy
$2,701
$2,896
$2,819
$10,320
$9,067
$30,860
$39,248
$1,218
Adobe
ADBE
Information Technology
$2,668
$2,635
$1,120
$8,727
$5,604
$28,760
$37,203
$0
Cisco Systems
CSCO
Information Technology
$2,168
$2,242
$1,453
$7,496
$5,679
$28,141
$81,114
$6,446
Comcast
CMCSA
Communication Services
$1,990
$2,266
$3,543
$10,441
$11,285
$36,817
$62,107
$4,790
Procter & Gamble
PG
Consumer Staples
$1,939
$1,516
$1,500
$5,445
$4,853
$39,715
$63,805
$9,487
American Express
AXP
Financials
$1,935
$1,762
$1,400
$5,890
$3,389
$22,044
$41,754
$1,573
PayPal Holdings
PYPL
Financials
$1,817
$1,564
$1,459
$5,688
$5,645
$21,744
$29,565
$0
Top 20
$120,448
$112,635
$83,726
$424,804
$323,583
$1,612,890
$2,417,702
$134,933
S&P 500
$226,557
$235,926
$185,615
$918,398
$787,260
$4,000,212
$7,114,347
$631,944
Top 20 % of S&P 500
53.16 %
47.74 %
45.11 %
46.25 %
41.10 %
40.32 %
33.98 %
21.35 %
Gross values are not adjusted for float
S&P Dow Jones Indices
S&P 500 Q3 2024 Buyback Report
SECTOR
DIVIDEND
BUYBACK
COMBINED
YIELD
YIELD
YIELD
Consumer Discretionary
0.62 %
1.44 %
2.06 %
Consumer Staples
2.42 %
1.42 %
3.84 %
Energy
3.23 %
3.83 %
7.06 %
Financials
1.42 %
2.30 %
3.72 %
HealthCare
1.70 %
1.40 %
3.10 %
Industrials
1.31 %
1.77 %
3.08 %
Information Technology
0.59 %
1.51 %
2.10 %
Materials
1.85 %
1.73 %
3.58 %
Real Estate
3.24 %
0.16 %
3.40 %
Communications Services
0.99 %
3.84 %
4.83 %
Utilities
2.90 %
0.35 %
3.25 %
S&P 500
1.25 %
1.82 %
3.06 %
Uses full values (unadjusted for float)
Dividends based on indicated; buybacks based on the last 12-months ending Q3,’24
Share Count Changes
(Y/Y diluted shares used for EPS)
>=4%
<=-4%
Q3 2024
4.84 %
13.71 %
Q2 2024
5.04 %
12.70 %
Q1 2024
4.62 %
13.25 %
Q4 2023
3.81 %
12.63 %
Q3 2023
4.60 %
13.80 %
Q2 2023
4.22 %
16.27 %
Q1 2023
4.02 %
18.47 %
Q4 2022
5.01 %
19.44 %
Q3 2022
7.21 %
21.24 %
Q2 2022
8.42 %
19.84 %
Q1 2022
7.62 %
17.64 %
Q4 2021
10.06 %
14.89 %
Q3 2021
10.22 %
7.41 %
ABOUT S&P DOW JONES INDICES
S&P Dow Jones Indices is the largest global resource for essential index-based concepts, data and research, and home to iconic financial market indicators, such as the S&P 500® and the Dow Jones Industrial Average®. More assets are invested in products based on our indices than products based on indices from any other provider in the world. Since Charles Dow invented the first index in 1884, S&P Dow Jones Indices has been innovating and developing indices across the spectrum of asset classes helping to define the way investors measure and trade the markets.
S&P Dow Jones Indices is a division of S&P Global (NYSE: SPGI), which provides essential intelligence for individuals, companies, and governments to make decisions with confidence. For more information, visit: https://www.spglobal.com/spdji/en/.
S&P Dow Jones Indices Media Contacts:
April Kabahar
(+1) 917 796 3121
april.kabahar@spglobal.com
Alyssa Augustyn
(+1) 773 919 4732
alyssa.augustyn@spglobal.com
S&P Dow Jones Indices Index Services:
Howard Silverblatt
Senior Index Analyst
(+1) 973 769 2306
howard.silverblatt@spglobal.com
View original content to download multimedia:https://www.prnewswire.com/news-releases/sp-500-q3-2024-buybacks-decrease-4-0-from-q2-2024–as-12-month-expenditure-increases-4-7-from-previous-year-earnings-per-share-increases-from-buybacks-improves-buybacks-tax-results-in-a-0-42-reduction-in-q3-operating-earning-302331086.html
SOURCE S&P Dow Jones Indices
You may like
Technology
Asian American Engineer of the Year Award and Conference Announces First Phase of 2025-2026 Awardees
Published
2 hours agoon
May 2, 2026By
SANTA CLARA, Calif., May 1, 2026 /PRNewswire/ — The Asian American Engineer of the Year Award (AAEOY) Executive Committee announces the AAEOY 2025-2026 first phase awardees as follows:
Distinguished Lifetime Achievement Award
Mr. Lip-Bu Tan, CEO, Intel Corporation
Distinguished Leadership in Science and Technology Award
Dr. Arun Majumdar, Dean of the Stanford Doerr School of Sustainability, Stanford University
Executive of the Year Award
Dr. Xiaodong Che, Chief Technology Officer, Western DigitalDr. Sam Heidari, CEO, LumotiveDr. Jungwon Lee, Corporate Executive Vice President, Samsung ElectronicsDr. Liu Ren, Vice President & Chief Scientist, Bosch ResearchMr. Brandon Wang, Vice President, Synopsys
Engineer of the Year Award
Ms. Vivian Ye, Principal Member of Technical Staff, AT&T
Most Promising Engineer of the Year Award
Mr. Max Fang, Director of Architecture, AmbarellaMr. Johnny Ho, CSO & Co-founder, Perplexity AI
The AAEOY Award has been presented annually since 2002 as a cornerstone of the National Engineers Week program, honoring distinguished Asian American professionals across academia, public service, and industry. Since its inception, the AAEOY has recognized over 300 honorees — including nine Nobel Laureates, pioneering scholars, prominent corporate executives, and an astronaut — serving as a beacon of inspiration for the global STEM community. After a series of impactful ceremonies nationwide, the 2025-2026 AAEOY Award and Conference returns to the heart of innovation in Silicon Valley at the Santa Clara Convention Center on September 18-19, 2026.
For more information regarding the AAEOY program, awardees, and event registration, please visit www.aaeoy.org.
The Chinese Institute of Engineers in USA (CIE-USA), founded in 1917, is a nonprofit professional organization that promotes science, technology, engineering, and mathematics (STEM); supports professional advancement and leadership development; and recognizes the achievements of Asian American professionals through flagship programs such as the Asian American Engineer of the Year (AAEOY) Awards. One of the oldest and most prestigious Chinese American engineering associations in the United States, CIE-USA has seven regional chapters nationwide and hosts events throughout the year.
View original content to download multimedia:https://www.prnewswire.com/news-releases/asian-american-engineer-of-the-year-award-and-conference-announces-first-phase-of-2025-2026-awardees-302760569.html
SOURCE AAEOY
Technology
Larry Kellerman, Fermi’s Chief Power Officer and Architect of Its 17 GW Energy Infrastructure, Accepts Board Nomination
Published
2 hours agoon
May 2, 2026By
DALLAS, May 1, 2026 /PRNewswire/ — Toby Neugebauer, co-founder and largest shareholder of Fermi America (NASDAQ & LSE: FRMI), today announced that he has nominated Larry Kellerman to join the Fermi Board of Directors. Kellerman, who serves as Chief Power Officer at Fermi America, is the architect of the Company’s 17-gigawatt powered data center campus in Amarillo, Texas — the largest private energy grid in America.
Kellerman is co-founder and Managing Partner of Twenty First Century Utilities and brings more than four decades of power industry and finance expertise to the role. His career spans senior leadership positions at Goldman Sachs, El Paso Corporation, and I Squared Capital. Kellerman said he was honored by the nomination and would be pleased to serve if approved by the Board.
“I appreciate everything that Toby has manifested in Fermi and know that no other human could have created the enterprise and its many thoughtfully interconnected elements as quickly, as effectively, and in as value-accretive a manner as Toby’s leadership has been able to deliver.”
— Larry Kellerman, Chief Power Officer and Board Nominee, Fermi America
For Neugebauer, the choice was crystal clear. Kellerman, who has worked alongside Neugebauer since the earliest days of Project Matador knows Fermi’s power story better than anyone.
“When I came up with the idea of Project Matador, I knew that Larry Kellerman was the one person I needed to convert a really great idea into a really great reality. His knowledge of power and the future of powering data centers is unmatched. Larry is uniquely qualified to steward Fermi as a Board member, and I couldn’t be more pleased with his willingness to serve.”
— Toby Neugebauer, Co-Founder, Fermi America
View original content:https://www.prnewswire.com/news-releases/larry-kellerman-fermis-chief-power-officer-and-architect-of-its-17-gw-energy-infrastructure-accepts-board-nomination-302760575.html
SOURCE Toby Neugebauer
Technology
EAST SIDE GAMES GROUP ANNOUNCES NON-BROKERED PRIVATE PLACEMENT OF UNITS TO RAISE UP TO $3.5 MILLION
Published
2 hours agoon
May 2, 2026By
VANCOUVER, BC, May 1, 2026 /CNW/ – East Side Games Group (TSX: EAGR) (OTC: EAGRF) (the “Company”), Canada’s leading free-to-play mobile game group, announces a non-brokered private placement of 31,818,182 units (a “Unit”) at $0.11 per Unit (the “Unit Price”), for total gross proceeds of up to $3.5 million.
Each Unit will be comprised of one common share and one full whole warrant (a “Warrant”). Each whole Warrant will be exercisable at $0.14 per share (the “Exercise Price”) for a period of three years from issuance. The Warrants will be subject to standard anti-dilution adjustments.
The private placement will be offered in reliance on prospectus exemptions, and any securities sold will be subject to a four month statutory hold period. The private placement is not anticipated to have any material impact on the control of the Company, nor is it anticipated that any new control persons would be created as a result of the private placement.
It is anticipated that Derek Lew, a director of the Company, will participate in the private placement for an amount of $1.0 million for 9,090,909 Units. As at the date of this news release, Mr. Lew holds 1,667,244 common shares of the Company (2.17%). If the private placement is completed as anticipated, Mr. Lew will hold 10,758,153 common shares (representing 9.89% of the common shares anticipated to be outstanding upon completion of the private placement on a partially diluted basis), 9,090,909 Warrants and 250,000 incentive stock options. Upon exercise of his Warrants, Mr. Lew would own 19,849,062 common shares representing 16.84% of the then issued and outstanding common shares assuming no other share issuances.
The TSX Company Manual requires shareholder approval be obtained for private placements if the maximum number of common shares issuable under the private placement represents an amount that is more than 25% of the total outstanding common shares as at the date of the press release (pursuant to Section 607(g)). Disinterested shareholder approval must be obtained (excluding those shareholders participating in this private placement and their associates and affiliates) if the number of common shares issued and issuable to insiders under a private placement exceeds 10% of the Company’s issued and outstanding common shares as of the date hereof (pursuant to Section 607(g)(ii)).
As: (a) the private placement is for up to 31,818,182 Units (being equivalent to 41.35% of the Company’s outstanding shares as at the date of this press release), (b) Mr. Lew’s subscription for 9,090,909 Units represents an amount that is equivalent to 11.81% of the Company’s outstanding shares as at the date of this press release, and (c) the Warrants comprising the Units have an exercise price of $0.14 per share (and the five day VWAP is $0.144 per share), the Company has obtained written consent from Jason Bailey, the Company’s CEO and a director, in support of the private placement in accordance with Section 604(d) of the TSX Company Manual. Mr. Bailey holds more than 50% of the Company’s outstanding shares as at the date of this press release.
The net proceeds from the private placement will be used to repay indebtedness owing to the Royal Bank of Canada (RBC) and for operating expenses and general working capital. Mr. Bailey commented, “With this funding in place, we are on solid footing to continue our disciplined approach to completing the business’s turnaround. With our core portfolio of well performing titles, we have a solid foundation to rebuild upon. We feel we have a strong runway, pipeline and team to execute toward a positive 2026,” [and] “I’d like to thank our existing shareholders for their support and guidance through a difficult 2025 and look forward to achieving the results that will allow this Company, our capital markets strategy and employees to reach its potential.”
The Company’s board of directors considers the private placement to be in the best interests of its shareholders, after having taken into account other alternative forms of financing. In the course of its review, the Company considered other replacement debt financing, the Company’s ongoing cashflow from operations, as well as ongoing operating expenses, one-off necessary expenditures and the Company’s debt load, within the larger context of the analysis detailed in its press release dated March 31, 2026 as to the re-orienting of the Company’s overall business strategy.
The Company anticipates that the private placement will close on or before May 8, 2026, subject to acceptance by the TSX.
The Company reserves the right to pay finder’s fees in the form of common shares (in lieu of cash fees) and broker warrants to arm’s length finders in connection with the private placement to arm’s length parties, in accordance with TSX policies. No finder’s fee will be paid to any non-arm’s length parties, nor with respect to subscriptions from non-arm’s length parties. A maximum number of 1,363,636 common shares (to be issued at $0.11 per share for a total value of $150,000) and a maximum number of 1,254,545 broker warrants will be issuable, assuming the private placement is fully subscribed. Each broker warrant will entitle the holder to acquire one common share at $0.14 per common share (the “Broker Warrant Exercise Price”) for a period of three years form issuance.
The maximum number of securities issuable under the private placement is 66,254,545 common shares, comprising 31,818,182 common shares comprising the Units, 31,818,182 common shares issuable upon exercise of the Warrants, 1,363,636 common shares to be issued as finder’s fees, and 1,254,545 common shares issuable upon exercise of the broker warrants, which represents an amount equivalent to 86.10% of the total outstanding common shares as at the date of this press release on a non-diluted basis, without taking into effect the private placement itself, or approximately 46.27% of the Company’s total issued and outstanding common shares following completion of the private placement (being 143,200,825 shares anticipated to be outstanding on a partially diluted basis, assuming the private placement is fully subscribed, full issuance of the finder’s fee shares and full exercise of the Warrants and broker warrants). The Unit Price represents a 22% discount to the Company’s five-day volume-weighted trading price of its common shares on the TSX as at the time of submitting the Company’s application to TSX (the “Market Price”). Market Price and the Exercise Price and the Broker Warrant Exercise Price represent a 2.47% discount to the Market Price.
The total number of common shares expected to be issued to insider (Mr. Lew) under the private placement is 18,181,818 (consisting of 9,090,909 common shares and 9,090,909 common shares issuable upon full exercise of Warrants), representing 23.63% of the total outstanding common shares as at the date of this press release on a non-diluted basis, without taking into effect the private placement itself, or 12.70% of the Company’s total issued and outstanding common shares following completion of the private placement (being 143,200,825 shares anticipated to be outstanding on a partially diluted basis, assuming the private placement is fully subscribed, full issuance of the finder’s fee shares and full exercise of the Warrants and the broker warrants).
This press release does not constitute an offer to sell or a solicitation of an offer to buy any securities in the United States. The securities have not been and will not be registered under the United States Securities Act of 1933, as amended (the “U.S. Securities Act”), or any state securities laws, and may not be offered or sold within the United states or to U.S. persons unless registered under the U.S. Securities Act and applicable state securities laws, or an exemption from such registration is available.
ABOUT EAST SIDE GAMES GROUP
ESGG is a leader in free-to-play mobile gaming, thrilling players with unforgettable experiences that spark lifelong fandom. Fueled by an entrepreneurial spirit, we are driven by creativity, flawless execution, and a laser-focused strategy. We develop and publish both original and licensed IP titles, license our cutting-edge GameKit(s) platforms, and strategically acquire studios or games to expand our family.
Headquartered in Vancouver with around 100 talent-dense team members, we operate over a dozen titles under East Side Games (“ESG”) and LDRLY (Technologies) Inc. (“LDRLY”). Together, we’re crafting, launching, and publishing mobile games across our own studios and an extended Game Kit partner network-reaching players on iOS and Android worldwide.
We power our success through in-app purchases (“IAP”) — offering exclusive, game-enhancing virtual items — and in-game advertising. To keep growing, we focus on captivating audiences, keeping them engaged, and unlocking exciting new ways to monetize. We’ll drive this momentum by launching bold new titles, enriching our current lineup, innovating discovery, expanding into fresh markets, and exploring new distribution platforms.
Additional information about the Company continues to be available under its legal name, East Side Games Group Inc., at www.sedarplus.ca.
Forward-looking Information
Certain statements in this news release constitute forward-looking information or forward-looking statements within the meaning of applicable securities laws. Forward-looking statements are often, but not always, identified by the use of words such as “expects,” “anticipates,” “plans,” “intends,” “believes,” “estimates,” “projects,” “may,” “will,” “would,” “could,” “should,” and similar expressions. Forward-looking statements in this news release include, without limitation, statements regarding the proposed private placement.
Forward-looking statements are based on management’s current expectations, estimates, projections and assumptions. Such forward-looking statements are subject to significant risks, uncertainties and other factors that could cause actual results or events to differ materially from those expressed or implied by such statements, including, without limitation, risks relating to the Company’s ability to complete the proposed private placement as described, and relating to general economic, market and industry conditions. Readers are cautioned not to place undue reliance on forward-looking statements. The forward-looking statements contained in this news release are made as of the date hereof, and the Company undertakes no obligation to update or revise any forward-looking statements, whether as a result of new information, future events or otherwise, except as required by applicable law.
SOURCE East Side Games Group Inc.
Asian American Engineer of the Year Award and Conference Announces First Phase of 2025-2026 Awardees
Larry Kellerman, Fermi’s Chief Power Officer and Architect of Its 17 GW Energy Infrastructure, Accepts Board Nomination
EAST SIDE GAMES GROUP ANNOUNCES NON-BROKERED PRIVATE PLACEMENT OF UNITS TO RAISE UP TO $3.5 MILLION
Send Rakhi to UK swiftly with UK Gifts Portal
Whiteboard Series with NEAR | Ep: 45 Joel Thorstensson from ceramic.network
New Gooseneck Omni Antennas Offer Enhanced Signals in a Durable Package
Why You Should Build on #NEAR – Co-founder Illia Polosukhin at CV Labs
Whiteboard Series with NEAR | Ep: 45 Joel Thorstensson from ceramic.network
NEAR End of Year Town Hall 2021: The Open Web World, MetaBUILD 2 Hackathon and 2021 recap
Trending
-
Coin Market5 days ago
88 people charged over 12 crypto wrench attacks in France
-
Coin Market4 days agoPrice predictions 4/27: SPX, DXY, BTC, ETH, XRP, BNB, SOL, DOGE, HYPE, ADA
-
Technology5 days agoOMODA 4 Officially Rolls Off the Production Line: OMODA&JAECOO Sets Its Sights on a New Global Million-Unit Target
-
Technology5 days agoTeamViewer Advances Toward Autonomous Endpoint Management: Tia Now Generates Automations From Customers’ Own Proven Fixes
-
Coin Market3 days ago
Bitcoin price drops below $76K as onchain data sends mixed signals
-
Coin Market5 days ago
Western Union eyes May for its stablecoin USDPT rollout
-
Technology5 days agoBroadridge Transforming Financial Literacy in Ireland Through AI-Powered Communication
-
Technology5 days agoSungrow Unveils Full-Scenario Solution to Address Emerging Global Energy Challenges
