Second quarter summary:
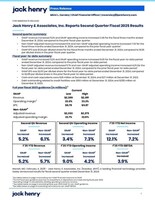
GAAP revenue increased 5.2% and GAAP operating income increased 3.4% for the fiscal three months ended December 31, 2024, compared to the prior fiscal year quarter.Non-GAAP adjusted revenue increased 6.1% and non-GAAP adjusted operating income increased 7.3% for the fiscal three months ended December 31, 2024, compared to the prior fiscal year quarter.1GAAP EPS was $1.34 per diluted share for the fiscal three months ended December 31, 2024, compared to $1.26 per diluted share in the prior fiscal year quarter.
Fiscal year-to-date summary:
GAAP revenue increased 5.2% and GAAP operating income increased 9.0% for the fiscal year-to-date period ended December 31, 2024, compared to the prior fiscal year-to-date period.Non-GAAP adjusted revenue increased 5.7% and non-GAAP adjusted operating income increased 4.2% for the fiscal year-to-date period ended December 31, 2024, compared to the prior fiscal year-to-date period.1GAAP EPS was $2.97 per diluted share for the fiscal year-to-date period ended December 31, 2024, compared to $2.65 per diluted share in the prior fiscal year-to-date period.Cash and cash equivalents were $26 million at December 31, 2024, and $27 million at December 31, 2023.Debt outstanding related to credit facilities was $150 million at December 31, 2024, and $255 million at December 31, 2023.
Full year fiscal 2025 guidance (In millions):2
Current
GAAP
Low
High
Revenue
$2,369
$2,391
Operating margin3
23.0 %
23.2 %
EPS
$5.78
$5.87
Non-GAAP4
Adjusted revenue
$2,353
$2,375
Adjusted operating margin
22.7 %
22.8 %
MONETT, Mo., Feb. 4, 2025 /PRNewswire/ — Jack Henry & Associates, Inc. (Nasdaq: JKHY), a leading financial technology provider, today announced results for fiscal second quarter ended December 31, 2024.
1 See tables below on page 4 reconciling non-GAAP financial measures to GAAP.
2 The full fiscal year guidance assumes no acquisitions or dispositions are made during fiscal year 2025.
3 Operating margin is calculated by dividing operating income by revenue.
4 See tables below on page 9 reconciling fiscal year 2025 GAAP to non-GAAP guidance.
5 See table below on page 14 reconciling net income to non-GAAP EBITDA.
According to Greg Adelson, President and CEO, “We are pleased to report solid performance in the second quarter of our fiscal year. We continued our positive sales momentum with record sales attainment in Q2 for the second consecutive year while maintaining a robust sales pipeline for future opportunities. We are seeing strong demand for our products from both new and existing clients and are making substantial progress with our technology modernization strategy. Our focus on a people-first culture, service excellence, technology innovation, and a well-executed strategy continues to differentiate us in the market.”
Operating Results
Revenue, operating expenses, operating income, and net income for the three and six months ended December 31, 2024, compared to the three and six months ended December 31, 2023, were as follows:
Revenue
(Unaudited, in thousands)
Three Months Ended
December 31,
%
Change
Six Months Ended
December 31,
%
Change
2024
2023
2024
2023
Revenue
Services and Support
$ 323,027
$ 311,992
3.5 %
$ 679,706
$ 654,197
3.9 %
Percentage of Total Revenue
56.3 %
57.2 %
57.9 %
58.6 %
Processing
250,821
233,709
7.3 %
495,123
462,872
7.0 %
Percentage of Total Revenue
43.7 %
42.8 %
42.1 %
41.4 %
REVENUE
$ 573,848
$ 545,701
5.2 %
$ 1,174,829
$ 1,117,069
5.2 %
Services and support revenue increased for the three months ended December 31, 2024, primarily driven by growth in data processing and hosting revenue of 11.8%, partially offset by a decrease in deconversion revenue of $4,813. Processing revenue increased for the three months ended December 31, 2024, primarily driven by growth in card revenue of 6.5%, transaction and digital revenue of 10.0%, and payment processing revenue of 10.1%.Services and support revenue increased for the six months ended December 31, 2024, primarily driven by growth in data processing and hosting revenue of 12.2%, partially offset by a decrease in hardware and deconversion revenues of 31.1% and 58.2%, respectively. Processing revenue increased for the six months ended December 31, 2024, primarily driven by growth in card revenue of 5.8% and transaction and digital revenue of 10.4%. Another driver was an increase in payment processing revenues.For the three months ended December 31, 2024, core segment revenue increased 4.6%, payments segment revenue increased 5.4%, complementary segment revenue increased 5.6%, and corporate and other segment revenue increased 4.7%. For the three months ended December 31, 2024, core segment non-GAAP adjusted revenue increased 5.8%, payments segment non-GAAP adjusted revenue increased 6.2%, complementary segment non-GAAP adjusted revenue increased 6.5%, and corporate and other non-GAAP adjusted segment revenue increased 4.9% (see revenue lines of segment break-out tables on pages 5 and 6 below for a reconciliation of segment non-GAAP adjusted revenue to GAAP segment revenue).For the six months ended December 31, 2024, core segment revenue increased 4.8%, payments segment revenue increased 5.8%, complementary segment revenue increased 6.0%, and corporate and other segment revenue decreased 2.8%. For the six months ended December 31, 2024, core segment non-GAAP adjusted revenue increased 5.5%, payments segment non-GAAP adjusted revenue increased 6.0%, complementary segment non-GAAP adjusted revenue increased 6.8%, and corporate and other non-GAAP adjusted segment revenue decreased 2.8% (see revenue lines of segment break-out tables on pages 7 and 8 below for a reconciliation of segment non-GAAP adjusted revenue to GAAP segment revenue).
Operating Expenses and Operating Income
(Unaudited, in thousands)
Three Months Ended
December 31,
%
Change
Six Months Ended
December 31,
%
Change
2024
2023
2024
2023
Cost of Revenue
$ 332,850
$ 320,979
3.7 %
$ 676,282
$ 643,981
5.0 %
Percentage of Total Revenue6
58.0 %
58.8 %
57.6 %
57.6 %
Research and Development
41,095
35,478
15.8 %
80,780
72,370
11.6 %
Percentage of Total Revenue6
7.2 %
6.5 %
6.9 %
6.5 %
Selling, General, and Administrative
76,901
70,277
9.4 %
143,489
149,051
(3.7) %
Percentage of Total Revenue6
13.4 %
12.9 %
12.2 %
13.3 %
OPERATING EXPENSES
450,846
426,734
5.7 %
900,551
865,402
4.1 %
OPERATING INCOME
$ 123,002
$ 118,967
3.4 %
$ 274,278
$ 251,667
9.0 %
Operating Margin6
21.4 %
21.8 %
23.3 %
22.5 %
Cost of revenue increased for the three months ended December 31, 2024, primarily due to higher direct costs generally consistent with increases in the related lines of revenue and higher personnel costs including benefits expenses from an increase in employee headcount in the trailing twelve months. Cost of revenue increased for the six months ended December 31, 2024, primarily due to higher direct costs generally consistent with increases in the related lines of revenue, higher personnel costs including benefits expenses from an increase in employee headcount in the trailing twelve months, higher internal licenses and fees from increased deployments and prices, and a rise in amortization from capital development projects placed into service in the trailing twelve months.Research and development expense increased for the three and six months ended December 31, 2024, primarily due to higher personnel costs (net of capitalization) including benefits expenses from an increase in employee headcount in the trailing twelve months.Selling, general, and administrative expense increased for the three months ended December 31, 2024, primarily due to higher personnel costs including benefits expenses from an increase in employee headcount in the trailing twelve months. Selling, general, and administrative expense decreased for the six months ended December 31, 2024, primarily due to the decrease in non-recurring personnel costs when compared to the prior fiscal year period.
Net Income
(Unaudited, in thousands,
except per share data)
Three Months Ended
December 31,
%
Change
Six Months Ended
December 31,
%
Change
2024
2023
2024
2023
Income Before Income Taxes
$ 127,381
$ 120,223
6.0 %
$ 284,179
$ 253,471
12.1 %
Provision for Income Taxes
29,536
28,258
4.5 %
67,143
59,827
12.2 %
NET INCOME
$ 97,845
$ 91,965
6.4 %
$ 217,036
$ 193,644
12.1 %
Diluted earnings per share
$ 1.34
$ 1.26
6.2 %
$ 2.97
$ 2.65
12.0 %
Effective tax rates for the three months ended December 31, 2024, and 2023, were 23.2% and 23.5%, respectively. Effective tax rates for the six months ended December 31, 2024, and 2023, were 23.6% and 23.6%, respectively.
According to Mimi Carsley, CFO and Treasurer, “Our second quarter results included non-GAAP revenue growth of over 6%, led by our key revenue areas of public and private cloud and processing, which combined to grow by nearly 9%. That strong revenue growth and the leverage provided by our SaaS business model led to non-GAAP operating income growth of over 7%.”
6Operating margin is calculated by dividing operating income by revenue. Operating margin plus operating expense components as a percentage of total revenue may not equal 100% due to rounding.
Impact of Non-GAAP Adjustments
The tables below show our revenue, operating income, and net income for the three and six months ended December 31, 2024, compared to the three and six months ended December 31, 2023, excluding the impacts of deconversions and the VEDIP program expense.*
(Unaudited, in thousands)
Three Months Ended
December 31,
%
Change
Six Months Ended
December 31,
%
Change
2024
2023
2024
2023
GAAP Revenue**
$ 573,848
$ 545,701
5.2 %
$ 1,174,829
$ 1,117,069
5.2 %
Adjustments:
Deconversion revenue
(69)
(4,882)
(3,766)
(9,018)
NON-GAAP ADJUSTED REVENUE**
$ 573,779
$ 540,819
6.1 %
$ 1,171,063
$ 1,108,051
5.7 %
GAAP Operating Income
$ 123,002
$ 118,967
3.4 %
$ 274,278
$ 251,667
9.0 %
Adjustments:
Operating (income) loss from deconversions
622
(3,803)
(2,873)
(7,558)
VEDIP program expense*
—
—
—
16,443
NON-GAAP ADJUSTED OPERATING INCOME
$ 123,624
$ 115,164
7.3 %
$ 271,405
$ 260,552
4.2 %
Non-GAAP Adjusted Operating Margin***
21.5 %
21.3 %
23.2 %
23.5 %
GAAP Net Income
$ 97,845
$ 91,965
6.4 %
$ 217,036
$ 193,644
12.1 %
Adjustments:
Net (income) loss from deconversions
622
(3,803)
(2,874)
(7,558)
VEDIP program expense*
—
—
—
16,443
Tax impact of adjustments****
(149)
913
690
(2,132)
NON-GAAP ADJUSTED NET INCOME
$ 98,318
$ 89,075
10.4 %
$ 214,852
$ 200,397
7.2 %
*The VEDIP program expense for the fiscal six months ended December 31, 2023, was related to a Company voluntary separation program offered to certain eligible employees beginning in July 2023.
**GAAP revenue is comprised of services and support and processing revenues (see page 2). Reducing services and support revenue by deconversion revenue for the three months ended December 31, 2024, and 2023 which was $69 for the current fiscal year quarter and $4,882 for the prior fiscal year quarter, results in non-GAAP adjusted services and support revenue growth of 5.2% quarter over quarter. There were no non-GAAP adjustments to processing revenue for the three months ended December 31, 2024, or 2023.
Reducing services and support revenue by deconversion revenue for the six months ended December 31, 2024, and 2023, which was $3,766 for the current fiscal year period and $9,018 for the prior fiscal year period, results in non-GAAP adjusted services and support revenue growth of 4.8% period over period. There were no non-GAAP adjustments to processing revenue for the six months ended December 31, 2024, or 2023.
***Non-GAAP adjusted operating margin is calculated by dividing non-GAAP adjusted operating income by non-GAAP adjusted revenue.
****The tax impact of adjustments is calculated using a tax rate of 24% for the three and six months ended December 31, 2024, and 2023. The tax rate for non-GAAP adjustment items takes a broad look at our recurring tax adjustments and applies them to non-GAAP revenue that does not have its own specific tax impacts.
The tables below show the segment break-out of revenue and cost of revenue for each period presented, as adjusted for the items above, and include a reconciliation to non-GAAP adjusted operating income presented above.
Three Months Ended December 31, 2024
(Unaudited, in thousands)
Core
Payments
Complementary
Corporate
and Other
Total
GAAP REVENUE
$ 173,173
$ 214,836
$ 160,937
$ 24,902
$ 573,848
Non-GAAP adjustments*
20
(34)
(60)
5
(69)
NON-GAAP ADJUSTED REVENUE
173,193
214,802
160,877
24,907
573,779
GAAP COST OF REVENUE
70,739
114,738
63,384
83,989
332,850
Non-GAAP adjustments*
(88)
(53)
(99)
—
(240)
NON-GAAP ADJUSTED COST OF REVENUE
70,651
114,685
63,285
83,989
332,610
GAAP SEGMENT INCOME
$ 102,434
$ 100,098
$ 97,553
$ (59,087)
Segment Income Margin**
59.2 %
46.6 %
60.6 %
(237.3) %
NON-GAAP ADJUSTED SEGMENT INCOME
$ 102,542
$ 100,117
$ 97,592
$ (59,082)
Non-GAAP Adjusted Segment Income Margin**
59.2 %
46.6 %
60.7 %
(237.2) %
Research and Development
41,095
Selling, General, and Administrative
76,901
Non-GAAP adjustments unassigned to a segment***
(451)
NON-GAAP TOTAL ADJUSTED OPERATING EXPENSES
450,155
NON-GAAP ADJUSTED OPERATING INCOME
$ 123,624
*Revenue non-GAAP adjustments for all segments were deconversion revenue. Cost of revenue non-GAAP adjustments for all segments were deconversion costs.
**Segment income margin is calculated by dividing segment income by revenue for each segment. Non-GAAP adjusted segment income margin is calculated by dividing non-GAAP adjusted segment income by non-GAAP adjusted revenue for each segment.
***Non-GAAP adjustments unassigned to a segment were selling, general, and administrative deconversion costs.
Three Months Ended December 31, 2023
(Unaudited, in thousands)
Core
Payments
Complementary
Corporate
and Other
Total
GAAP REVENUE
$ 165,601
$ 203,839
$ 152,466
$ 23,795
$ 545,701
Non-GAAP adjustments*
(1,929)
(1,555)
(1,355)
(43)
(4,882)
NON-GAAP ADJUSTED REVENUE
163,672
202,284
151,111
23,752
540,819
GAAP COST OF REVENUE
69,370
111,623
62,825
77,161
320,979
Non-GAAP adjustments*
(321)
(51)
(249)
—
(621)
NON-GAAP ADJUSTED COST OF REVENUE
69,049
111,572
62,576
77,161
320,358
GAAP SEGMENT INCOME
$ 96,231
$ 92,216
$ 89,641
$ (53,366)
Segment Income Margin**
58.1 %
45.2 %
58.8 %
(224.3) %
NON-GAAP ADJUSTED SEGMENT INCOME
$ 94,623
$ 90,712
$ 88,535
$ (53,409)
Non-GAAP Adjusted Segment Income Margin
57.8 %
44.8 %
58.6 %
(224.9) %
Research and Development
35,478
Selling, General, and Administrative
70,277
Non-GAAP adjustments unassigned to a segment***
(458)
NON-GAAP TOTAL ADJUSTED OPERATING EXPENSES
425,655
NON-GAAP ADJUSTED OPERATING INCOME
$ 115,164
*Revenue non-GAAP adjustments for all segments were deconversion revenues. Cost of revenue non-GAAP adjustments for the Core, Payments, and Complementary segments were deconversion costs.
**Segment income margin is calculated by dividing segment income by revenue for each segment. Non-GAAP adjusted segment income margin is calculated by dividing non-GAAP adjusted segment income by non-GAAP adjusted revenue for each segment.
***Non-GAAP adjustments unassigned to a segment were selling, general, and administrative deconversion costs.
Six Months Ended December 31, 2024
(Unaudited, in thousands)
Core
Payments
Complementary
Corporate
and Other
Total
GAAP REVENUE
$ 368,797
$ 426,758
$ 332,639
$ 46,635
$ 1,174,829
Non-GAAP adjustments*
(1,267)
(1,948)
(533)
(18)
(3,766)
NON-GAAP ADJUSTED REVENUE
367,530
424,810
332,106
46,617
1,171,063
GAAP COST OF REVENUE
152,159
227,757
129,352
167,014
676,282
Non-GAAP adjustments*
(125)
(71)
(159)
—
(355)
NON-GAAP ADJUSTED COST OF REVENUE
152,034
227,686
129,193
167,014
675,927
GAAP SEGMENT INCOME
$ 216,638
$ 199,001
$ 203,287
$ (120,379)
Segment Income Margin**
58.7 %
46.6 %
61.1 %
(258.1) %
NON-GAAP ADJUSTED SEGMENT INCOME
$ 215,496
$ 197,124
$ 202,913
$ (120,397)
Non-GAAP Adjusted Segment Income Margin
58.6 %
46.4 %
61.1 %
(258.3) %
Research and Development
80,780
Selling, General, and Administrative
143,489
Non-GAAP adjustments unassigned to a segment***
(538)
NON-GAAP TOTAL ADJUSTED OPERATING EXPENSES
899,658
NON-GAAP ADJUSTED OPERATING INCOME
$ 271,405
*Revenue non-GAAP adjustments for all segments were deconversion revenue. Cost of revenue non-GAAP adjustments for the Core, Payments, and Complementary segments were deconversion costs.
**Segment income margin is calculated by dividing segment income by revenue for each segment. Non-GAAP adjusted segment income margin is calculated by dividing non-GAAP adjusted segment income by non-GAAP adjusted revenue for each segment.
***Non-GAAP adjustments unassigned to a segment were selling, general, and administrative deconversion costs.
Six Months Ended December 31, 2023
(Unaudited, in thousands)
Core
Payments
Complementary
Corporate
and Other
Total
GAAP REVENUE
$ 352,041
$ 403,195
$ 313,833
$ 48,000
$ 1,117,069
Non-GAAP adjustments*
(3,595)
(2,560)
(2,806)
(57)
(9,018)
NON-GAAP ADJUSTED REVENUE
348,446
400,635
311,027
47,943
1,108,051
GAAP COST OF REVENUE
145,296
220,449
123,783
154,453
643,981
Non-GAAP adjustments*
(425)
(98)
(367)
(1)
(891)
NON-GAAP ADJUSTED COST OF REVENUE
144,871
220,351
123,416
154,452
643,090
GAAP SEGMENT INCOME
$ 206,745
$ 182,746
$ 190,050
$ (106,453)
Segment Income Margin**
58.7 %
45.3 %
60.6 %
(221.8) %
NON-GAAP ADJUSTED SEGMENT INCOME
$ 203,575
$ 180,284
$ 187,611
$ (106,509)
Non-GAAP Adjusted Segment Income Margin
58.4 %
45.0 %
60.3 %
(222.2) %
Research and Development
72,370
Selling, General, and Administrative
149,051
Non-GAAP adjustments unassigned to a segment***
(17,012)
NON-GAAP TOTAL ADJUSTED OPERATING EXPENSES
847,499
NON-GAAP ADJUSTED OPERATING INCOME
$ 260,552
*Revenue non-GAAP adjustments for all segments were deconversion revenues. Cost of revenue non-GAAP adjustments for all segments were deconversion costs.
**Segment income margin is calculated by dividing segment income by revenue for each segment. Non-GAAP adjusted segment income margin is calculated by dividing non-GAAP adjusted segment income by non-GAAP adjusted revenue for each segment.
***Non-GAAP adjustments unassigned to a segment were VEDIP expenses of $16,443 and selling, general, and administrative deconversion costs of $569. The VEDIP program expense for the fiscal six months ended December 31, 2023, was related to a Company voluntary separation program offered to certain eligible employees beginning in July 2023.
The table below shows our GAAP to non-GAAP guidance for the fiscal year ending June 30, 2025. Fiscal year 2025 non-GAAP guidance excludes the impacts of deconversion revenue and related operating expenses and assumes no acquisitions or dispositions are made during the fiscal year.
GAAP to Non-GAAP GUIDANCE (In millions, except per share data)
Annual FY25
Low
High
GAAP REVENUE
$ 2,369
$ 2,391
Growth
6.9 %
7.9 %
Deconversions*
$ 16
$ 16
NON-GAAP ADJUSTED REVENUE**
$ 2,353
$ 2,375
Non-GAAP Adjusted Growth
7.0 %
8.0 %
GAAP OPERATING EXPENSES
$ 1,823
$ 1,836
Growth
5.6 %
6.4 %
Deconversion costs*
$ 3
$ 3
NON-GAAP ADJUSTED OPERATING EXPENSES**
$ 1,820
$ 1,833
Non-GAAP Adjusted Growth
6.7 %
7.4 %
GAAP OPERATING INCOME
$ 546
$ 555
Growth
11.6 %
13.3 %
GAAP OPERATING MARGIN
23.0 %
23.2 %
NON-GAAP ADJUSTED OPERATING INCOME**
$ 533
$ 542
Non-GAAP Adjusted Growth
8.2 %
9.9 %
NON-GAAP ADJUSTED OPERATING MARGIN
22.7 %
22.8 %
GAAP EPS***
$ 5.78
$ 5.87
Growth
10.6 %
12.3 %
Non-GAAP EPS***
$ 5.65
$ 5.74
Growth
7.3 %
9.0 %
*Deconversion revenue and related operating expenses are based on actual results for the six months ended December 31, 2024, and estimates for the remainder of fiscal year 2025, based on the lowest actual recent historical results. See the Company’s Form 8-K filed with the Securities and Exchange Commission on January 27, 2025.
**GAAP to Non-GAAP revenue, operating expenses, and operating income may not foot due to rounding.
***The GAAP to Non-GAAP EPS reconciliation table is below on page 15.
Balance Sheet and Cash Flow Review (In millions)
Cash and cash equivalents were $26 million at December 31, 2024, and $27 million at December 31, 2023.Trade receivables were $283 million at December 31, 2024, compared to $271 million at December 31, 2023.The Company had $150 million of borrowings at December 31, 2024 compared to $255 million of borrowings at December 31, 2023.Deferred revenue remained consistent at $269 million at December 31, 2024, and 2023.Stockholders’ equity increased to $1,976 million at December 31, 2024, compared to $1,724 million at December 31, 2023.
*See table below for Net Cash Provided by Operating Activities and on page 14 for Return on Average Shareholders’ Equity. Tables reconciling the non-GAAP measures Free Cash Flow and Return on Invested Capital (ROIC) to GAAP measures are also on page 14. See the Use of Non-GAAP Financial Information section below for the definitions of Free Cash Flow and ROIC.
The following table summarizes net cash from operating activities:
(Unaudited, in thousands)
Six Months Ended December 31,
2024
2023
Net income
$ 217,036
$ 193,644
Depreciation
22,731
23,765
Amortization
79,517
75,366
Change in deferred income taxes
(8,745)
(16,532)
Other non-cash expenses
15,535
15,693
Change in receivables
49,811
90,702
Change in deferred revenue
(119,463)
(130,529)
Change in other assets and liabilities*
(49,879)
(13,437)
NET CASH FROM OPERATING ACTIVITIES
$ 206,543
$ 238,672
*For the six months ended December 31, 2024, includes the change in prepaid cost of product and other of $(34,384), accrued expenses of $(19,450), and income taxes of $9,538. For the six months ended December 31, 2023, includes the change in prepaid cost of product and other of $(52,969), income taxes of $23,792, and the change in accrued expenses of $15,463.
The following table summarizes net cash from investing activities:
(Unaudited, in thousands)
Six Months Ended December 31,
2024
2023
Capital expenditures
(29,469)
(24,458)
Proceeds from dispositions
—
878
Purchased software
(3,528)
(2,971)
Computer software developed
(85,803)
(83,408)
Purchase of investments
(2,000)
(1,000)
Proceeds from investments
1,000
—
NET CASH FROM INVESTING ACTIVITIES
$ (119,800)
$ (110,959)
The following table summarizes net cash from financing activities:
(Unaudited, in thousands)
Six Months Ended December 31,
2024
2023
Borrowings on credit facilities
$ 165,000
$ 220,000
Repayments on credit facilities and financing leases
(165,000)
(240,000)
Purchase of treasury stock
(17,050)
(20,000)
Dividends paid
(80,193)
(75,722)
Net cash from issuance of stock and tax related to stock-based compensation
(2,131)
2,475
NET CASH FROM FINANCING ACTIVITIES
$ (99,374)
$ (113,247)
Use of Non-GAAP Financial Information
Generally Accepted Accounting Principles (GAAP) is the term used to refer to the standard framework of guidelines for financial accounting in the United States. GAAP includes the standards, conventions, and rules accountants follow in recording and summarizing transactions in the preparation of financial statements. In addition to reporting financial results in accordance with GAAP, we have provided certain non-GAAP financial measures, including adjusted revenue, adjusted operating income, adjusted segment income, adjusted cost of revenue, adjusted operating expenses, adjusted operating margin, adjusted segment income margin, non-GAAP earnings before interest, taxes, depreciation, and amortization (non-GAAP EBITDA), free cash flow, return on invested capital (ROIC), non-GAAP adjusted net income, and non-GAAP earnings per share (EPS).
We believe non-GAAP financial measures help investors better understand the underlying fundamentals and true operations of our business. Adjusted revenue, adjusted operating income, adjusted operating margin, adjusted segment income, adjusted segment income margin, adjusted cost of revenue, adjusted operating expenses, adjusted net income, and non-GAAP EPS eliminate one-time deconversion revenue and associated costs and the effects of the VEDIP program expense related to a Company voluntary separation program offered to certain eligible employees beginning in July 2023, which management believes are not indicative of the Company’s operating performance. Such adjustments give investors further insight into our performance. Non-GAAP EBITDA is defined as net income attributable to the Company before the effect of interest expense, taxes, depreciation, and amortization, adjusted for net income before the effect of interest expense, taxes, depreciation, and amortization attributable to eliminated one-time deconversions and the VEDIP program expense. Free cash flow is defined as net cash from operating activities, less capitalized expenditures, internal use software, and capitalized software, plus proceeds from the sale of assets. ROIC is defined as net income divided by average invested capital, which is the average of beginning and ending long-term debt and stockholders’ equity for a given period. Management believes that non-GAAP EBITDA is an important measure of the Company’s overall operating performance and excludes certain costs and other transactions that management deems one time or non-operational in nature; free cash flow is useful to measure the funds generated in a given period that are available for debt service requirements and strategic capital decisions; and ROIC is a measure of the Company’s allocation efficiency and effectiveness of its invested capital. For these reasons, management also uses these non-GAAP financial measures in its assessment and management of the Company’s performance.
Non-GAAP financial measures used by the Company may not be comparable to similarly titled non-GAAP measures used by other companies. Non-GAAP financial measures have no standardized meaning prescribed by GAAP and therefore, are unlikely to be comparable with calculations of similar measures for other companies.
Any non-GAAP financial measures should be considered in context with the GAAP financial presentation and should not be considered in isolation or as a substitute for GAAP measures. Reconciliations of the non-GAAP financial measures to related GAAP measures are included.
Quarterly Conference Call
The Company will hold a conference call on February 5, 2025, at 7:45 a.m. Central Time, and investors are invited to listen at www.jackhenry.com. A webcast replay will be available approximately one hour after the event at ir.jackhenry.com/corporate-events-and-presentations and will remain available for one year.
About Jack Henry & Associates, Inc.®
Jack Henry™ (Nasdaq: JKHY) is a well-rounded financial technology company that strengthens connections between financial institutions and the people and businesses they serve. We are an S&P 500 company that prioritizes openness, collaboration, and user centricity — offering banks and credit unions a vibrant ecosystem of internally developed modern capabilities as well as the ability to integrate with leading fintechs. For more than 48 years, Jack Henry has provided technology solutions to enable clients to innovate faster, strategically differentiate, and successfully compete while serving the evolving needs of their accountholders. We empower approximately 7,500 clients with people-inspired innovation, personal service, and insight-driven solutions that help reduce the barriers to financial health. Additional information is available at www.jackhenry.com.
Statements made in this news release that are not historical facts are “forward-looking statements” within the meaning of the Private Securities Litigation Reform Act of 1995, Section 27A of the Securities Act of 1933 and Section 21E of the Securities Exchange Act of 1934. Because forward-looking statements relate to the future, they are subject to inherent risks and uncertainties that could cause actual results to differ materially from those expressed or implied by such statements. Such risks and uncertainties include, but are not limited to, those discussed in the Company’s Securities and Exchange Commission filings, including the Company’s most recent reports on Form 10-K and Form 10-Q, particularly under the heading Risk Factors. Any forward-looking statement made in this news release speaks only as of the date of the news release, and the Company expressly disclaims any obligation to publicly update or revise any forward-looking statement, whether because of new information, future events or otherwise.
Condensed Consolidated Statements of Income (Unaudited)
(In thousands, except per share data)
Three Months Ended
December 31,
%
Change
Six Months Ended
December 31,
%
Change
2024
2023
2024
2023
REVENUE
$ 573,848
$ 545,701
5.2 %
$ 1,174,829
$ 1,117,069
5.2 %
Cost of Revenue
332,850
320,979
3.7 %
676,282
643,981
5.0 %
Research and Development
41,095
35,478
15.8 %
80,780
72,370
11.6 %
Selling, General, and Administrative
76,901
70,277
9.4 %
143,489
149,051
(3.7) %
EXPENSES
450,846
426,734
5.7 %
900,551
865,402
4.1 %
OPERATING INCOME
123,002
118,967
3.4 %
274,278
251,667
9.0 %
Interest income
7,159
5,121
39.8 %
15,506
9,866
57.2 %
Interest expense
(2,780)
(3,865)
(28.1) %
(5,605)
(8,062)
(30.5) %
Interest Income (Expense), net
4,379
1,256
248.6 %
9,901
1,804
448.8 %
INCOME BEFORE INCOME TAXES
127,381
120,223
6.0 %
284,179
253,471
12.1 %
Provision for Income Taxes
29,536
28,258
4.5 %
67,143
59,827
12.2 %
NET INCOME
$ 97,845
$ 91,965
6.4 %
$ 217,036
$ 193,644
12.1 %
Diluted net income per share
$ 1.34
$ 1.26
$ 2.97
$ 2.65
Diluted weighted average shares outstanding
73,082
72,984
73,080
72,999
Consolidated Balance Sheet Highlights (Unaudited)
(In thousands)
December 31,
%
Change
2024
2023
Cash and cash equivalents
$ 25,653
$ 26,709
(4.0) %
Receivables
283,223
270,551
4.7 %
Total assets
2,911,770
2,753,976
5.7 %
Accounts payable and accrued expenses
$ 209,926
$ 207,230
1.3 %
Current and long-term debt
150,000
255,000
(41.2) %
Deferred revenue
269,469
269,200
0.1 %
Stockholders’ equity
1,975,565
1,724,387
14.6 %
Calculation of Non-GAAP Earnings Before Income Taxes, Depreciation and Amortization (Non-GAAP EBITDA)
Three Months Ended
December 31,
%
Change
Six Months Ended
December 31,
%
Change
(In thousands)
2024
2023
2024
2023
Net income
$ 97,845
$ 91,965
$ 217,036
$ 193,644
Net interest
(4,379)
(1,256)
(9,901)
(1,804)
Taxes
29,536
28,258
67,143
59,827
Depreciation and amortization
51,754
49,896
102,248
99,131
Less: Net income before interest expense, taxes, depreciation and amortization attributable to eliminated one-time adjustments*
622
(3,802)
(2,873)
8,886
NON-GAAP EBITDA
$ 175,378
$ 165,061
6.3 %
$ 373,653
$ 359,684
3.9 %
*The fiscal second quarter 2025 and 2024 adjustments for net income before interest expense, taxes, depreciation and amortization were for deconversions. The fiscal year-to-date 2025 and 2024 adjustments were for deconversions in 2025 and deconversions and the VEDIP program expense in 2024 and were $(7,557) and $16,443, respectively. The VEDIP program expense for the fiscal six months ended December 31, 2023, was related to a Company voluntary separation program offered to certain eligible employees beginning in July 2023.
Calculation of Free Cash Flow (Non-GAAP)
Six Months Ended
December 31,
(In thousands)
2024
2023
Net cash from operating activities
$ 206,543
$ 238,672
Capitalized expenditures
(29,469)
(24,458)
Internal use software
(3,528)
(2,971)
Proceeds from sale of assets
—
878
Capitalized software
(85,803)
(83,408)
FREE CASH FLOW
$ 87,743
$ 128,713
Calculation of the Return on Average Shareholders’ Equity
December 31,
(In thousands)
2024
2023
Net income (trailing four quarters)
$ 405,208
$ 372,966
Average stockholder’s equity (period beginning and ending balances)
1,849,976
1,617,689
RETURN ON AVERAGE SHAREHOLDERS’ EQUITY
21.9 %
23.1 %
Calculation of Return on Invested Capital (ROIC) (Non-GAAP)
December 31,
(In thousands)
2024
2023
Net income (trailing four quarters)
$ 405,208
$ 372,966
Average stockholder’s equity (period beginning and ending balances)
1,849,976
1,617,689
Average current maturities of long-term debt and financing leases (period beginning and ending balances)
45,000
11
Average long-term debt (period beginning and ending balances)
157,500
265,000
Average invested capital
$ 2,052,476
$ 1,882,700
ROIC
19.7 %
19.8 %
GAAP to Non-GAAP EPS Reconciliation Table
FY25 Guidance
GAAP EPS
$5.78-$5.87
Excluded Activity, net of Tax:
Deconversion*
$0.13
Non-GAAP EPS
$5.65-$5.74
*We are not aware of any other discreet adjustments at this time. Deconversion revenue and related operating expenses are based on actual results for fiscal second quarter 2025 and estimates for the remainder of fiscal year 2025, based on the lowest actual recent historical results. See the Company’s Form 8-K filed with the Securities and Exchange Commission on January 27, 2025.
View original content to download multimedia:https://www.prnewswire.com/news-releases/jack-henry–associates-inc-reports-second-quarter-fiscal-2025-results-302368003.html
SOURCE Jack Henry & Associates, Inc.


 Coin Market4 days ago
 Technology3 days ago
 Coin Market4 days ago
 Technology4 days ago
 Coin Market4 days ago
 Near Videos5 days ago
 Coin Market4 days ago
 Near Videos3 days ago