
Technology
CAE reports third quarter fiscal 2025 results
Published
1 year agoon
By
Revenue of $1,223.4 million vs. $1,094.5 million in prior yearEarnings per share (EPS) from continuing operations of $0.53 vs. $0.18 in prior yearAdjusted EPS(1) of $0.29 vs. $0.24 in prior yearOperating income of $262.6 million vs. $121.6 million in prior yearAdjusted segment operating income(1) of $190.0 million vs. $145.1 million in prior yearFree cash flow(1) of record $409.8 million vs. $190.0 million in prior yearAdjusted order intake(1) of $2.2 billion for a record $20.3 billion adjusted backlog(1) Company also announces changes to its Board of Directors
MONTREAL, Feb. 13, 2025 /PRNewswire/ – (NYSE: CAE) (TSX: CAE) – CAE Inc. (CAE or the Company) today reported its financial results for the fiscal third quarter ended December 31, 2024.
“We achieved a standout third quarter, generating a record $410 million in free cash flow while further securing CAE’s future with $2.2 billion in new orders and a record adjusted backlog of $20 billion,” said Marc Parent, CAE’s President and Chief Executive Officer. “In Civil, we increased our stake in SIMCOM and extended our exclusive long-term training agreement with FlexJet and its affiliates, adding over $500 million to our quarterly adjusted order intake. In Defense, we continued to achieve notable growth and margin improvements through strong execution and risk reduction, and we completed a second Legacy Contract from adjusted backlog, as planned. Looking ahead at CAE’s fiscal year as a whole, we remain on track to meet our previously stated three-year EPS target while achieving strong order intake, backlog, and free cash flow. Our success is a testament to CAE’s unique culture, and I am proud that CAE was recognized as one of Canada’s Top 100 Employers for the third consecutive year and made Forbes’ Canada’s Best Employers list for 2025.”
Consolidated results
Third quarter fiscal 2025 revenue was $1,223.4 million, compared to $1,094.5 million in the third quarter last year. Third quarter EPS from continuing operations was $0.53 compared to $0.18 last year. Adjusted EPS in the third quarter was $0.29 compared to $0.24 last year.
Operating income this quarter was $262.6 million (21.5% of revenue(1)), which includes a net remeasurement gain of $72.6 million on CAE’s recent SIMCOM Aviation Training (SIMCOM) transaction, marking up its previously held equity interest in the joint venture to fair value. This compares to $121.6 million (11.1% of revenue) last year. Third quarter adjusted segment operating income was $190.0 million (15.5% of revenue(1)) compared to $145.1 million (13.3% of revenue) last year. All financial information is in Canadian dollars and results are presented on a continuing operations basis, unless otherwise indicated.
Summary of consolidated results
(amounts in millions, except per share amounts)
Q3-2025
Q3-2024
Variance %
Revenue
$
1,223.4
$
1,094.5
12 %
Operating income
$
262.6
$
121.6
116 %
Adjusted segment operating income(1)
$
190.0
$
145.1
31 %
As a % of revenue(1)
%
15.5
%
13.3
Net income attributable to equity holders of the Company
$
168.6
$
56.5
198 %
Earnings per share (EPS) from continuing operations
$
0.53
$
0.18
194 %
Adjusted EPS(1)
$
0.29
$
0.24
21 %
Adjusted order intake(1)
$
2,218.7
$
1,273.9
74 %
Adjusted backlog(1)
$
20,279.7
$
11,746.3
73 %
(1) This press release includes non-IFRS financial measures, non-IFRS ratios, capital management measures and supplementary financial measures. These measures are not standardized financial measures prescribed under IFRS and therefore should not be confused with, or used as an alternative for, performance measures calculated according to IFRS. Furthermore, these measures should not be compared with similarly titled measures provided or used by other issuers. Refer to the Non-IFRS and other financial measures section of this press release for the definitions and a reconciliation of these measures to the most directly comparable measure under IFRS.
Civil Aviation (Civil)
Third quarter Civil revenue was $752.6 million vs. $622.1 million in the third quarter last year. Operating income was $223.4 million (29.7% of revenue) compared to $101.0 million (16.2% of revenue) in the same quarter last year. Adjusted segment operating income, which excludes a net remeasurement gain of $72.6 million on CAE’s previously held equity interest in SIMCOM, was $150.8 million (20.0% of revenue) compared to $124.2 million (20.0% of revenue) in the third quarter last year. During the quarter, Civil delivered 20 full-flight simulators (FFSs) to customers and third quarter Civil training centre utilization was 76%.
During the quarter, Civil signed training solutions contracts valued at a record $1.5 billion for a range of long-term commercial and business aviation training agreements, including a five-year, over $500 million extension of its exclusive training agreement for FlexJet. Orders also include digital flight services contracts, and 15 FFS sales.
The Civil book-to-sales ratio(1) was 2.01 times for the quarter and 1.42 times for the last 12 months. The Civil adjusted backlog at the end of the quarter was a record $8.8 billion.
On November 5, 2024, CAE increased its ownership stake in its existing SIMCOM joint venture, obtaining control of the entity. Prior to acquiring control, CAE’s 50% ownership in SIMCOM was accounted for using the equity method. The change in control provided for the remeasurement of the previously held equity interest in SIMCOM to its fair value, resulting in a net gain of $72.6 million, which has been excluded from the determination of adjusted segment operating income.
Summary of Civil Aviation results
(amounts in millions)
Q3-2025
Q3-2024
Variance %
Revenue
$
752.6
$
622.1
21 %
Operating income
$
223.4
$
101.0
121 %
Adjusted segment operating income
$
150.8
$
124.2
21 %
As a % of revenue
%
20.0
%
20.0
Adjusted order intake
$
1,511.8
$
845.4
79 %
Adjusted backlog
$
8,798.7
$
6,119.8
44 %
Supplementary non-financial information
Simulator equivalent unit
292
275
6 %
FFSs in CAE’s network
362
336
8 %
FFS deliveries
20
13
54 %
Utilization rate
%
76
%
76
— %
Defense and Security (Defense)
Third quarter Defense revenue was $470.8 million vs. $472.4 million in the third quarter last year. Operating income was $39.2 million (8.3% of revenue) compared to $20.6 million (4.4% of revenue) in the same quarter last year. Adjusted segment operating income was also $39.2 million (8.3% of revenue), compared to $20.9 million (4.4% of revenue) in the third quarter last year. Defense completed another Legacy Contract during the quarter, bringing the remaining number of programs to six. Legacy Contracts had an approximate 70 basis point dilutive impact on the third quarter fiscal 2025 adjusted segment operating income margin.
Defense booked orders for $706.9 million this quarter for a book-to-sales ratio of 1.50 times. The ratio for the last 12 months was 2.19 times. The Defense adjusted backlog, including unfunded contract awards and CAE’s interest in joint ventures, at the end of the quarter was a record $11.5 billion. Notably for the Defense segment overall, the pipeline continues to reflect a strong demand environment with some $7.3 billion of bids and proposals pending.
Summary of Defense and Security results
(amounts in millions)
Q3-2025
Q3-2024
Variance %
Revenue
$
470.8
$
472.4
— %
Operating income
$
39.2
$
20.6
90 %
Adjusted segment operating income
$
39.2
$
20.9
88 %
As a % of revenue
%
8.3
%
4.4
Adjusted order intake
$
706.9
$
428.5
65 %
Adjusted backlog
$
11,481.0
$
5,626.5
104 %
Additional financial highlights
Net finance expense this quarter amounted to $56.6 million, compared to $52.9 million in the preceding quarter and $52.4 million in the third quarter last year. The increase was mainly due to higher finance expense on lease liabilities in support of training network expansions and additional finance expense on borrowings to finance the SIMCOM transaction this quarter. The increase was partially offset by lower finance expense on long-term debt due to a decreased level of borrowings during the period aligned with our ongoing deleveraging objectives.
Income tax expense this quarter amounted to $34.8 million, representing an effective tax rate of 17%, compared to 12% for the third quarter last year. The adjusted effective tax rate(1), which is the income tax rate used to determine adjusted net income and adjusted EPS, was 29% this quarter compared to 15% in the third quarter of last year. The increase in the adjusted effective tax rate was mainly attributable to the mix of income from various jurisdictions.
Net cash provided by operating activities was $424.6 million for the quarter, compared to $220.8 million in the third quarter last year. Free cash flow(1) was a record $409.8 million for the quarter compared to $190.0 million in the third quarter last year. The increase was mainly due to higher net cash from operating activities.
Growth and maintenance capital expenditures(1) totaled $97.6 million this quarter.
Net debt(1) at the end of the quarter was $3,352.9 million for a net debt-to-adjusted EBITDA(1) of 3.36 times (3.08 times excluding Legacy Contracts(1)(2)). This compares to net debt of $3,064.9 million and a net debt-to-adjusted EBITDA of 3.25 times (2.97 times excluding Legacy Contracts) at the end of the preceding quarter.
Adjusted return on capital employed(1) was 5.7% this quarter compared to 5.5% last quarter and 7.0% in the third quarter last year.
During the quarter, no common shares were repurchased under our normal course issuer bid (NCIB), which began on May 30, 2024.
(1) This press release includes non-IFRS financial measures, non-IFRS ratios, capital management measures and supplementary financial measures. These measures are not standardized financial measures prescribed under IFRS and therefore should not be confused with, or used as an alternative for, performance measures calculated according to IFRS. Furthermore, these measures should not be compared with similarly titled measures provided or used by other issuers. Refer to the Non-IFRS and other financial measures section of this press release for the definitions and a reconciliation of these measures to the most directly comparable measure under IFRS.
(2) Within Defense there are a number of fixed-price contracts which offer certain potential advantages and efficiencies but can also be negatively impacted by adverse changes to general economic conditions, including unforeseen supply chain disruptions, inflationary pressures, availability of labour, and execution difficulties. These risks can result in cost overruns and reduced profit margins or losses. While these risks can often be managed or mitigated, there are eight distinct legacy contracts entered into prior to the COVID-19 pandemic that are firm fixed price in structure, with little to no provision for cost escalation, and that have been more significantly impacted by these risks (the Legacy Contracts).
Management outlook
Civil
The secular demand picture for aviation training solutions remains compelling and the Company continues to be well positioned. Aircraft original equipment manufacturer (OEM) supply issues have affected airline pilot hiring and training demand forecasts and remain a near-term headwind for a portion of CAE’s commercial training business. Due to commercial aircraft OEMs taking longer than expected to ramp up production—a key driver of initial training demand for commercial pilots—Management now expects annual Civil adjusted segment operating income growth to be modestly below its previous outlook of approximately 10%. Consistent with its revised annual growth outlook, product deliveries are expected to account for a higher proportion of Civil revenue, resulting in an annual Civil adjusted segment operating income margin modestly below the previously expected range of 22 to 23 percent. Management continues to foresee ample room for margin expansion in future years on volume, efficiencies and mix.
Defense
Management believes CAE is well positioned for long-term growth and increased profitability in Defense, as the sector moves into a prolonged up-cycle with increased budgets across NATO and allied nations. Rising geopolitical tensions are driving a focus on near-peer threats, defence modernization, and readiness, fueling demand for the training and simulation solutions that CAE offers. Demand for CAE’s Defense training solutions remains strong, driven by a global shortage of uniformed personnel, prompting militaries to partner with CAE to support readiness. With the benefit of having re-baselined the Defense business last fiscal year and the higher cadence and quality of execution, Management now expects high-single-digit percentage Defense annual revenue growth (vs. previous low- to mid-single-digit percentage range) and an annual Defense adjusted segment operating income margin modestly above the previously indicated range of 6- to 7-percent in fiscal 2025. Defense margins are also expected to grow beyond the current year. Furthermore, having successfully completed two of its Defense Legacy Contacts as of the third quarter, Management expects to complete another contract at the end of the fiscal year, bringing the total remaining to five, as planned.
For CAE overall, Management continues to target three-year EPS growth (FY22-25) in the low- to mid-teens-percentage range.
Free cash flow
Management anticipates strong free cash flow in fiscal 2025, driven by robust operating cash flows and reduced investments in non-cash working capital. This performance is expected to deliver a conversion rate exceeding 150% of adjusted net income attributable to the Company’s equity holders. This compares to Management’s previously stated conversion rate target for the fiscal year of approximately 100%.
Finance expense and tax expense
Management expects annual finance expense to be approximately $10 million higher than fiscal 2024, driven mainly by higher finance expense on lease liabilities in support of training network expansions and additional finance expense on borrowings to finance the SIMCOM transaction. The run-rate effective income tax rate is expected to be approximately 25%, considering the income expected from various jurisdictions and the implementation of global minimum tax policies.
Balanced capital allocation priorities, accretive growth investments
CAE expects total CAPEX for fiscal 2025 to be approximately $30 million higher than fiscal 2024 CAPEX of $329.8 million, which is lower than previous expectations. Commensurate with CAE’s ongoing success to capture market opportunities in training, approximately three-quarters of this relates to organic growth investments in simulator capacity to be deployed to CAE’s global network of aviation-related training centres and backed by multiyear customer contracts.
Solid financial position
A tenet of CAE’s capital management priorities includes the maintenance of a solid financial position, and it expects to continue to bolster its balance sheet through ongoing deleveraging, commensurate with its investment grade profile. CAE is targeting a leverage ratio of net debt-to-adjusted EBITDA of below three-times (3x) by the end of the current fiscal year.
Current returns to shareholders
Given CAE’s progress over the last year to strengthen its financial position, an NCIB was established as part of its capital management strategy and is currently intended to be used opportunistically over time with excess free cash flow. Given the Company’s outlook and cash generative nature of its highly recurring business, CAE’s Board of Directors will also continue to evaluate the possibility of reintroducing a shareholder dividend.
Caution concerning outlook
Management’s outlook for fiscal 2025 and the above targets and expectations constitute forward-looking statements within the meaning of applicable securities laws, and are based on a number of assumptions, including in relation to prevailing market conditions, macroeconomic and geopolitical factors, supply chains and labor markets. Expectations are also subject to a number of risks and uncertainties and based on assumptions about customer receptivity to CAE’s training solutions and operational support solutions as well as material assumptions contained in this press release, quarterly Management’s Discussion and Analysis (MD&A) and in CAE’s fiscal 2024 MD&A, all available on our website (www.cae.com), SEDAR+ (www.SEDARplus.ca) and EDGAR (www.sec.gov). Please see the sections below entitled: “Caution concerning forward-looking statements”, “Material assumptions” and “Material risks”.
Detailed information
Readers are strongly advised to view a more detailed discussion of our results by segment in the MD&A and CAE’s consolidated financial statements for the quarter ended December 31, 2024, which are available on our website (www.cae.com), SEDAR+ (www.SEDARplus.ca) and EDGAR (www.sec.gov). Holders of CAE’s securities may also request a printed copy of the Company’s consolidated financial statements and MD&A free of charge by contacting Investor Relations (investor.relations@cae.com).
Conference call Q3 FY2025
Marc Parent, CAE President and CEO; Nick Leontidis, COO; Constantino Malatesta, interim CFO; and Andrew Arnovitz, Senior Vice President, Investor Relations and Enterprise Risk Management, will conduct an earnings conference call tomorrow at 8:00 a.m. ET. The call is intended for analysts, institutional investors and the media. Participants can listen to the conference by dialing+ 1-844-763-8274 or +1-647-484-8814. The conference call will also be audio webcast live at www.cae.com.
About CAE
At CAE, we equip people in critical roles with the expertise and solutions to create a safer world. As a technology company, we digitalize the physical world, deploying software-based simulation training and critical operations support solutions. Above all else, we empower pilots, cabin crew, maintenance technicians, airlines, business aviation operators and defence and security forces to perform at their best every day and when the stakes are the highest. Around the globe, we’re everywhere customers need us to be with approximately 13,000 employees in more than 240 sites and training locations in over 40 countries. CAE represents more than 75 years of industry firsts–the highest-fidelity flight and mission simulators as well as training programs powered by digital technologies. We embed sustainability in everything we do. Today and tomorrow, we’ll make sure our customers are ready for the moments that matter.
For information on CAE’s sustainability roadmap and achievements, the report can be downloaded at https://www.cae.com/sustainability/.
Caution concerning limitations of summary earnings press release
This summary earnings press release contains limited information meant to assist the reader in assessing CAE’s performance, but it is not a suitable source of information for readers who are unfamiliar with CAE and is not in any way a substitute for the Company’s financial statements, notes to the financial statements, and MD&A reports.
Caution concerning forward-looking statements
This press release includes forward-looking statements about our activities, events and developments that we expect to or anticipate may occur in the future including, for example, statements about our vision, strategies, market trends and outlook, future revenues, earnings, cash flow growth, profit trends, growth capital spending, expansions and new initiatives, including initiatives that pertain to environmental, social and governance (ESG) matters, financial obligations, available liquidities, expected sales, general economic and political outlook, inflation trends, prospects and trends of an industry, expected annual recurring cost savings from operational excellence programs, our management of the supply chain, estimated addressable markets, demands for CAE’s products and services, our access to capital resources, our financial position, the expected accretion in various financial metrics, the expected capital returns to shareholders, our business outlook, business opportunities, objectives, development, plans, growth strategies and other strategic priorities, and our competitive and leadership position in our markets, the expansion of our market shares, CAE’s ability and preparedness to respond to demand for new technologies, the sustainability of our operations, our ability to retire the Legacy Contracts as expected and to manage and mitigate the risks associated therewith, the impact of the retirement of the Legacy Contracts, and other statements that are not historical facts.
Since forward-looking statements and information relate to future events or future performance and reflect current expectations or beliefs regarding future events, they are typically identified by words such as “anticipate”, “believe”, “could”, “estimate”, “expect”, “intend”, “likely”, “may”, “plan”, “seek”, “should”, “will”, “strategy”, “future” or the negative thereof or other variations thereon suggesting future outcomes or statements regarding an outlook. All such statements constitute “forward-looking statements” within the meaning of applicable Canadian securities legislation and “forward-looking statements” within the meaning of the “safe harbor” provisions of the United States Private Securities Litigation Reform Act of 1995.
By their nature, forward-looking statements require us to make assumptions and are subject to inherent risks and uncertainties associated with our business which may cause actual results in future periods to differ materially from results indicated in forward-looking statements. While these statements are based on management’s expectations and assumptions regarding historical trends, current conditions and expected future developments, as well as other factors that we believe are reasonable and appropriate in the circumstances, readers are cautioned not to place undue reliance on these forward-looking statements as there is a risk that they may not be accurate. The forward-looking statements contained in this press release describe our expectations as of February 13, 2025 and, accordingly, are subject to change after such date. Except as required by law, we disclaim any intention or obligation to update or revise any forward-looking statements whether as a result of new information, future events or otherwise. The forward-looking information and statements contained in this press release are expressly qualified by this cautionary statement. In addition, statements that “we believe” and similar statements reflect our beliefs and opinions on the relevant subject. These statements are based on information available to us as of the date of this press release. While we believe that information provides a reasonable basis for these statements, that information may be limited or incomplete. Our statements should not be read to indicate that we have conducted an exhaustive inquiry into, or review of, all relevant information. These statements are inherently uncertain, and investors are cautioned not to unduly rely on these statements. Except as otherwise indicated by CAE, forward-looking statements do not reflect the potential impact of any special items or of any dispositions, monetizations, mergers, acquisitions, other business combinations or other transactions that may occur after February 13, 2025. The financial impact of these transactions and special items can be complex and depends on the facts particular to each of them. We therefore cannot describe the expected impact in a meaningful way or in the same way we present known risks affecting our business. Forward-looking statements are presented in this press release for the purpose of assisting investors and others in understanding certain key elements of our expected fiscal 2025 financial results and in obtaining a better understanding of our anticipated operating environment. Readers are cautioned that such information may not be appropriate for other purposes.
Material assumptions
The forward-looking statements set out in this press release are based on certain assumptions including, without limitation: the prevailing market conditions, geopolitical instability, the customer receptivity to our training and operational support solutions, the accuracy of our estimates of addressable markets and market opportunity, the realization of anticipated annual recurring cost savings and other intended benefits from restructuring initiatives and operational excellence programs, the ability to respond to anticipated inflationary pressures and our ability to pass along rising costs through increased prices, the actual impact to supply, production levels, and costs from global supply chain logistics challenges, the stability of foreign exchange rates, the ability to hedge exposures to fluctuations in interest rates and foreign exchange rates, the availability of borrowings to be drawn down under, and the utilization, of one or more of our senior credit agreements, our available liquidity from cash and cash equivalents, undrawn amounts on our revolving credit facility, the balance available under our receivable purchase facility, the assumption that our cash flows from operations and continued access to debt funding will be sufficient to meet financial requirements in the foreseeable future, access to expected capital resources within anticipated timeframes, no material financial, operational or competitive consequences from changes in regulations affecting our business, our ability to retain and attract new business, our ability to effectively execute and retire the Legacy Contracts while managing the risks associated therewith, our ability to defend our position in the dispute with the buyer of the CAE Healthcare business, and the realization of the expected strategic, financial and other benefits of the increase of our ownership stake in SIMCOM Aviation Training in the timeframe anticipated. Air travel is a major driver for CAE’s business and management relies on analysis from the International Air Transport Association (IATA) to inform its assumptions about the rate and profile of recovery in its key civil aviation market. Accordingly, the assumptions outlined in this press release and, consequently, the forward‑looking statements based on such assumptions, may turn out to be inaccurate.
Material risks
Important risks that could cause actual results or events to differ materially from those expressed in or implied by our forward-looking statements are set out in CAE’s MD&A for the fiscal year ended March 31, 2024 and MD&A for the three months ended December 31, 2024, available on our website (www.cae.com), SEDAR+ (www.SEDARplus.ca) and EDGAR (www.sec.gov). Readers are cautioned that any of the disclosed risks could have a material adverse effect on our forward-looking statements. We caution that the disclosed list of risk factors is not exhaustive and other factors could also adversely affect our results.
Non-IFRS and other financial measures
This press release includes non-IFRS financial measures, non-IFRS ratios, capital management measures and supplementary financial measures. These measures are not standardized financial measures prescribed under IFRS and therefore should not be confused with, or used as an alternative for, performance measures calculated according to IFRS. Furthermore, these measures should not be compared with similarly titled measures provided or used by other issuers. Management believes that these measures provide additional insight into our operating performance and trends and facilitate comparisons across reporting periods.
Certain non-IFRS and other financial measures are provided on a consolidated basis and separately for each of our segments (Civil Aviation and Defense and Security) since we analyze their results and performance separately.
Reconciliations and calculations of non-IFRS measures to the most directly comparable measures under IFRS are also set forth below in the section Reconciliations and Calculations of this press release.
Performance measures
Operating income margin (or operating income as a % of revenue)
Operating income margin is a supplementary financial measure calculated by dividing our operating income by revenue for a given period. We track it because we believe it provides an enhanced understanding of our operating performance and facilitates the comparison across reporting periods.
Adjusted segment operating income or loss
Adjusted segment operating income or loss is a non-IFRS financial measure that gives us an indication of the profitability of each segment because it does not include the impact of any items not specifically related to the segment’s performance. We calculate adjusted segment operating income by taking operating income and adjusting for restructuring, integration and acquisition costs, and impairments and other gains and losses arising from significant strategic transactions or specific events. Impairments and other gains and losses arising from significant strategic transactions or specific events consist of the gain on fair value remeasurement of SIMCOM (as described in Note 7 of our consolidated interim financial statements for the quarter ended December 31, 2024), the impairment of goodwill (as described in Note 14 of our consolidated financial statements for the year ended March 31, 2024), the impairment of technology and other non-financial assets (as described in Note 5 of our consolidated financial statements for the year ended March 31, 2024) and the impairment reversal of non-financial assets following their repurposing and optimization (as described in Note 5 of our consolidated financial statements for the year ended March 31, 2023). We track adjusted segment operating income because we believe it provides an enhanced understanding of our operating performance and facilitates the comparison across reporting periods. Adjusted segment operating income on a consolidated basis is a total of segments measure since it is the profitability measure employed by management for making decisions about allocating resources to segments and assessing segment performance.
Adjusted segment operating income margin (or adjusted segment operating income as a % of revenue)
Adjusted segment operating income margin is a non-IFRS ratio calculated by dividing our adjusted segment operating income by revenue for a given period. We track it because we believe it provides an enhanced understanding of our operating performance and facilitates the comparison across reporting periods.
Adjusted effective tax rate
Adjusted effective tax rate is a supplementary financial measure that represents the effective tax rate on adjusted net income or loss. It is calculated by dividing our income tax expense by our earnings before income taxes, adjusting for the same items used to determine adjusted net income or loss. We track it because we believe it provides an enhanced understanding of the impact of changes in income tax rates and the mix of income on our operating performance and facilitates the comparison across reporting periods.
Adjusted net income or loss
Adjusted net income or loss is a non-IFRS financial measure we use as an alternate view of our operating results. We calculate it by taking our net income attributable to equity holders of the Company from continuing operations and adjusting for restructuring, integration and acquisition costs, and impairments and other gains and losses arising from significant strategic transactions or specific events, after tax, as well as significant one-time tax items. Impairments and other gains and losses arising from significant strategic transactions or specific events consist of the gain on fair value remeasurement of SIMCOM (as described in Note 7 of our consolidated interim financial statements for the quarter ended December 31, 2024), the impairment of goodwill (as described in Note 14 of our consolidated financial statements for the year ended March 31, 2024), the impairment of technology and other non-financial assets (as described in Note 5 of our consolidated financial statements for the year ended March 31, 2024) and the impairment reversal of non-financial assets following their repurposing and optimization (as described in Note 5 of our consolidated financial statements for the year ended March 31, 2023). We track adjusted net income because we believe it provides an enhanced understanding of our operating performance and facilitates the comparison across reporting periods.
Adjusted earnings or loss per share (EPS)
Adjusted earnings or loss per share is a non-IFRS ratio calculated by dividing adjusted net income or loss by the weighted average number of diluted shares. We track it because we believe it provides an enhanced understanding of our operating performance on a per share basis and facilitates the comparison across reporting periods.
EBITDA and Adjusted EBITDA
EBITDA is a non-IFRS financial measure which comprises net income or loss from continuing operations before income taxes, finance expense – net, depreciation and amortization. Adjusted EBITDA further adjusts for restructuring, integration and acquisition costs, and impairments and other gains and losses arising from significant strategic transactions or specific events. Impairments and other gains and losses arising from significant strategic transactions or specific events consist of the gain on fair value remeasurement of SIMCOM (as described in Note 7 of our consolidated interim financial statements for the quarter ended December 31, 2024), the impairment of goodwill (as described in Note 14 of our consolidated financial statements for the year ended March 31, 2024), the impairment of technology and other non-financial assets (as described in Note 5 of our consolidated financial statements for the year ended March 31, 2024) and the impairment reversal of non-financial assets following their repurposing and optimization (as described in Note 5 of our consolidated financial statements for the year ended March 31, 2023). We use EBITDA and adjusted EBITDA to evaluate our operating performance, by eliminating the impact of non-operational or non-cash items.
Free cash flow
Free cash flow is a non-IFRS financial measure that shows us how much cash we have available to invest in growth opportunities, repay debt and meet ongoing financial obligations. We use it as an indicator of our financial strength and liquidity. We calculate it by taking the net cash generated by our continuing operating activities, subtracting maintenance capital expenditures, intangible assets expenditures excluding capitalized development costs, other investing activities not related to growth and dividends paid and adding proceeds from the disposal of property, plant and equipment, dividends received from equity accounted investees and proceeds, net of payments, from equity accounted investees.
Liquidity and Capital Structure measures
Adjusted return on capital employed (ROCE)
Adjusted ROCE is a non-IFRS ratio calculated over a rolling four-quarter period by taking net income attributable to equity holders of the Company from continuing operations adjusting for net finance expense, after tax, restructuring, integration and acquisition costs, and impairments and other gains and losses arising from significant strategic transactions or specific events divided by the average capital employed from continuing operations. Impairments and other gains and losses arising from significant strategic transactions or specific events consist of the gain on fair value remeasurement of SIMCOM (as described in Note 7 of our consolidated interim financial statements for the quarter ended December 31, 2024), the impairment of goodwill (as described in Note 14 of our consolidated financial statements for the year ended March 31, 2024), the impairment of technology and other non-financial assets (as described in Note 5 of our consolidated financial statements for the year ended March 31, 2024) and the impairment reversal of non-financial assets following their repurposing and optimization (as described in Note 5 of our consolidated financial statements for the year ended March 31, 2023). We use adjusted ROCE to evaluate the profitability of our invested capital.
Net debt
Net debt is a capital management measure we use to monitor how much debt we have after taking into account cash and cash equivalents. We use it as an indicator of our overall financial position, and calculate it by taking our total long-term debt, including the current portion of long-term debt, and subtracting cash and cash equivalents.
Net debt-to-EBITDA and net debt-to-adjusted EBITDA
Net debt-to-EBITDA and net debt-to-adjusted EBITDA are non-IFRS ratios calculated as net debt divided by the last twelve months EBITDA (or adjusted EBITDA). We use net debt-to-EBITDA and net debt-to-adjusted EBITDA because they reflect our ability to service our debt obligations.
Net debt-to-adjusted EBITDA excluding Legacy Contracts further excludes the impact from accelerated risk recognition on the Legacy Contracts recorded in the fourth quarter of fiscal 2024. Net debt-to-adjusted EBITDA excluding Legacy Contracts is also useful because it provides a better understanding of the specific and impact from accelerated risk recognition on the Legacy Contracts on our ability to service our debt obligations.
Maintenance and growth capital expenditures
Maintenance capital expenditure is a supplementary financial measure we use to calculate the investment needed to sustain the current level of economic activity. Growth capital expenditure is a supplementary financial measure we use to calculate the investment needed to increase the current level of economic activity. The sum of maintenance capital expenditures and growth capital expenditures represents our total property, plant and equipment expenditures.
Growth measures
Adjusted order intake
Adjusted order intake is a supplementary financial measure that represents the expected value of orders we have received:
For the Civil Aviation segment, we consider an item part of our adjusted order intake when we have a legally binding commercial agreement with a client that includes enough detail about each party’s obligations to form the basis for a contract. Additionally, expected future revenues from customers under short-term and long-term training contracts are included when these customers commit to pay us training fees, or when we reasonably expect the revenue to be generated;For the Defense and Security segment, we consider an item part of our adjusted order intake when we have a legally binding commercial agreement with a client that includes enough detail about each party’s obligations to form the basis for a contract. Defense and Security contracts are usually executed over a long-term period but some of them must be renewed each year. For this segment, we only include a contract item in adjusted order intake when the customer has authorized the contract item and has received funding for it.
Adjusted backlog
Adjusted backlog is a supplementary financial measure that represents expected future revenues and includes obligated backlog, joint venture backlog and unfunded backlog and options:
Obligated backlog represents the value of our adjusted order intake not yet executed and is calculated by adding the adjusted order intake of the current period to the balance of the obligated backlog at the end of the previous fiscal year, subtracting the revenue recognized in the current period and adding or subtracting backlog adjustments. If the amount of an order already recognized in a previous fiscal year is modified, the backlog is revised through adjustments;Joint venture backlog is obligated backlog that represents the expected value of our share of orders that our joint ventures have received but have not yet executed. Joint venture backlog is determined on the same basis as obligated backlog described above, but excludes any portion of orders that have been directly subcontracted to a CAE subsidiary, which are already reflected in the determination of obligated backlog;Unfunded backlog represents legally binding Defense and Security orders with the U.S. government that we have received but have not yet executed and for which funding authorization has not yet been obtained. The uncertainty relates to the timing of the funding authorization, which is influenced by the government’s budget cycle, based on a September year-end. Options are included in adjusted backlog when there is a high probability of being exercised, which we define as at least 80% probable, but multi-award indefinite-delivery/indefinite-quantity (ID/IQ) contracts are excluded. When an option is exercised, it is considered adjusted order intake in that period, and it is removed from unfunded backlog and options.
Book-to-sales ratio
The book-to-sales ratio is a supplementary financial measure calculated by dividing adjusted order intake by revenue in a given period. We use it to monitor the level of future growth of the business over time.
Supplementary non-financial information definitions
Full-flight simulators (FFSs) in CAE’s network
A FFS is a full-size replica of a specific make, model and series of an aircraft cockpit, including a motion system. In our count of FFSs in the network, we generally only include FFSs that are of the highest fidelity and do not include any fixed based training devices, or other lower-level devices, as these are typically used in addition to FFSs in the same approved training programs.
Simulator equivalent unit (SEU)
SEU is a measure we use to show the total average number of FFSs available to generate earnings during the period. For example, in the case of a 50/50 flight training joint venture, we will report only 50% of the FFSs under this joint venture as a SEU. If a FFS is being powered down and relocated, it will not be included as a SEU until the FFS is re-installed and available to generate earnings.
Utilization rate
Utilization rate is a measure we use to assess the performance of our Civil simulator training network. While utilization rate does not perfectly correlate to revenue recognized, we track it, together with other measures, because we believe it is an indicator of our operating performance. We calculate it by taking the number of training hours sold on our simulators during the period divided by the practical training capacity available for the same period.
Reconciliations and Calculations
Reconciliation of adjusted segment operating income
Defense
(amounts in millions)
Civil Aviation
and Security
Total
Three months ended December 31
2024
2023
2024
2023
2024
2023
Operating income
$ 223.4
$ 101.0
$ 39.2
$ 20.6
$ 262.6
$ 121.6
Restructuring, integration and acquisition costs
—
23.2
—
0.3
—
23.5
Impairments and other gains and losses arising from
significant strategic transactions or specific events:
Gain on fair value remeasurement of SIMCOM
(72.6)
—
—
—
(72.6)
—
Adjusted segment operating income
$ 150.8
$ 124.2
$ 39.2
$ 20.9
$ 190.0
$ 145.1
Reconciliation of adjusted net income and adjusted EPS
Three months ended
December 31
(amounts in millions, except per share amounts)
2024
2023
Net income attributable to equity holders of the Company
$ 168.6
$ 56.5
Net loss from discontinued operations
—
1.9
Restructuring, integration and acquisition costs, after tax
—
18.2
Impairments and other gains and losses arising from
significant strategic transactions or specific events:
Gain on fair value remeasurement of SIMCOM, after tax
(76.7)
—
Adjusted net income
$ 91.9
$ 76.6
Average number of shares outstanding (diluted)
319.8
319.1
Adjusted EPS
$ 0.29
$ 0.24
Calculation of adjusted effective tax rate
Three months ended
December 31
(amounts in millions, except effective tax rates)
2024
2023
Earnings before income taxes
$
206.0
$
69.2
Restructuring, integration and acquisition costs
—
23.5
Impairments and other gains and losses arising from
significant strategic transactions or specific events:
Gain on fair value remeasurement of SIMCOM
(72.6)
—
Adjusted earnings before income taxes
$
133.4
$
92.7
Income tax expense
$
34.8
$
8.2
Tax impact on restructuring, integration and acquisition costs
—
5.3
Tax impact on impairments and other gains and losses arising
from significant strategic transactions or specific events:
Tax impact on gain on fair value remeasurement of SIMCOM
4.1
—
Adjusted income tax expense
$
38.9
$
13.5
Effective tax rate
%
17
%
12
Adjusted effective tax rate
%
29
%
15
Reconciliation of free cash flow
Three months ended
December 31
(amounts in millions)
2024
2023
Cash provided by operating activities*
$ 220.8
$ 148.6
Changes in non-cash working capital
203.8
72.2
Net cash provided by operating activities
$ 424.6
$ 220.8
Maintenance capital expenditures
(16.1)
(20.7)
Intangible assets expenditures excluding capitalized development costs
(4.3)
(5.0)
Proceeds from the disposal of property, plant and equipment
1.4
0.1
Net payments to equity accounted investees
(5.4)
(14.9)
Dividends received from equity accounted investees
11.4
13.2
Other investing activities
(1.8)
(5.4)
Impact of discontinued operations
—
1.9
Free cash flow
$ 409.8
$ 190.0
* before changes in non-cash working capital
Reconciliation of EBITDA, adjusted EBITDA, net debt-to-EBITDA and net debt-to-adjusted EBITDA
Last twelve months ended
December 31
(amounts in millions, except net debt-to-EBITDA ratios)
2024
2023
Operating (loss) income
$ (43.7)
$ 525.9
Depreciation and amortization
400.4
359.7
EBITDA
$ 356.7
$ 885.6
Restructuring, integration and acquisition costs
111.5
91.5
Impairments and other gains and losses arising from
significant strategic transactions or specific events:
Impairment of goodwill
568.0
—
Impairment of technology and other financial assets
35.7
—
Gain on fair value remeasurement of SIMCOM
(72.6)
—
Adjusted EBITDA
$ 999.3
$ 977.1
Net debt
$ 3,352.9
$ 3,085.4
Net debt-to-EBITDA
9.40
3.48
Net debt-to-adjusted EBITDA
3.36
3.16
Last twelve months ended
December 31
(amounts in millions, except net debt-to-EBITDA ratios)
2024
2023
Adjusted EBITDA
$ 999.3
$ 977.1
Impact from accelerated risk recognition on the Legacy Contracts
90.3
—
Adjusted EBITDA excluding Legacy Contracts
$ 1,089.6
$ 977.1
Net debt-to-adjusted EBITDA excluding Legacy Contracts
3.08
3.16
Reconciliation of capital employed and net debt
As at December 31
As at March 31
(amounts in millions)
2024
2024
Use of capital:
Current assets
$
2,158.1
$
2,006.5
Less: cash and cash equivalents
(302.5)
(160.1)
Current liabilities
(2,522.0)
(2,358.4)
Less: current portion of long-term debt
340.3
308.9
Non-cash working capital
$
(326.1)
$
(203.1)
Property, plant and equipment
2,892.6
2,515.6
Intangible assets
3,868.1
3,271.9
Other long-term assets
2,164.6
2,040.1
Other long-term liabilities
(487.4)
(407.7)
Capital employed
$
8,111.8
$
7,216.8
Source of capital:
Current portion of long-term debt
$
340.3
$
308.9
Long-term debt
3,315.1
2,765.4
Less: cash and cash equivalents
(302.5)
(160.1)
Net debt
$
3,352.9
$
2,914.2
Equity attributable to equity holders of the Company
4,673.5
4,224.9
Non-controlling interests
85.4
77.7
Capital employed
$
8,111.8
$
7,216.8
For non-IFRS and other financial measures monitored by CAE, and a reconciliation of such measures to the most directly comparable measure under IFRS, please refer to Section 12 of CAE’s MD&A for the quarter ended December 31, 2024 (which is incorporated by reference into this press release) available on our website (www.cae.com), SEDAR+ (www.SEDARplus.ca) and EDGAR (www.sec.gov).
Consolidated Income Statement
(Unaudited)
Three months ended
December 31
Nine months ended
December 31
(amounts in millions of Canadian dollars, except per share amounts)
2024
2023
2024
2023
Continuing operations
Revenue
$
1,223.4
$
1,094.5
$
3,432.5
$
3,156.5
Cost of sales
883.8
791.9
2,523.1
2,283.5
Gross profit
$
339.6
$
302.6
$
909.4
$
873.0
Research and development expenses
28.7
38.1
101.8
108.1
Selling, general and administrative expenses
140.2
140.9
401.3
396.9
Other (gains) and losses
(0.1)
(4.8)
(3.7)
(8.4)
Share of after-tax profit of equity accounted investees
(19.2)
(16.7)
(63.2)
(47.6)
Restructuring, integration and acquisition costs
—
23.5
56.5
76.4
Gain on remeasurement of previously held equity interest
(72.6)
—
(72.6)
—
Operating income
$
262.6
$
121.6
$
489.3
$
347.6
Finance expense – net
56.6
52.4
159.0
152.6
Earnings before income taxes
$
206.0
$
69.2
$
330.3
$
195.0
Income tax expense
34.8
8.2
53.5
7.8
Net income from continuing operations
$
171.2
$
61.0
$
276.8
$
187.2
Net (loss) income from discontinued operations
—
(1.9)
—
0.8
Net income
$
171.2
$
59.1
$
276.8
$
188.0
Attributable to:
Equity holders of the Company
$
168.6
$
56.5
$
269.4
$
180.2
Non-controlling interests
2.6
2.6
7.4
7.8
Earnings per share attributable to equity holders of the Company
Basic and diluted – continuing operations
$
0.53
$
0.18
$
0.84
$
0.56
Basic and diluted – discontinued operations
—
(0.01)
—
—
Consolidated Statement of Comprehensive Income
(Unaudited)
Three months ended
December 31
Nine months ended
December 31
(amounts in millions of Canadian dollars)
2024
2023
2024
2023
Net income from continuing operations
$
171.2
$
61.0
$
276.8
$
187.2
Items that may be reclassified to net income
Foreign currency exchange differences on translation of foreign operations
$
248.8
$
(77.7)
$
315.7
$
(105.3)
Net (loss) gain on hedges of net investment in foreign operations
(127.8)
56.2
(122.5)
54.6
Reclassification to income of gains on foreign currency exchange differences
(7.8)
(0.1)
(7.9)
(0.2)
Net (loss) gain on cash flow hedges
(35.7)
8.3
(36.8)
7.4
Reclassification to income of losses on cash flow hedges
10.9
1.8
15.8
4.9
Income taxes
11.9
(5.5)
9.8
(9.5)
$
100.3
$
(17.0)
$
174.1
$
(48.1)
Items that will never be reclassified to net income
Remeasurement of defined benefit pension plan obligations
$
(5.7)
$
(34.5)
$
(59.9)
$
(22.5)
Income taxes
1.5
9.2
15.9
6.0
$
(4.2)
$
(25.3)
$
(44.0)
$
(16.5)
Other comprehensive income (loss) from continuing operations
$
96.1
$
(42.3)
$
130.1
$
(64.6)
Net (loss) income from discontinued operations
—
(1.9)
—
0.8
Other comprehensive loss from discontinued operations
—
(3.2)
—
(1.7)
Total comprehensive income
$
267.3
$
13.6
$
406.9
$
121.7
Attributable to:
Equity holders of the Company
$
262.1
$
11.7
$
396.3
$
114.9
Non-controlling interests
5.2
1.9
10.6
6.8
Consolidated Statement of Financial Position
(Unaudited)
December 31
March 31
(amounts in millions of Canadian dollars)
2024
2024
Assets
Cash and cash equivalents
$
302.5
$
160.1
Accounts receivable
547.6
624.7
Contract assets
543.3
537.6
Inventories
581.8
573.6
Prepayments
92.3
68.0
Income taxes recoverable
73.6
35.3
Derivative financial assets
17.0
7.2
Total current assets
$
2,158.1
$
2,006.5
Property, plant and equipment
2,892.6
2,515.6
Right-of-use assets
781.5
545.8
Intangible assets
3,868.1
3,271.9
Investment in equity accounted investees
524.3
588.8
Employee benefits assets
11.5
65.7
Deferred tax assets
225.3
233.3
Derivative financial assets
2.2
4.2
Other non-current assets
619.8
602.3
Total assets
$
11,083.4
$
9,834.1
Liabilities and equity
Accounts payable and accrued liabilities
$
1,071.7
$
1,035.3
Provisions
36.8
42.6
Income taxes payable
22.3
31.1
Contract liabilities
1,012.3
911.7
Current portion of long-term debt
340.3
308.9
Derivative financial liabilities
38.6
28.8
Total current liabilities
$
2,522.0
$
2,358.4
Provisions
13.7
14.0
Long-term debt
3,315.1
2,765.4
Royalty obligations
67.3
74.4
Employee benefits obligations
130.4
98.7
Deferred tax liabilities
42.3
36.6
Derivative financial liabilities
20.5
2.9
Other non-current liabilities
213.2
181.1
Total liabilities
$
6,324.5
$
5,531.5
Equity
Share capital
$
2,306.8
$
2,252.9
Contributed surplus
69.0
55.4
Accumulated other comprehensive income
324.9
154.0
Retained earnings
1,972.8
1,762.6
Equity attributable to equity holders of the Company
$
4,673.5
$
4,224.9
Non-controlling interests
85.4
77.7
Total equity
$
4,758.9
$
4,302.6
Total liabilities and equity
$
11,083.4
$
9,834.1
Consolidated Statement of Changes in Equity
(Unaudited)
Attributable to equity holders of the Company
Nine months ended December 31, 2024
Common shares
Accumulated other
(amounts in millions of Canadian dollars,
Number of
Stated
Contributed
comprehensive
Retained
Non-controlling
Total
except number of shares)
shares
value
surplus
income
earnings
Total
interests
equity
Balances as at March 31, 2024
318,312,233
$
2,252.9
$
55.4
$
154.0
$
1,762.6
$
4,224.9
$
77.7
$
4,302.6
Net income
—
$
—
$
—
$
—
$
269.4
$
269.4
$
7.4
$
276.8
Other comprehensive income (loss)
—
—
—
170.9
(44.0)
126.9
3.2
130.1
Total comprehensive income
—
$
—
$
—
$
170.9
$
225.4
$
396.3
$
10.6
$
406.9
Exercise of stock options
2,174,482
58.8
(8.6)
—
—
50.2
—
50.2
Settlement of equity-settled awards
43,557
1.2
(1.2)
—
—
—
—
—
Repurchase and cancellation of common shares
(856,230)
(6.1)
—
—
(15.2)
(21.3)
—
(21.3)
Equity-settled share-based payments expense
—
—
23.4
—
—
23.4
—
23.4
Transactions with non-controlling interests
—
—
—
—
—
—
(2.9)
(2.9)
Balances as at December 31, 2024
319,674,042
$
2,306.8
$
69.0
$
324.9
$
1,972.8
$
4,673.5
$
85.4
$
4,758.9
Attributable to equity holders of the Company
Nine months ended December 31, 2023
Common shares
Accumulated other
(amounts in millions of Canadian dollars,
Number of
Stated
Contributed
comprehensive
Retained
Non-controlling
Total
except number of shares)
shares
value
surplus
income
earnings
Total
interests
equity
Balances as at March 31, 2023
317,906,290
$
2,243.6
$
42.1
$
167.2
$
2,054.8
$
4,507.7
$
81.2
$
4,588.9
Net income
—
$
—
$
—
$
—
$
180.2
$
180.2
$
7.8
$
188.0
Other comprehensive loss
—
—
—
(48.8)
(16.5)
(65.3)
(1.0)
(66.3)
Total comprehensive (loss) income
—
$
—
$
—
$
(48.8)
$
163.7
$
114.9
$
6.8
$
121.7
Exercise of stock options
396,018
9.0
(1.4)
—
—
7.6
—
7.6
Equity-settled share-based payments expense
—
—
18.6
—
—
18.6
—
18.6
Transactions with non-controlling interests
—
—
—
—
—
—
(8.5)
(8.5)
Balances as at December 31, 2023
318,302,308
$
2,252.6
$
59.3
$
118.4
$
2,218.5
$
4,648.8
$
79.5
$
4,728.3
Consolidated Statement of Cash Flows
(Unaudited)
Nine months ended
December 31
(amounts in millions of Canadian dollars)
2024
2023
Operating activities
Net income
$
276.8
$
188.0
Adjustments for:
Depreciation and amortization
304.2
278.6
Share of after-tax profit of equity accounted investees
(63.2)
(47.6)
Deferred income taxes
9.4
(39.8)
Investment tax credits
(8.9)
(9.2)
Equity-settled share-based payments expense
23.4
18.6
Defined benefit pension plans
25.8
4.5
Other non-current liabilities
(4.8)
(7.3)
Derivative financial assets and liabilities – net
(37.0)
(17.5)
Gain on remeasurement of previously held equity interest
(72.6)
—
Other
12.5
23.8
Changes in non-cash working capital
108.2
(40.4)
Net cash provided by operating activities
$
573.8
$
351.7
Investing activities
Business combinations, net of cash acquired
$
(308.0)
$
—
Property, plant and equipment expenditures
(247.2)
(238.1)
Proceeds from disposal of property, plant and equipment
3.3
3.7
Intangible assets expenditures
(70.3)
(105.8)
Net payments to equity accounted investees
(5.0)
(40.5)
Dividends received from equity accounted investees
28.7
30.3
Other
(5.2)
(7.2)
Net cash used in investing activities
$
(603.7)
$
(357.6)
Financing activities
Net proceeds from (repayment of) borrowing under revolving credit facilities
$
97.7
$
(407.8)
Proceeds from long-term debt
314.7
426.1
Repayment of long-term debt
(237.8)
(41.1)
Repayment of lease liabilities
(42.8)
(57.0)
Net proceeds from the issuance of common shares
50.2
7.6
Repurchase and cancellation of common shares
(21.3)
—
Other
(0.9)
—
Net cash provided by (used in) financing activities
$
159.8
$
(72.2)
Effect of foreign currency exchange differences on cash and cash equivalents
$
12.5
$
(15.0)
Net increase (decrease) in cash and cash equivalents
$
142.4
$
(93.1)
Cash and cash equivalents, beginning of period
160.1
217.6
Cash and cash equivalents, end of period
$
302.5
$
124.5
Contacts
Media:
Samantha Golinski, Vice President, Public Affairs and Global Communications, 1-438-805-5856, samantha.golinski@cae.com
Investor Relations:
Andrew Arnovitz, Senior Vice President, Investor Relations and Enterprise Risk Management, 1-514-734-5760, andrew.arnovitz@cae.com
View original content:https://www.prnewswire.com/news-releases/cae-reports-third-quarter-fiscal-2025-results-302376524.html
SOURCE CAE Inc.

You may like
Technology
As ADA Anniversary Approaches, University of Phoenix Survey Highlights AI’s Potential to Advance Accessibility in Work and Learning
Published
49 minutes agoon
July 24, 2026By
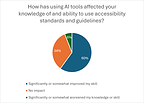
Survey conducted by The Harris Poll on behalf of University of Phoenix finds among those already using AI in the workplace, 60% say AI has improved their knowledge of and ability to use accessibility standards and guidelines.
PHOENIX, July 24, 2026 /PRNewswire/ — As artificial intelligence becomes part of how people work, learn and solve problems, a new University of Phoenix survey conducted by The Harris Poll finds that recent working learners see meaningful opportunities for AI to support accessibility. The survey was designed to understand the impact of AI in the workplace and learning environments on accessibility, defined as ensuring digital content, tools and resources, including AI tools and output, are usable by people with different abilities through inclusive design, use of assistive technology or conformance with accessibility standards, such as the Web Content Accessibility Guidelines (WCAG). The findings are being released ahead of the 36th anniversary of the Americans with Disabilities Act (ADA) on July 26.
The survey, conducted among 1,019 U.S. employed adults who completed a professionally presented training or school course in the past 12 months (“recent working learners”), found that, among workers already using AI in the workplace, 3 in 5 (60%) say AI has improved their knowledge of and ability to use accessibility standards and guidelines, including nearly 1 in 5 (19%) who report significant improvement.
While the findings point to optimism about AI’s accessibility potential, they also reveal an opportunity for clearer organizational guidance: 45% of respondents say accessibility is absent from, unclear in, or they are uncertain whether it is covered by their workplace AI policies.
“The reality is that accessibility benefits everyone,” shares Kelly Hermann, Vice President of Accessibility and Student Affairs at University of Phoenix. “If accessibility is built in from the beginning, organizations are more likely to create AI-enabled environments that are universally usable. Clearer content, better summaries, accurate captions, and multiple formats can help workers and learners with disabilities, but they also help busy adults, multilingual learners, mobile users, and anyone trying to absorb information quickly.”
Key findings from the survey include:
Workers see AI’s accessibility potential: 89% of recent working learners identify workflows that could benefit from AI and accessibility tools, especially creating accessible documents, presentations, websites or learning materials (38%), presenting information in different formats such as plain language, audio, summaries or translations (33%), and training employees or learners on accessibility practices (30%).AI may help build accessibility awareness: Among those already using AI in the workplace, 60% say AI has improved their knowledge of and ability to use accessibility standards and guidelines.Accessibility is not always clear in workplace AI policies: 45% of recent working learners say accessibility is absent from, unclear in, or they are uncertain whether it is covered by their workplace AI policies.AI tools may not yet fully support different access needs: Among those who use workplace AI tools, only about a quarter of survey respondents (27%) say AI tools available through their workplace or professional learning environment support people with disabilities very well.Human oversight remains important: 36% of recent working learners say human review for important decisions or high-impact work should be part of responsible AI use at work or school.Workers also recognize how AI and accessibility can have an impact on their own career journey: 90% of recent working learners identify AI and accessibility skills that would be valuable in their current or desired career field, including 45% who see value in understanding when AI-generated content needs human review.
Why accessibility is essential to responsible AI adoption
As AI tools are used to draft documents, summarize information, generate captions and transcripts, create image descriptions, support learning and assist with workplace tasks, accessibility becomes central to responsible use. Poorly implemented AI can also create or amplify barriers, including inaccessible content, inaccurate summaries, biased outputs and tools that do not work effectively with assistive technologies.
“Responsible AI is not only about productivity,” Hermann said. “It is about whether the technology works for the people who need to use it. AI can help create more accessible materials and more flexible ways to engage with information, but it still requires clear policies, practical training and human judgment to make sure the outputs are accurate, applicable and usable.”
What the findings mean for employers and educators
The survey suggests that organizations have an opportunity to align AI adoption with supportive design, accessibility practices and workforce training. Employers and educators can take immediate steps by:
Naming accessibility directly in AI policies and guidance.Choosing AI tools with accessibility and assistive technology compatibility in mind.Training workers and learners to create, check and improve accessible AI-generated content.Making support pathways clear for people who experience barriers using AI tools.Keeping human review in place for important decisions, high-impact work and accessibility-sensitive outputs.
The survey also found workers want practical AI training. The most helpful resources identified by recent working learners include real-world examples from their field or industry (36%), hands-on practice using realistic workplace scenarios (34%) and step-by-step demonstrations of common tasks (33%).
Accessibility insights from University of Phoenix
Hermann shared the survey findings ahead of the ADA anniversary in recent media interviews. Hermann oversees the University’s accessibility initiative, including evaluation and remediation of curricular resources, the Center for Access, Resources, Engagement and Support Services (CARES), and the Office of Collaborative Learning and Educational Engagement. Her work focuses on fostering accessible and welcoming educational environments for students, faculty and staff.
Hermann’s office at University of Phoenix also convenes accessibility conversations through initiatives such as Access Amplified™, a free, annual virtual event focused on advancing digital accessibility in web development. The event brings together engineers, developers, designers, content authors and digital strategists for practical strategies and human-centered conversations that address the gap between coding practices and how users with assistive technology experience the web.
About the survey
The survey was conducted online within the United States by The Harris Poll on behalf of University of Phoenix from June 22–29, 2026, among 1,019 employed adults ages 18 and older who have taken a professionally presented training or a school course in the past 12 months, referred to as “recent working learners.” Data were weighted where necessary by age, gender, race/ethnicity, region, education, employment, marital status, household size, household income and smoking status to bring them in line with their actual proportions in the population.
Respondents for this survey were selected from among those who have agreed to participate in surveys. The sampling precision of Harris online polls is measured by using a Bayesian credible interval. For this study, the sample data is accurate to within +/- 3.8 percentage points using a 95% confidence level. This credible interval will be wider among subsets of the surveyed population of interest.
Review the complete survey at phoenix.edu/aiaccessibility.
About University of Phoenix
University of Phoenix is Built for Real Life. 50 Years Strong. The University innovates to help working adults enhance their careers and develop skills in a rapidly changing world through flexible online learning, relevant courses, academic AI pillars, and skills-mapped curriculum for associate, bachelor’s and master’s degree programs. Active students and alumni have access to Career Services for Life® resources including career guidance and tools. For more information, visit phoenix.edu.
View original content to download multimedia:https://www.prnewswire.com/news-releases/as-ada-anniversary-approaches-university-of-phoenix-survey-highlights-ais-potential-to-advance-accessibility-in-work-and-learning-302834448.html
SOURCE University of Phoenix
Technology
Mastech Digital to Announce Second Quarter 2026 Financial Results; Participate in Upcoming Investor Conference
Published
2 hours agoon
July 24, 2026By
PITTSBURGH, July 24, 2026 /PRNewswire/ — Mastech Digital, Inc. (NYSE American: MHH) (“Mastech Digital”), a leading provider of Digital Transformation IT Services, today announced the date for the release of its financial results for the second quarter ended June 30, 2026, and its participation in an upcoming investor conference.
Second Quarter 2026 Earnings:
Mastech Digital will report its financial results for the second quarter 2026 before the market opens on Thursday, August 6, 2026. Management will host a live conference call and webcast at 9:00 a.m. Eastern Time on that day to discuss the Company’s financial performance and operating results. The conference call will be hosted by Nirav Patel, President and CEO, and Kannan Sugantharaman, Chief Financial and Operations Officer.
Those wishing to participate via webcast should access the call through Mastech Digital’s Investor Relations website at https://investors.mastechdigital.com. Those wishing to participate via telephone may dial in at 1-800-715-9871 (USA) or 1-646-307-1963 (International) with the passcode 7506988. The replay will be available via webcast through Mastech Digital’s Investor Relations website.
Upcoming Investor Conference:
Mr. Sugantharaman will host a fireside chat at the Sidoti Micro-Cap Investor Conference on Wednesday, August 19, 2026, at 9:15 a.m. Eastern Time.
Mastech Digital management is scheduled to host virtual one-on-one and small group meetings with investors during the conference on August 19-20, 2026. Investors interested in arranging a meeting should contact their Sidoti representative or reach out to the Mastech Digital investor relations team at investors@mastechdigital.com.
About Mastech Digital, Inc.
Mastech Digital (NYSE American: MHH) is a leading provider of Digital Transformation IT Services. The Company offers Data Management, Analytics & AI Solutions, and IT Staffing Services with a digital-first approach. A minority-owned enterprise, Mastech Digital is headquartered in Pittsburgh, PA, with offices across the U.S., Canada, Europe, and India. Visit us at www.mastechdigital.com.
Investor Relations Contact:
investors@mastechdigital.com
View original content to download multimedia:https://www.prnewswire.com/news-releases/mastech-digital-to-announce-second-quarter-2026-financial-results-participate-in-upcoming-investor-conference-302834421.html
SOURCE Mastech Digital, Inc.
Technology
SOLAI Limited Announces Extraordinary General Meeting
Published
2 hours agoon
July 24, 2026By
AKRON, Ohio, July 24, 2026 /PRNewswire/ — SOLAI Limited (NYSE: SLAI) (“SOLAI” or the “Company”) (previously known as “BIT Mining Limited”), a technology-driven personal AI and digital infrastructure provider, today announced that it will hold its extraordinary general meeting of shareholders at 428 South Seiberling Street, Akron, Ohio, US on August 14, 2026 at 10:00 a.m., New York time.
Holders of record of ordinary shares and preference shares of the Company at the close of business on July 20, 2026, New York time (the “Record Date”) are entitled to receive notice of, and to attend and vote at, the extraordinary general meeting or any adjournment thereof. Holders of the Company’s American Depositary Shares (“ADSs”) who wish to exercise their voting rights for the underlying ordinary shares must act through the depositary of the Company’s ADS program, Deutsche Bank Trust Company Americas.
The notice of the extraordinary general meeting, which sets forth the resolutions to be submitted to shareholder approval at the extraordinary general meeting is available on the Investor Relations section of the Company’s website at https://ir.solai.com.
About SOLAI Limited
SOLAI Limited (previously known as “BIT Mining Limited”) (NYSE: SLAI) (previously traded under “BTCM”) is a technology-driven personal AI and digital infrastructure provider. Building upon its historical legacy in digital asset mining and blockchain network operations, the Company is leveraging extensive experience in large-scale hardware deployment, data center operations, and high-performance computing to build the foundational infrastructure for personal AI computing and digital asset ecosystems globally.
For more information:
SOLAI Limited
ir@solai.com
ir.solai.com
www.solai.com
Christensen Advisory
Jason Ng
Tel: +852-2117-0861
Email: solai@christensencomms.com
View original content:https://www.prnewswire.com/news-releases/solai-limited-announces-extraordinary-general-meeting-302834034.html
SOURCE SOLAI Limited


As ADA Anniversary Approaches, University of Phoenix Survey Highlights AI’s Potential to Advance Accessibility in Work and Learning

EU authorities include HTX exchange in Russian sanctions
Mastech Digital to Announce Second Quarter 2026 Financial Results; Participate in Upcoming Investor Conference
Send Rakhi to UK swiftly with UK Gifts Portal

Whiteboard Series with NEAR | Ep: 45 Joel Thorstensson from ceramic.network

New Gooseneck Omni Antennas Offer Enhanced Signals in a Durable Package

Why You Should Build on #NEAR – Co-founder Illia Polosukhin at CV Labs
Whiteboard Series with NEAR | Ep: 45 Joel Thorstensson from ceramic.network

NEAR End of Year Town Hall 2021: The Open Web World, MetaBUILD 2 Hackathon and 2021 recap
Trending
-

 Coin Market5 days ago
Will the US get CLARITY this week? Bitcoin’s new $80K target: Hodler’s Digest, July 19
-

 Technology5 days ago
“Every Day CO₂ Challenge”: More Than a Game, A New Way of Learning
-

 Technology5 days ago
Trakka Systems to Demonstrate Advanced ISR Capabilities at Farnborough International Airshow 2026
-

 Technology5 days ago
Powering ASEAN’s Manufacturing Transformation: IME 2026 Connects Technology, Industry and Opportunity
-

 Technology4 days ago
Signeasy expands beyond eSignatures with Intelligent Contract Management for growing businesses
-
 Technology5 days ago
DBS named Asia’s Best Digital Bank by Euromoney, recognised for its AI leadership and responsible innovation
-
 Technology5 days ago
CNPC launches China’s first full-chain green, low-carbon ethylene project
-

 Technology5 days ago
BOC Group Releases ADONIS 19.0 LTS to Bring Smarter Support into Everyday BPM Work