
Technology
Digital Realty Reports Fourth Quarter 2024 Results
Published
1 year agoon
By
DALLAS, Feb. 13, 2025 /PRNewswire/ — Digital Realty (NYSE: DLR), the largest global provider of cloud- and carrier-neutral data center, colocation, and interconnection solutions, announced today financial results for the fourth quarter of 2024. All per share results are presented on a fully diluted basis.
Highlights
Reported net income available to common stockholders of $0.51 per share in 4Q24, compared to $0.03 in 4Q23Reported FFO per share of $1.61 in 4Q24, compared to $1.53 in 4Q23Reported Core FFO per share of $1.73 in 4Q24, compared to $1.63 in 4Q23Reported rental rate increases on renewal leases of 4.7% on a cash basis in 4Q24Signed total bookings during 4Q24 that are expected to generate $100 million of annualized GAAP rental revenue, including a record $76 million contribution from the 0–1 megawatt plus interconnection categoryReported backlog of $797 million of annualized GAAP base rent at the end of 4Q24Introduced 2025 Constant-Currency Core FFO per share outlook of $7.05 – $7.15
Financial Results
Digital Realty reported revenues of $1.4 billion in the fourth quarter of 2024, a slight increase from the previous quarter and a 5% increase from the same quarter last year.
The company delivered net income of $186 million in the fourth quarter of 2024, and net income available to common stockholders of $179 million, or $0.51 per share, compared to $0.09 per share in the previous quarter and $0.03 per share in the same quarter last year.
Digital Realty generated Adjusted EBITDA of $751 million in the fourth quarter of 2024, a 1% decrease from the previous quarter and a 7% increase over the same quarter last year.
The company reported Funds From Operations (FFO) of $545 million in the fourth quarter of 2024, or $1.61 per share, compared to $1.55 per share in the previous quarter and $1.53 per share in the same quarter last year.
Excluding certain items that do not represent core expenses or revenue streams, Digital Realty delivered Core FFO per share of $1.73 in the fourth quarter of 2024, compared to $1.67 per share in the previous quarter and $1.63 per share in the same quarter last year. Digital Realty delivered Constant-Currency Core FFO per share of $1.73 for the fourth quarter of 2024 and $6.72 per share for the twelve-month period ended December 31, 2024.
“2024 was a remarkable year for Digital Realty, with record leasing driving impressive growth in our revenue backlog, and providing compelling visibility into our accelerating earnings growth,” said Digital Realty President & Chief Executive Officer Andy Power. “In the fourth quarter, we achieved multiple milestones across our growing 0-1 megawatt plus interconnection segment, eclipsing last quarter’s bookings record and adding a record 166 new customers to the platform, demonstrating the continued success of our global, full spectrum data center strategy.”
Leasing Activity
In the fourth quarter, Digital Realty signed total bookings that are expected to generate $100 million of annualized GAAP rental revenue, including a $62 million contribution from the 0–1 megawatt category and a $15 million contribution from interconnection.
The weighted-average lag between new leases signed during the fourth quarter of 2024 and the contractual commencement date was six months. The backlog of signed-but-not-commenced leases at quarter-end was $797 million of annualized GAAP base rent at Digital Realty’s share.
In addition to new leases signed, Digital Realty also signed renewal leases representing $250 million of annualized cash rental revenue during the quarter. Rental rates on renewal leases signed during the fourth quarter of 2024 increased 4.7% on a cash basis and 9.1% on a GAAP basis.
1
New leases signed during the fourth quarter of 2024 are summarized by region and product as follows:
Annualized GAAP
Base Rent
Square Feet
GAAP Base Rent
GAAP Base Rent
Americas
(in thousands)
(in thousands)
per Square Foot
Megawatts
per Kilowatt
0-1 MW
$29,612
90
$329
8.9
$277
> 1 MW
3,978
20
197
2.2
154
Other (1)
409
7
58
—
—
Total
$33,999
117
$290
11.1
$253
EMEA (2)
0-1 MW
$25,997
100
$259
9.4
$232
> 1 MW
9,121
63
146
5.6
136
Other (1)
91
1
97
—
—
Total
$35,209
164
$215
15.0
$196
Asia Pacific (2)
0-1 MW
$6,139
19
$322
1.5
$352
> 1 MW
9,474
48
196
5.8
136
Other (1)
100
1
70
—
—
Total
$15,713
69
$229
7.3
$179
All Regions (2)
0-1 MW
$61,748
209
$295
19.7
$261
> 1 MW
22,573
131
172
13.6
139
Other (1)
599
9
64
—
—
Total
$84,920
350
$243
33.3
$211
Interconnection
$14,587
N/A
N/A
N/A
N/A
Grand Total
$99,507
350
$243
33.3
$211
Note: Totals may not foot due to rounding differences.
(1)
Other includes Powered Base Building® shell capacity as well as storage and office space within fully improved data center facilities.
(2)
Based on quarterly average exchange rates during the three months ended December 31, 2024.
Investment Activity
As previously disclosed, during the quarter, Digital Realty closed on the acquisition of a 6.7-acre parcel in Richardson, Texas, adjacent to its existing campus, for approximately $15 million, which can support the development of up to 100 megawatts of incremental IT capacity.
During the quarter, Digital Realty also closed on the following acquisitions:
156 acres of land in Charlotte, North Carolina for $160 million, which can support up to 400 megawatts of IT capacityThree acres of land in Madrid, Spain for approximately €25 million or $26 million, which can support up to 24 megawatts of IT capacity
During the quarter, Digital Realty closed on the following dispositions:
A facility in San Jose, California for approximately $10 millionA facility in Trumbull, Connecticut for approximately $10 millionA facility in Redhill, United Kingdom for approximately £64 million or $80 million
Also, during the quarter, Digital Realty closed on the sale to Digital Core REIT (SGX: DCRU) of an additional 15.1% interest in a data center located in Frankfurt, Germany for approximately €71 million or $74 million. The transaction valued the Frankfurt facility at €470 million or $508 million (at 100% share). Including two prior investments, Digital Core REIT now owns a 65% interest in this Frankfurt data center.
Further during the quarter, Digital Realty and Blackstone Inc. closed on the second phase of their $7 billion hyperscale data center development joint venture. The second phase includes portions of data center campuses in Frankfurt and Northern Virginia, which will support the growth of existing hyperscale data center capacity in the regions.
2
Balance Sheet
Digital Realty had approximately $16.7 billion of total debt outstanding as of December 31, 2024, comprised of $16.0 billion of unsecured debt and approximately $0.7 billion of secured debt and other. At the end of the fourth quarter of 2024, net debt-to-Adjusted EBITDA was 4.8x, debt-plus-preferred-to-total enterprise value was 22.3% and fixed charge coverage was 4.2x.
Digital Realty completed the following financing transactions during the fourth quarter:
In November, the company issued $1.15 billion of 1.875% exchangeable notes due 2029, for net proceeds of approximately $1.13 billion;In November, the company repaid a $500 million term loan; andThe company also sold 5.0 million shares of common stock under its At-The-Market (ATM) equity issuance program at a weighted average price of $185.63 per share, for net proceeds of approximately $923 million.
Subsequent to quarter end, the company issued €850 million of 3.875% notes due 2035, for net proceeds of approximately €841 million ($867 million). In January, the company also repaid £400 million ($501 million) of 4.25% senior notes.
3
2025 Outlook
Digital Realty introduced its 2025 Constant-Currency Core FFO per share outlook of $7.05 – $7.15. The assumptions underlying the outlook are summarized in the following table.
As of
Top-Line and Cost Structure
February 13, 2025
Total revenue
$5.800 – $5.900 billion
Net non-cash rent adjustments (1)
($45 – $50 million)
Adjusted EBITDA
$3.100 – $3.200 billion
G&A
$500 – $510 million
Internal Growth
Rental rates on renewal leases
Cash basis
4.0% – 6.0%
GAAP basis
6.0% – 8.0%
Year-end portfolio occupancy
+100 – 200 bps
“Same-Capital” cash NOI growth (2)
3.5% – 4.5%
Foreign Exchange Rates
U.S. Dollar / Pound Sterling
$1.20 – $1.25
U.S. Dollar / Euro
$1.00 – $1.05
External Growth
Dispositions / Joint Venture Capital
Dollar volume
$500 – $1,000 million
Cap rate
0.0% – 10.0%
Development
CapEx (Net of Partner Contributions) (3)
$3,000 – $3,500 million
Average stabilized yields
10.0%+
Enhancements and other non-recurring CapEx (4)
$30 – $35 million
Recurring CapEx + capitalized leasing costs (5)
$320 – $335 million
Balance Sheet
Long-term debt issuance
Dollar amount
$900 – $1,500 million
Pricing
5.0% – 5.5%
Net income per diluted share
$2.10 – $2.20
Real estate depreciation and (gain) / loss on sale
$4.50 – $4.50
Funds From Operations / share (NAREIT-Defined)
$6.60 – $6.70
Non-core expenses and revenue streams
$0.40 – $0.40
Core Funds From Operations / share
$7.00 – $7.10
Foreign currency translation adjustments
$0.05 – $0.05
Constant-Currency Core Funds From Operations / share
$7.05 – $7.15
(1)
Net non-cash rent adjustments represent the sum of straight-line rental revenue and straight-line rental expense, as well as the amortization of above- and below-market leases (i.e., ASC 805 adjustments).
(2)
The “Same-Capital” pool includes properties owned as of December 31, 2023 with less than 5% of total rentable square feet under development. It excludes properties that were undergoing, or were expected to undergo, development activities in 2024-2025, properties classified as held for sale, and properties sold or contributed to joint ventures for all periods presented. The 2025 “Same-Capital” cash NOI growth outlook is presented on a constant currency basis.
(3)
Excludes land acquisitions and includes Digital Realty’s share of JV contributions. Figure is net of JV partner contributions.
(4)
Other non-recurring CapEx represents costs incurred to enhance the capacity or marketability of operating properties, such as network fiber initiatives and software development costs.
(5)
Recurring CapEx represents non-incremental improvements required to maintain current revenues, including second-generation tenant improvements and leasing commissions.
Note: The company does not provide a reconciliation for non-GAAP estimates on a forward-looking basis, where it is unable to provide a meaningful or accurate calculation or estimation of reconciling items, and the information is not available without unreasonable effort. Please see Non-GAAP Financial Measures in this document for further discussion.
4
Non-GAAP Financial Measures
This document contains non-GAAP financial measures, including FFO, Core FFO, Constant Currency Core FFO, Adjusted FFO, Net Operating Income (NOI), “Same-Capital” Cash NOI and Adjusted EBITDA. A reconciliation from U.S. GAAP net income available to common stockholders to FFO, a reconciliation from FFO to Core FFO, a reconciliation from Core FFO to Adjusted FFO, reconciliation from NOI to Cash NOI, and definitions of FFO, Core FFO, Constant Currency Core FFO, Adjusted FFO, NOI and “Same-Capital” Cash NOI are included as an attachment to this document. A reconciliation from U.S. GAAP net income available to common stockholders to Adjusted EBITDA, a definition of Adjusted EBITDA and definitions of net debt-to-Adjusted EBITDA, debt-plus-preferred-to-total enterprise value, cash NOI, and fixed charge coverage ratio are included as an attachment to this document.
The company does not provide a reconciliation for non-GAAP estimates on a forward-looking basis, where it is unable to provide a meaningful or accurate calculation or estimation of reconciling items and the information is not available without unreasonable effort. This is due to the inherent difficulty of forecasting the timing and/or amount of various items that would impact net income attributable to common stockholders per diluted share, which is the most directly comparable forward-looking GAAP financial measure. This includes, for example, external growth factors, such as dispositions, and balance sheet items such as debt issuances, that have not yet occurred, are out of the company’s control and/or cannot be reasonably predicted. For the same reasons, the company is unable to address the probable significance of the unavailable information. Forward-looking non-GAAP financial measures provided without the most directly comparable GAAP financial measures may vary materially from the corresponding GAAP financial measures.
Investor Conference Call
Prior to Digital Realty’s investor conference call at 5:00 p.m. ET / 4:00 p.m. CT on February 13, 2025, a presentation will be posted to the Investors section of the company’s website at https://investor.digitalrealty.com. The presentation is designed to accompany the discussion of the company’s fourth quarter 2024 financial results and operating performance. The conference call will feature President & Chief Executive Officer Andy Power and Chief Financial Officer Matt Mercier.
To participate in the live call, investors are invited to dial +1 (888) 317-6003 (for domestic callers) or +1 (412) 317-6061 (for international callers) and reference the conference ID# 5600611 at least five minutes prior to start time. A live webcast of the call will be available via the Investors section of Digital Realty’s website at https://investor.digitalrealty.com.
Telephone and webcast replays will be available after the call until March 13, 2025. The telephone replay can be accessed by dialing +1 (877) 344-7529 (for domestic callers) or +1 (412) 317-0088 (for international callers) and providing the conference ID# 3368293. The webcast replay can be accessed on Digital Realty’s website.
About Digital Realty
Digital Realty brings companies and data together by delivering the full spectrum of data center, colocation, and interconnection solutions. PlatformDIGITAL®, the company’s global data center platform, provides customers with a secure data meeting place and a proven Pervasive Datacenter Architecture (PDx®) solution methodology for powering innovation and efficiently managing Data Gravity challenges. Digital Realty gives its customers access to the connected data communities that matter to them with a global data center footprint of 300+ facilities in 50+ metros across 25+ countries on six continents. To learn more about Digital Realty, please visit digitalrealty.com or follow us on LinkedIn and X.
Contact Information
Matt Mercier
Chief Financial Officer
Digital Realty
(415) 874-2803
Jordan Sadler / Jim Huseby
Investor Relations
Digital Realty
(415) 275-5344
5
Consolidated Quarterly Statements of Operations
Fourth Quarter 2024
Unaudited and in Thousands, Except Per Share Data
Three Months Ended
Twelve Months Ended
31-Dec-24
30-Sep-24
30-Jun-24
31-Mar-24
31-Dec-23
31-Dec-24
31-Dec-23
Rental revenues
$958,892
$956,351
$912,994
$894,409
$885,694
$3,722,646
$3,512,926
Tenant reimbursements – Utilities
302,664
305,097
274,505
276,357
316,634
1,158,623
1,299,676
Tenant reimbursements – Other
38,591
39,624
41,964
38,434
46,418
158,612
197,636
Interconnection & other
112,360
112,655
109,505
108,071
106,413
442,591
419,934
Fee income
23,316
12,907
15,656
13,010
14,330
64,888
44,926
Other
40
4,581
2,125
862
144
7,608
1,963
Total Operating Revenues
$1,435,862
$1,431,214
$1,356,749
$1,331,143
$1,369,633
$5,554,968
$5,477,061
Utilities
$337,534
$356,063
$315,248
$324,571
$366,083
$1,333,416
$1,471,836
Rental property operating
273,104
249,796
237,653
224,369
237,118
984,921
909,830
Property taxes
46,044
45,633
49,620
41,156
40,161
182,453
199,581
Insurance
6,007
4,869
4,755
2,694
3,794
18,325
16,823
Depreciation & amortization
455,355
459,997
425,343
431,102
420,475
1,771,797
1,694,859
General & administration
124,470
115,120
119,511
114,419
109,235
473,521
431,004
Severance, equity acceleration and legal expenses
2,346
2,481
884
791
7,565
6,502
18,054
Transaction and integration expenses
11,797
24,194
26,072
31,839
40,226
93,902
84,722
Provision for impairment
22,881
—
168,303
—
5,363
191,184
118,363
Other expenses
12,002
4,774
(529)
10,836
5,580
27,083
7,529
Total Operating Expenses
$1,291,540
$1,262,928
$1,346,860
$1,181,776
$1,235,598
$5,083,104
$4,952,600
Operating Income
$144,322
$168,286
$9,889
$149,367
$134,035
$471,864
$524,461
Equity in earnings / (loss) of unconsolidated joint ventures
(36,201)
(26,486)
(41,443)
(16,008)
(29,955)
(120,138)
(29,791)
Gain / (loss) on sale of investments
144,885
(556)
173,709
277,787
(103)
595,825
900,531
Interest and other income / (expense), net
44,517
37,756
62,261
9,709
50,269
154,243
68,431
Interest (expense)
(104,742)
(123,803)
(114,756)
(109,535)
(113,638)
(452,836)
(437,741)
Income tax benefit / (expense)
(4,928)
(12,427)
(14,992)
(22,413)
(20,724)
(54,760)
(75,579)
Loss on debt extinguishment and modifications
(2,165)
(2,636)
—
(1,070)
—
(5,871)
—
Net Income
$185,688
$40,134
$74,668
$287,837
$19,884
$588,327
$950,311
Net (income) / loss attributable to noncontrolling interests
3,881
11,059
5,552
(6,329)
8,419
14,163
(1,474)
Net Income Attributable to Digital Realty Trust, Inc.
$189,569
$51,193
$80,220
$281,508
$28,304
$602,490
$948,838
Preferred stock dividends
(10,181)
(10,181)
(10,181)
(10,181)
(10,181)
(40,725)
(40,725)
Net Income / (Loss) Available to Common Stockholders
$179,388
$41,012
$70,039
$271,327
$18,122
$561,766
$908,113
Weighted-average shares outstanding – basic
333,376
327,977
319,537
312,292
305,781
323,336
298,603
Weighted-average shares outstanding – diluted
340,690
336,249
327,946
320,798
314,995
331,547
309,065
Weighted-average fully diluted shares and units
346,756
342,374
334,186
326,975
321,173
337,697
315,113
Net income / (loss) per share – basic
$0.54
$0.13
$0.22
$0.87
$0.06
$1.74
$3.04
Net income / (loss) per share – diluted
$0.51
$0.09
$0.20
$0.82
$0.03
$1.61
$2.88
6
Funds From Operations and Core Funds From Operations
Fourth Quarter 2024
Unaudited and in Thousands, Except Per Share Data
Three Months Ended
Twelve Months Ended
Reconciliation of Net Income to Funds From Operations (FFO)
31-Dec-24
30-Sep-24
30-Jun-24
31-Mar-24
31-Dec-23
31-Dec-24
31-Dec-23
Net Income / (Loss) Available to Common Stockholders
$179,388
$41,012
$70,039
$271,327
$18,122
$561,766
$908,113
Adjustments:
Non-controlling interest in operating partnership
4,000
1,000
1,500
6,200
410
12,700
20,710
Real estate related depreciation & amortization (1)
445,462
449,086
414,920
420,591
410,167
1,730,059
1,657,239
Reconciling items related to non-controlling interests
(19,531)
(19,746)
(17,317)
(8,017)
(15,377)
(64,612)
(57,477)
Unconsolidated JV real estate related depreciation & amortization
49,463
48,474
47,117
47,877
64,833
192,931
177,153
(Gain) / loss on real estate transactions
(137,047)
556
(173,709)
(286,704)
103
(596,904)
(908,356)
Provision for impairment
22,881
—
168,303
—
5,363
191,185
118,363
Funds From Operations
$544,616
$520,382
$510,852
$451,273
$483,621
$2,027,122
$1,915,745
Weighted-average shares and units outstanding – basic
339,442
334,103
325,777
318,469
311,960
329,485
304,651
Weighted-average shares and units outstanding – diluted (2) (3)
346,756
342,374
334,186
326,975
321,173
337,697
315,113
Funds From Operations per share – basic
$1.60
$1.56
$1.57
$1.42
$1.55
$6.15
$6.29
Funds From Operations per share – diluted (2) (3)
$1.61
$1.55
$1.57
$1.41
$1.53
$6.14
$6.20
Three Months Ended
Twelve Months Ended
Reconciliation of FFO to Core FFO
31-Dec-24
30-Sep-24
30-Jun-24
31-Mar-24
31-Dec-23
31-Dec-24
31-Dec-23
Funds From Operations
$544,616
$520,382
$510,852
$451,273
$483,621
$2,027,122
$1,915,745
Other non-core revenue adjustments (4)
4,537
(4,583)
(33,818)
3,525
(146)
(30,339)
26,393
Transaction and integration expenses
11,797
24,194
26,072
31,839
40,226
93,902
84,722
Loss on debt extinguishment and modifications
2,165
2,636
—
1,070
—
5,871
—
Severance, equity acceleration and legal expenses (5)
2,346
2,481
884
791
7,565
6,502
18,054
(Gain) / Loss on FX and derivatives revaluation
7,127
1,513
32,222
33,602
(24,804)
74,464
(39,000)
Other non-core expense adjustments (6)
14,229
11,120
2,271
10,052
1,956
37,671
3,905
Core Funds From Operations
$586,816
$557,744
$538,482
$532,153
$508,417
$2,215,194
$2,009,820
Weighted-average shares and units outstanding – diluted (2) (3)
339,982
334,476
326,181
319,138
312,356
329,899
305,138
Core Funds From Operations per share – diluted (2)
$1.73
$1.67
$1.65
$1.67
$1.63
$6.71
$6.59
(1) Real Estate Related Depreciation & Amortization
Three Months Ended
Twelve Months Ended
31-Dec-24
30-Sep-24
30-Jun-24
31-Mar-24
31-Dec-23
31-Dec-24
31-Dec-23
Depreciation & amortization per income statement
$455,355
$459,997
$425,343
$431,102
$420,475
$1,771,798
$1,694,859
Non-real estate depreciation
(9,894)
(10,911)
(10,424)
(10,511)
(10,308)
(41,739)
(37,619)
Real Estate Related Depreciation & Amortization
$445,462
$449,086
$414,920
$420,591
$410,167
$1,730,059
$1,657,239
(2)
Certain of Teraco’s minority indirect shareholders have the right to put their shares in an upstream parent company of Teraco to Digital Realty in exchange for cash or the equivalent value of shares of Digital Realty common stock, or a combination thereof. US GAAP requires Digital Realty to assume the put right is settled in shares for purposes of calculating diluted EPS. This same approach was utilized to calculate FFO/share. The potential future dilutive impact associated with this put right will be excluded from Core FFO and AFFO until settlement occurs – causing diluted share count to be higher for FFO than for Core FFO and AFFO. When calculating diluted FFO, Teraco related minority interest is added back to the FFO numerator as the denominator assumes all shares have been put back to Digital Realty.
Three Months Ended
Twelve Months Ended
31-Dec-24
30-Sep-24
30-Jun-24
31-Mar-24
31-Dec-23
31-Dec-24
31-Dec-23
Teraco noncontrolling share of FFO
$14,905
$9,828
$12,453
$9,768
$7,135
$46,954
$39,386
Teraco related minority interest
$14,905
$9,828
$12,453
$9,768
$7,135
$46,954
$39,386
(3)
For all periods presented, we have excluded the effect of dilutive series J, series K and series L preferred stock, as applicable, that may be converted into common stock upon the occurrence of specified change in control transactions as described in the articles supplementary governing the series J, series K and series L preferred stock, as applicable, which we consider highly improbable. See above for calculations of FFO and the share count detail section that follows the reconciliation of Core FFO to AFFO for calculations of weighted average common stock and units outstanding. For definitions and discussion of FFO and Core FFO, see the Definitions section.
(4)
Includes deferred rent adjustments related to a customer bankruptcy, joint venture development fees included in gains, lease termination fees and gain on sale of equity investment included in other income.
(5)
Relates to severance and other charges related to the departure of company executives and integration-related severance.
(6)
Includes write-offs associated with bankrupt or terminated customers, non-recurring legal and insurance expenses and adjustments to reflect our proportionate share of transaction costs associated with noncontrolling interests.
7
Adjusted Funds From Operations (AFFO)
Fourth Quarter 2024
Unaudited and in Thousands, Except Per Share Data
Three Months Ended
Twelve Months Ended
Reconciliation of Core FFO to AFFO
31-Dec-24
30-Sep-24
30-Jun-24
31-Mar-24
31-Dec-23
31-Dec-24
31-Dec-23
Core FFO available to common stockholders and unitholders
$586,816
$557,744
$538,482
$532,153
$508,417
$2,215,194
$2,009,820
Adjustments:
Non-real estate depreciation
9,894
10,911
10,424
10,511
10,308
41,739
37,619
Amortization of deferred financing costs
5,697
4,853
5,072
5,576
5,744
21,198
21,575
Amortization of debt discount/premium
1,324
1,329
1,321
1,832
973
5,805
4,973
Non-cash stock-based compensation expense
13,386
15,026
14,464
12,592
9,226
55,468
50,238
Straight-line rental revenue
(18,242)
(17,581)
334
9,976
(21,992)
(25,513)
(68,417)
Straight-line rental expense
(136)
1,690
782
1,111
(4,999)
3,447
(3,567)
Above- and below-market rent amortization
(269)
(742)
(1,691)
(854)
(856)
(3,555)
(4,404)
Deferred tax (benefit) / expense
(15,048)
(9,366)
(9,982)
(3,437)
33,448
(37,834)
16,452
Leasing compensation & internal lease commissions
10,505
10,918
10,519
13,291
9,848
45,233
45,040
Recurring capital expenditures (1)
(130,245)
(67,308)
(60,483)
(47,676)
(142,808)
(305,712)
(327,022)
AFFO available to common stockholders and unitholders (2)
$463,682
$507,474
$509,241
$535,073
$407,306
$2,015,471
$1,782,308
Weighted-average shares and units outstanding – basic
339,442
334,103
325,777
318,469
311,960
329,485
304,651
Weighted-average shares and units outstanding – diluted (3)
339,982
334,476
326,181
319,138
312,356
329,899
305,138
AFFO per share – diluted (3)
$1.36
$1.52
$1.56
$1.68
$1.30
$6.11
$5.84
Dividends per share and common unit
$1.22
$1.22
$1.22
$1.22
$1.22
$4.88
$4.88
Diluted AFFO Payout Ratio
89.5 %
80.4 %
78.1 %
72.8 %
93.6 %
79.9 %
83.5 %
Three Months Ended
Twelve Months Ended
Share Count Detail
31-Dec-24
30-Sep-24
30-Jun-24
31-Mar-24
31-Dec-23
31-Dec-24
31-Dec-23
Weighted Average Common Stock and Units Outstanding
339,442
334,103
325,777
318,469
311,960
329,485
304,651
Add: Effect of dilutive securities
540
373
404
669
396
413
487
Weighted Avg. Common Stock and Units Outstanding – diluted
339,982
334,476
326,181
319,138
312,356
329,899
305,138
(1)
Recurring capital expenditures represent non-incremental building improvements required to maintain current revenues, including second-generation tenant improvements and external leasing commissions. Recurring capital expenditures do not include acquisition costs contemplated when underwriting the purchase of a building, costs which are incurred to bring a building up to Digital Realty’s operating standards, or internal leasing commissions.
(2)
For a definition and discussion of AFFO, see the Definitions section. For a reconciliation of net income available to common stockholders to FFO and Core FFO, see above.
(3)
For all periods presented, we have excluded the effect of dilutive series J, series K and series L preferred stock, as applicable, that may be converted into common stock upon the occurrence of specified change in control transactions as described in the articles supplementary governing the series J, series K and series L preferred stock, as applicable, which we consider highly improbable. See above for calculations of FFO and for calculations of weighted average common stock and units outstanding.
8
Consolidated Balance Sheets
Fourth Quarter 2024
Unaudited and in Thousands, Except Per Share Data
31-Dec-24
30-Sep-24
30-Jun-24
31-Mar-24
31-Dec-23
Assets
Investments in real estate:
Real estate
$27,558,993
$28,808,770
$27,470,635
$27,122,796
$27,306,369
Construction in progress
5,164,334
5,175,054
4,676,012
4,496,840
4,635,215
Land held for future development
38,785
23,392
93,938
114,240
118,190
Investments in Real Estate
$32,762,112
$34,007,216
$32,240,584
$31,733,877
$32,059,773
Accumulated depreciation and amortization
(8,641,331)
(8,777,002)
(8,303,070)
(7,976,093)
(7,823,685)
Net Investments in Properties
$24,120,781
$25,230,214
$23,937,514
$23,757,784
$24,236,089
Investment in unconsolidated joint ventures
2,639,800
2,456,448
2,332,698
2,365,821
2,295,889
Net Investments in Real Estate
$26,760,582
$27,686,662
$26,270,212
$26,123,605
$26,531,977
Operating lease right-of-use assets, net
$1,178,853
$1,228,507
$1,211,003
$1,233,410
$1,414,256
Cash and cash equivalents
3,870,891
2,175,605
2,282,062
1,193,784
1,625,495
Accounts and other receivables, net (1)
1,257,464
1,274,460
1,222,403
1,217,276
1,278,110
Deferred rent, net
642,456
641,778
613,749
611,670
624,427
Goodwill
8,929,431
9,395,233
9,128,811
9,105,026
9,239,871
Customer relationship value, deferred leasing costs & other intangibles, net
2,178,054
2,367,467
2,315,143
2,359,380
2,500,237
Assets held for sale
—
—
—
287,064
478,503
Other assets
465,885
525,679
563,500
501,875
420,382
Total Assets
$45,283,616
$45,295,392
$43,606,883
$42,633,089
$44,113,257
Liabilities and Equity
Global unsecured revolving credit facilities, net
$1,611,308
$1,786,921
$1,848,167
$1,901,126
$1,812,287
Unsecured term loans, net
386,903
913,733
1,297,893
1,303,263
1,560,305
Unsecured senior notes, net of discount
13,962,852
13,528,061
12,507,551
13,190,202
13,422,342
Secured and other debt, net of discount
753,314
757,831
686,135
625,750
630,973
Operating lease liabilities
1,294,219
1,343,903
1,336,839
1,357,751
1,542,094
Accounts payable and other accrued liabilities
2,056,215
2,140,764
1,973,798
1,870,344
2,168,983
Deferred tax liabilities, net
1,084,562
1,223,771
1,132,090
1,121,224
1,151,096
Accrued dividends and distributions
418,661
—
—
—
387,988
Security deposits and prepaid rents
539,802
423,797
416,705
413,225
401,867
Obligations associated with assets held for sale
—
—
—
9,981
39,001
Total Liabilities
$22,107,836
$22,118,781
$21,199,178
$21,792,866
$23,116,936
Redeemable non-controlling interests
1,433,185
1,465,636
1,399,889
1,350,736
1,394,814
Equity
Preferred Stock: $0.01 par value per share, 110,000 shares authorized:
Series J Cumulative Redeemable Preferred Stock (2)
$193,540
$193,540
$193,540
$193,540
$193,540
Series K Cumulative Redeemable Preferred Stock (3)
203,264
203,264
203,264
203,264
203,264
Series L Cumulative Redeemable Preferred Stock (4)
334,886
334,886
334,886
334,886
334,886
Common Stock: $0.01 par value per share, 502,000 shares authorized (5)
3,337
3,285
3,231
3,097
3,088
Additional paid-in capital
28,079,738
27,229,143
26,388,393
24,508,683
24,396,797
Dividends in excess of earnings
(6,292,085)
(6,060,642)
(5,701,096)
(5,373,529)
(5,262,648)
Accumulated other comprehensive (loss), net
(1,182,283)
(657,364)
(884,715)
(850,091)
(751,393)
Total Stockholders’ Equity
$21,340,397
$21,246,112
$20,537,503
$19,019,850
$19,117,535
Noncontrolling Interests
Noncontrolling interest in operating partnership
$396,099
$427,930
$434,253
$438,422
$438,081
Noncontrolling interest in consolidated joint ventures
6,099
36,933
36,060
31,215
45,892
Total Noncontrolling Interests
$402,198
$464,863
$470,313
$469,637
$483,972
Total Equity
$21,742,595
$21,710,975
$21,007,816
$19,489,487
$19,601,507
Total Liabilities and Equity
$45,283,616
$45,295,392
$43,606,883
$42,633,089
$44,113,257
(1)
Net of allowance for doubtful accounts of $59,224 and $41,204 as of December 31, 2024 and December 31, 2023, respectively.
(2)
Series J Cumulative Redeemable Preferred Stock, 5.250%, $200,000 liquidation preference ($25.00 per share), 8,000 shares issued and outstanding as of December 31, 2024 and December 31, 2023.
(3)
Series K Cumulative Redeemable Preferred Stock, 5.850%, $210,000 liquidation preference ($25.00 per share), 8,400 shares issued and outstanding as of December 31, 2024 and December 31, 2023.
(4)
Series L Cumulative Redeemable Preferred Stock, 5.200%, $345,000 liquidation preference ($25.00 per share), 13,800 shares issued and outstanding as of December 31, 2024 and December 31, 2023.
(5)
Common Stock: 336,637 and 311,608 shares issued and outstanding as of December 31, 2024 and December 31, 2023, respectively.
9
Reconciliation of Earnings Before Interest, Taxes, Depreciation & Amortization and Financial Ratios
Fourth Quarter 2024
Unaudited and Dollars in Thousands
Three Months Ended
Reconciliation of Earnings Before Interest, Taxes, Depreciation & Amortization (EBITDA) (1)
31-Dec-24
30-Sep-24
30-Jun-24
31-Mar-24
31-Dec-23
Net Income / (Loss) Available to Common Stockholders
$179,388
$41,012
$70,039
$271,327
$18,122
Interest
104,742
123,803
114,756
109,535
113,638
Loss on debt extinguishment and modifications
2,165
2,636
—
1,070
—
Income tax expense (benefit)
4,928
12,427
14,992
22,413
20,724
Depreciation & amortization
455,355
459,997
425,343
431,102
420,475
EBITDA
$746,578
$639,875
$625,130
$835,446
$572,958
Unconsolidated JV real estate related depreciation & amortization
49,463
48,474
47,117
47,877
64,833
Unconsolidated JV interest expense and tax expense
32,255
34,951
27,704
34,271
42,140
Severance, equity acceleration and legal expenses
2,346
2,481
884
791
7,565
Transaction and integration expenses
11,797
24,194
26,072
31,839
40,226
(Gain) / loss on sale of investments
(144,885)
556
(173,709)
(277,787)
103
Provision for impairment
22,881
—
168,303
—
5,363
Other non-core adjustments, net (2)
24,539
8,642
743
21,608
(35,439)
Non-controlling interests
(3,881)
(11,059)
(5,552)
6,329
(8,419)
Preferred stock dividends
10,181
10,181
10,181
10,181
10,181
Adjusted EBITDA
$751,276
$758,296
$726,874
$710,556
$699,509
(1)
For definitions and discussion of EBITDA and Adjusted EBITDA, see the Definitions section.
(2)
Includes foreign exchange net unrealized gains/losses attributable to remeasurement, deferred rent adjustments related to a customer bankruptcy, write offs associated with bankrupt or terminated customers, non-recurring legal and insurance expenses, gain on sale of land option and lease termination fees.
Three Months Ended
Financial Ratios
31-Dec-24
30-Sep-24
30-Jun-24
31-Mar-24
31-Dec-23
Total GAAP interest expense
$104,742
$123,803
$114,756
$109,535
$113,638
Capitalized interest
34,442
28,312
27,592
28,522
33,032
Change in accrued interest and other non-cash amounts
(58,137)
43,720
(55,605)
55,421
(66,013)
Cash Interest Expense (3)
$81,046
$195,835
$86,743
$193,479
$80,657
Preferred stock dividends
10,181
10,181
10,181
10,181
10,181
Total Fixed Charges (4)
$149,364
$162,296
$152,529
$148,239
$156,851
Coverage
Interest coverage ratio (5)
4.5x
4.3x
4.3x
4.3x
4.2x
Cash interest coverage ratio (6)
6.9x
3.4x
6.4x
6.3x
3.2x
Fixed charge coverage ratio (7)
4.2x
4.1x
4.1x
4.0x
4.0x
Cash fixed charge coverage ratio (8)
6.3x
3.3x
5.9x
3.1x
5.9x
Leverage
Debt to total enterprise value (9)(10)
21.4 %
23.5 %
24.2 %
24.2 %
26.7 %
Debt-plus-preferred-stock-to-total-enterprise-value (10)(11)
22.3 %
24.5 %
25.3 %
25.3 %
27.9 %
Pre-tax income to interest expense (12)
2.8x
1.3x
1.7x
3.5x
1.2x
Net Debt-to-Adjusted EBITDA (13)
4.8x
5.4x
5.3x
5.7x
6.0x
(3)
Cash interest expense is interest expense less amortization of debt discount and deferred financing fees and includes interest that we capitalized. We consider cash interest expense to be a useful measure of interest as it excludes non-cash-based interest expense.
(4)
Fixed charges consist of GAAP interest expense, capitalized interest, and preferred stock dividends.
(5)
Adjusted EBITDA divided by GAAP interest expense plus capitalized interest (including our pro rata share of unconsolidated joint venture interest expense).
(6)
Adjusted EBITDA divided by cash interest expense (including our pro rata share of unconsolidated joint venture interest expense).
(7)
Adjusted EBITDA divided by fixed charges (including our pro rata share of unconsolidated joint venture fixed charges).
(8)
Adjusted EBITDA divided by the sum of cash interest expense and preferred stock dividends (including our pro rata share of unconsolidated joint venture cash fixed charges).
(9)
Total debt divided by market value of common equity plus debt plus preferred stock.
(10)
Total enterprise value defined as market value of common equity plus debt plus preferred stock.
(11)
Same as (9), except numerator includes preferred stock.
(12)
Calculated as net income plus interest expense divided by GAAP interest expense.
(13)
Calculated as total debt at balance sheet carrying value, plus capital lease obligations, plus Digital Realty’s pro rata share of unconsolidated joint venture debt, less cash and cash equivalents (including Digital Realty’s pro rata share of unconsolidated joint venture cash) divided by the product of Adjusted EBITDA (including Digital Realty’s pro rata share of unconsolidated joint venture EBITDA), multiplied by four.
10
Definitions
We calculate funds from operations, or FFO, in accordance with the standards established by the National Association of Real Estate Investment Trusts (Nareit) in the Nareit Funds From Operations White Paper – 2018 Restatement. FFO is a non-GAAP financial measure and represents net income (loss) (computed in accordance with GAAP), excluding gain (loss) from the disposition of real estate assets, provision for impairment, real estate related depreciation and amortization (excluding amortization of deferred financing costs), our share of unconsolidated JV real estate related depreciation & amortization, net income attributable to non-controlling interests in operating partnership and reconciling items related to non-controlling interests. Management uses FFO as a supplemental performance measure because, in excluding real estate related depreciation and amortization and gains and losses from property dispositions and after adjustments for unconsolidated partnerships and joint ventures, it provides a performance measure that, when compared year over year, captures trends in occupancy rates, rental rates and operating costs. We also believe that, as a widely recognized measure of the performance of REITs, FFO will be used by investors as a basis to compare our operating performance with that of other REITs. However, because FFO excludes depreciation and amortization and captures neither the changes in the value of our data centers that result from use or market conditions, nor the level of capital expenditures and capitalized leasing commissions necessary to maintain the operating performance of our data centers, all of which have real economic effect and could materially impact our financial condition and results from operations, the utility of FFO as a measure of our performance is limited. Other REITs may not calculate FFO in accordance with the Nareit definition and, accordingly, our FFO may not be comparable to other REITs’ FFO. FFO should be considered only as a supplement to net income computed in accordance with GAAP as a measure of our performance.
We present core funds from operations, or Core FFO, as a supplemental operating measure because, in excluding certain items that do not reflect core revenue or expense streams, it provides a performance measure that, when compared year over year, captures trends in our core business operating performance. We calculate Core FFO by adding to or subtracting from FFO (i) other non-core revenue adjustments, (ii) transaction and integration expenses, (iii) loss on debt extinguishment and modifications, (iv) gain on / issuance costs associated with redeemed preferred stock, (v) severance, equity acceleration and legal expenses, (vi) gain/loss on FX and derivatives revaluation, and (vii) other non-core expense adjustments. Because certain of these adjustments have a real economic impact on our financial condition and results from operations, the utility of Core FFO as a measure of our performance is limited. Other REITs may calculate Core FFO differently than we do and accordingly, our Core FFO may not be comparable to other REITs’ Core FFO. Core FFO should be considered only as a supplement to net income computed in accordance with GAAP as a measure of our performance.
We present adjusted funds from operations, or AFFO, as a supplemental operating measure because, when compared year over year, it assesses our ability to fund dividend and distribution requirements from our operating activities. We also believe that, as a widely recognized measure of the operations of REITs, AFFO will be used by investors as a basis to assess our ability to fund dividend payments in comparison to other REITs, including on a per share and unit basis. We calculate AFFO by adding to or subtracting from Core FFO (i) non-real estate depreciation, (ii) amortization of deferred financing costs, (iii) amortization of debt discount/premium, (iv) non-cash stock-based compensation expense, (v) straight-line rental revenue, (vi) straight-line rental expense, (vii) above- and below-market rent amortization, (viii) deferred tax expense / (benefit), (ix) leasing compensation and internal lease commissions, and (x) recurring capital expenditures. Other REITs may calculate AFFO differently than we do and, accordingly, our AFFO may not be comparable to other REITs’ AFFO. AFFO should be considered only as a supplement to net income computed in accordance with GAAP as a measure of our performance.
We believe that earnings before interest, loss on debt extinguishment and modifications, income taxes, and depreciation and amortization, or EBITDA, and Adjusted EBITDA (as defined below), are useful supplemental performance measures because they allow investors to view our performance without the impact of non-cash depreciation and amortization or the cost of debt and, with respect to Adjusted EBITDA, (i) unconsolidated joint venture real estate related depreciation & amortization, (ii) unconsolidated joint venture interest expense and tax, (iii) severance, equity acceleration and legal expenses, (iv) transaction and integration expenses, (v) gain (loss) on sale / deconsolidation, (vi) provision for impairment, (vii) other non-core adjustments, net, (viii) non-controlling interests, (ix) preferred stock dividends, and (x) issuance costs associated with redeemed preferred stock. Adjusted EBITDA is EBITDA excluding (i) unconsolidated joint venture real estate related depreciation & amortization, (ii) unconsolidated joint venture interest expense and tax, (iii) severance, equity acceleration and legal expenses, (iv) transaction and integration expenses, (v) gain (loss) on sale / deconsolidation, (vi) provision for impairment, (vii) other non-core adjustments, net, (viii) non-controlling interests, (ix) preferred stock dividends, and (x) gain on / issuance costs associated with redeemed preferred stock. In addition, we believe EBITDA and Adjusted EBITDA are frequently used by securities analysts, investors, and other interested parties in the evaluation of REITs. Because EBITDA and Adjusted EBITDA are calculated before recurring cash charges including interest expense and income taxes, exclude capitalized costs, such as leasing commissions, and are not adjusted for capital expenditures or other recurring cash requirements of our business, their utility as a measure of our performance is limited. Other REITs may calculate EBITDA and Adjusted EBITDA differently than we do and, accordingly, our EBITDA and Adjusted EBITDA may not be comparable to other REITs’ EBITDA and Adjusted EBITDA. Accordingly, EBITDA and Adjusted EBITDA should be considered only as supplements to net income computed in accordance with GAAP as a measure of our financial performance.
11
Net operating income, or NOI, represents rental revenue, tenant reimbursement revenue and interconnection revenue less utilities expense, rental property operating expenses, property taxes and insurance expenses (as reflected in the statement of operations). NOI is commonly used by stockholders, company management and industry analysts as a measurement of operating performance of the company’s rental portfolio. Cash NOI is NOI less straight-line rents and above- and below-market rent amortization. Cash NOI is commonly used by stockholders, company management and industry analysts as a measure of property operating performance on a cash basis. Same-Capital Cash NOI represents buildings owned as of December 31, 2022 of the prior year with less than 5% of total rentable square feet under development and excludes buildings that were undergoing, or were expected to undergo, development activities in 2023-2024, buildings classified as held for sale, and buildings sold or contributed to joint ventures for all periods presented (prior period numbers adjusted to reflect current same-capital pool). However, because NOI and cash NOI exclude depreciation and amortization and capture neither the changes in the value of our data centers that result from use or market conditions, nor the level of capital expenditures and capitalized leasing commissions necessary to maintain the operating performance of our data centers, all of which have real economic effect and could materially impact our results from operations, the utility of NOI and cash NOI as measures of our performance is limited. Other REITs may calculate NOI and cash NOI differently than we do and, accordingly, our NOI and cash NOI may not be comparable to other REITs’ NOI and cash NOI. NOI and cash NOI should be considered only as supplements to net income computed in accordance with GAAP as measures of our performance.
Additional Definitions
Net debt-to-Adjusted EBITDA ratio is calculated as total debt at balance sheet carrying value, plus capital lease obligations, plus Digital Realty’s pro rata share of unconsolidated joint venture debt, less cash and cash equivalents (including Digital Realty’s pro rata share of unconsolidated joint venture cash) divided by the product of Adjusted EBITDA (including Digital Realty’s pro rata share of unconsolidated joint venture EBITDA), multiplied by four.
Debt-plus-preferred-to-total enterprise value is total debt plus preferred stock divided by total debt plus the liquidation value of preferred stock and the market value of outstanding Digital Realty Trust, Inc. common stock and Digital Realty Trust, L.P. units, assuming the redemption of Digital Realty Trust, L.P. units for shares of Digital Realty Trust, Inc. common stock.
Fixed charge coverage ratio is Adjusted EBITDA divided by the sum of GAAP interest expense, capitalized interest and preferred stock dividends. For the quarter ended December 31, 2024, GAAP interest expense was $105 million, capitalized interest was $34 million and preferred stock dividends was $10 million.
Reconciliation of Net Operating Income (NOI)
Three Months Ended
Twelve Months Ended
(in thousands)
31-Dec-24
30-Sep-24
31-Dec-23
31-Dec-24
31-Dec-23
Operating income
$144,322
$168,286
$134,035
$471,864
$524,461
Fee income
(23,316)
(12,907)
(14,330)
(64,888)
(44,926)
Other income
(40)
(4,581)
(144)
(7,608)
(1,963)
Depreciation and amortization
455,355
459,997
420,475
1,771,797
1,694,859
General and administrative
124,470
115,120
109,235
473,521
431,004
Severance, equity acceleration and legal expenses
2,346
2,481
7,565
6,502
18,054
Transaction expenses
11,797
24,194
40,226
93,902
84,722
Provision for impairment
22,881
—
5,363
191,184
118,363
Other expenses
12,002
4,774
5,580
27,083
7,529
Net Operating Income
$749,818
$757,365
$708,003
$2,963,357
$2,832,102
Cash Net Operating Income (Cash NOI)
Net Operating Income
$749,818
$757,365
$708,003
$2,963,357
$2,832,102
Straight-line rental revenue
(22,577)
(18,423)
(22,085)
(46,395)
(40,480)
Straight-line rental expense
51
1,683
(4,745)
4,061
(2,901)
Above- and below-market rent amortization
(269)
(742)
(856)
(3,555)
(4,404)
Cash Net Operating Income
$727,022
$739,883
$680,317
$2,917,467
$2,784,317
Constant Currency CFFO Reconciliation
Three Months Ended
Twelve Months Ended
(in thousands, except per share data)
31-Dec-24
31-Dec-23
31-Dec-24
31-Dec-23
Core FFO (1)
$586,816
$508,417
$2,215,194
$2,009,820
Core FFO impact of holding ’23 Exchange Rates Constant (2)
(318)
—
1,732
—
Constant Currency Core FFO
$586,498
$508,417
$2,216,926
$2,009,820
Weighted-average shares and units outstanding – diluted
339,982
312,356
329,899
305,138
Constant Currency CFFO Per Share
$1.73
$1.63
$6.72
$6.59
1)
As reconciled to net income above.
2)
Adjustment calculated by holding currency translation rates for 2024 constant with average currency translation rates that were applicable to the same periods in 2023.
12
This document contains forward-looking statements within the meaning of the federal securities laws, which are based on current expectations, forecasts and assumptions that involve risks and uncertainties that could cause actual outcomes and results to differ materially. Such forward-looking statements include statements relating to: our economic outlook, our expected investment and expansion activity, anticipated continued demand for our products and service, our liquidity, our joint ventures, supply and demand for data center and colocation space, our acquisition and disposition activity, pricing and net effective leasing economics, market dynamics and data center fundamentals, our strategic priorities, our product offerings, available inventory, rent from leases that have been signed but have not yet commenced and other contracted rent to be received in future periods, rental rates on future leases, lag between signing and commencement, cap rates and yields, investment activity, the company’s FFO, Core FFO, constant currency Core FFO, adjusted FFO, and net income, 2025 outlook and underlying assumptions, information related to trends, our strategy and plans, leasing expectations, weighted average lease terms, the exercise of lease extensions, lease expirations, debt maturities, annualized rent at expiration of leases, the effect new leases and increases in rental rates will have on our rental revenue, our credit ratings, construction and development activity and plans, projected construction costs, estimated yields on investment, expected occupancy, expected square footage and IT load capacity upon completion of development projects, backlog NOI, NAV components, and other forward-looking financial data. Such statements are based on management’s beliefs and assumptions made based on information currently available to management. Such statements are subject to risks, uncertainties and assumptions and are not guarantees of future performance and may be affected by known and unknown risks, trends, uncertainties, and factors that are beyond our control. Should one or more of these risks or uncertainties materialize, or should underlying assumptions prove incorrect, actual results may vary materially from those anticipated, estimated, or projected. Some of the risks and uncertainties that may cause our actual results, performance, or achievements to differ materially from those expressed or implied by forward-looking statements include, among others, the following:
reduced demand for data centers or decreases in information technology spending;decreased rental rates, increased operating costs or increased vacancy rates;increased competition or available supply of data center space;the suitability of our data centers and data center infrastructure, delays or disruptions in connectivity or availability of power, or failures or breaches of our physical and information security infrastructure or services;breaches of our obligations or restrictions under our contracts with our customers;our inability to successfully develop and lease new properties and development space, and delays or unexpected costs in development of properties;the impact of current global and local economic, credit and market conditions;global supply chain or procurement disruptions, or increased supply chain costs;the impact from periods of heightened inflation on our costs, such as operating and general and administrative expenses, interest expense and real estate acquisition and construction costs;the impact on our customers’ and our suppliers’ operations during an epidemic, pandemic, or other global events;our dependence upon significant customers, bankruptcy or insolvency of a major customer or a significant number of smaller customers, or defaults on or non-renewal of leases by customers;changes in political conditions, geopolitical turmoil, political instability, civil disturbances, restrictive governmental actions or nationalization in the countries in which we operate;our inability to retain data center space that we lease or sublease from third parties;information security and data privacy breaches;difficulties managing an international business and acquiring or operating properties in foreign jurisdictions and unfamiliar metropolitan areas;our failure to realize the intended benefits from, or disruptions to our plans and operations or unknown or contingent liabilities related to, our recent and future acquisitions;our failure to successfully integrate and operate acquired or developed properties or businesses;difficulties in identifying properties to acquire and completing acquisitions;risks related to joint venture investments, including as a result of our lack of control of such investments;risks associated with using debt to fund our business activities, including re-financing and interest rate risks, our failure to repay debt when due, adverse changes in our credit ratings or our breach of covenants or other terms contained in our loan facilities and agreements;our failure to obtain necessary debt and equity financing, and our dependence on external sources of capital;financial market fluctuations and changes in foreign currency exchange rates;adverse economic or real estate developments in our industry or the industry sectors that we sell to, including risks relating to decreasing real estate valuations and impairment charges and goodwill and other intangible asset impairment charges;our inability to manage our growth effectively;losses in excess of our insurance coverage;our inability to attract and retain talent;environmental liabilities, risks related to natural disasters and our inability to achieve our sustainability goals;the expected operating performance of anticipated near-term acquisitions and descriptions relating to these expectations;our inability to comply with rules and regulations applicable to our company;Digital Realty Trust, Inc.’s failure to maintain its status as a REIT for federal income tax purposes;Digital Realty Trust, L.P.’s failure to qualify as a partnership for federal income tax purposes;restrictions on our ability to engage in certain business activities;changes in local, state, federal and international laws, and regulations, including related to taxation, real estate, and zoning laws, and increases in real property tax rates; andthe impact of any financial, accounting, legal or regulatory issues or litigation that may affect us.
The risks included here are not exhaustive, and additional factors could adversely affect our business and financial performance. Several additional material risks are discussed in our annual report on Form 10‑K for the year ended December 31, 2023, and other filings with the U.S. Securities and Exchange Commission. Those risks continue to be relevant to our performance and financial condition. Moreover, we operate in a competitive and rapidly changing environment. New risk factors emerge from time to time and it is not possible for management to predict all such risk factors, nor can it assess the impact of all such risk factors on the business or the extent to which any factor, or combination of factors, may cause actual results to differ materially from those contained in any forward-looking statements. We expressly disclaim any responsibility to update forward-looking statements, whether as a result of new information, future events or otherwise. Digital Realty, Digital Realty Trust, the Digital Realty logo, Interxion, Turn-Key Flex, Powered Base Building, ServiceFabric, AnyScale Colo, Pervasive Data Center Architecture, PlatformDIGITAL, PDx, Data Gravity Index and Data Gravity Index DGx are registered trademarks and service marks of Digital Realty Trust, Inc. in the United States and/or other countries. All other names, trademarks and service marks are the property of their respective owners.
13
View original content to download multimedia:https://www.prnewswire.com/news-releases/digital-realty-reports-fourth-quarter-2024-results-302376450.html
SOURCE Digital Realty Trust

You may like
Technology
As ADA Anniversary Approaches, University of Phoenix Survey Highlights AI’s Potential to Advance Accessibility in Work and Learning
Published
29 minutes agoon
July 24, 2026By
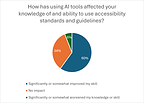
Survey conducted by The Harris Poll on behalf of University of Phoenix finds among those already using AI in the workplace, 60% say AI has improved their knowledge of and ability to use accessibility standards and guidelines.
PHOENIX, July 24, 2026 /PRNewswire/ — As artificial intelligence becomes part of how people work, learn and solve problems, a new University of Phoenix survey conducted by The Harris Poll finds that recent working learners see meaningful opportunities for AI to support accessibility. The survey was designed to understand the impact of AI in the workplace and learning environments on accessibility, defined as ensuring digital content, tools and resources, including AI tools and output, are usable by people with different abilities through inclusive design, use of assistive technology or conformance with accessibility standards, such as the Web Content Accessibility Guidelines (WCAG). The findings are being released ahead of the 36th anniversary of the Americans with Disabilities Act (ADA) on July 26.
The survey, conducted among 1,019 U.S. employed adults who completed a professionally presented training or school course in the past 12 months (“recent working learners”), found that, among workers already using AI in the workplace, 3 in 5 (60%) say AI has improved their knowledge of and ability to use accessibility standards and guidelines, including nearly 1 in 5 (19%) who report significant improvement.
While the findings point to optimism about AI’s accessibility potential, they also reveal an opportunity for clearer organizational guidance: 45% of respondents say accessibility is absent from, unclear in, or they are uncertain whether it is covered by their workplace AI policies.
“The reality is that accessibility benefits everyone,” shares Kelly Hermann, Vice President of Accessibility and Student Affairs at University of Phoenix. “If accessibility is built in from the beginning, organizations are more likely to create AI-enabled environments that are universally usable. Clearer content, better summaries, accurate captions, and multiple formats can help workers and learners with disabilities, but they also help busy adults, multilingual learners, mobile users, and anyone trying to absorb information quickly.”
Key findings from the survey include:
Workers see AI’s accessibility potential: 89% of recent working learners identify workflows that could benefit from AI and accessibility tools, especially creating accessible documents, presentations, websites or learning materials (38%), presenting information in different formats such as plain language, audio, summaries or translations (33%), and training employees or learners on accessibility practices (30%).AI may help build accessibility awareness: Among those already using AI in the workplace, 60% say AI has improved their knowledge of and ability to use accessibility standards and guidelines.Accessibility is not always clear in workplace AI policies: 45% of recent working learners say accessibility is absent from, unclear in, or they are uncertain whether it is covered by their workplace AI policies.AI tools may not yet fully support different access needs: Among those who use workplace AI tools, only about a quarter of survey respondents (27%) say AI tools available through their workplace or professional learning environment support people with disabilities very well.Human oversight remains important: 36% of recent working learners say human review for important decisions or high-impact work should be part of responsible AI use at work or school.Workers also recognize how AI and accessibility can have an impact on their own career journey: 90% of recent working learners identify AI and accessibility skills that would be valuable in their current or desired career field, including 45% who see value in understanding when AI-generated content needs human review.
Why accessibility is essential to responsible AI adoption
As AI tools are used to draft documents, summarize information, generate captions and transcripts, create image descriptions, support learning and assist with workplace tasks, accessibility becomes central to responsible use. Poorly implemented AI can also create or amplify barriers, including inaccessible content, inaccurate summaries, biased outputs and tools that do not work effectively with assistive technologies.
“Responsible AI is not only about productivity,” Hermann said. “It is about whether the technology works for the people who need to use it. AI can help create more accessible materials and more flexible ways to engage with information, but it still requires clear policies, practical training and human judgment to make sure the outputs are accurate, applicable and usable.”
What the findings mean for employers and educators
The survey suggests that organizations have an opportunity to align AI adoption with supportive design, accessibility practices and workforce training. Employers and educators can take immediate steps by:
Naming accessibility directly in AI policies and guidance.Choosing AI tools with accessibility and assistive technology compatibility in mind.Training workers and learners to create, check and improve accessible AI-generated content.Making support pathways clear for people who experience barriers using AI tools.Keeping human review in place for important decisions, high-impact work and accessibility-sensitive outputs.
The survey also found workers want practical AI training. The most helpful resources identified by recent working learners include real-world examples from their field or industry (36%), hands-on practice using realistic workplace scenarios (34%) and step-by-step demonstrations of common tasks (33%).
Accessibility insights from University of Phoenix
Hermann shared the survey findings ahead of the ADA anniversary in recent media interviews. Hermann oversees the University’s accessibility initiative, including evaluation and remediation of curricular resources, the Center for Access, Resources, Engagement and Support Services (CARES), and the Office of Collaborative Learning and Educational Engagement. Her work focuses on fostering accessible and welcoming educational environments for students, faculty and staff.
Hermann’s office at University of Phoenix also convenes accessibility conversations through initiatives such as Access Amplified™, a free, annual virtual event focused on advancing digital accessibility in web development. The event brings together engineers, developers, designers, content authors and digital strategists for practical strategies and human-centered conversations that address the gap between coding practices and how users with assistive technology experience the web.
About the survey
The survey was conducted online within the United States by The Harris Poll on behalf of University of Phoenix from June 22–29, 2026, among 1,019 employed adults ages 18 and older who have taken a professionally presented training or a school course in the past 12 months, referred to as “recent working learners.” Data were weighted where necessary by age, gender, race/ethnicity, region, education, employment, marital status, household size, household income and smoking status to bring them in line with their actual proportions in the population.
Respondents for this survey were selected from among those who have agreed to participate in surveys. The sampling precision of Harris online polls is measured by using a Bayesian credible interval. For this study, the sample data is accurate to within +/- 3.8 percentage points using a 95% confidence level. This credible interval will be wider among subsets of the surveyed population of interest.
Review the complete survey at phoenix.edu/aiaccessibility.
About University of Phoenix
University of Phoenix is Built for Real Life. 50 Years Strong. The University innovates to help working adults enhance their careers and develop skills in a rapidly changing world through flexible online learning, relevant courses, academic AI pillars, and skills-mapped curriculum for associate, bachelor’s and master’s degree programs. Active students and alumni have access to Career Services for Life® resources including career guidance and tools. For more information, visit phoenix.edu.
View original content to download multimedia:https://www.prnewswire.com/news-releases/as-ada-anniversary-approaches-university-of-phoenix-survey-highlights-ais-potential-to-advance-accessibility-in-work-and-learning-302834448.html
SOURCE University of Phoenix
Technology
Mastech Digital to Announce Second Quarter 2026 Financial Results; Participate in Upcoming Investor Conference
Published
1 hour agoon
July 24, 2026By
PITTSBURGH, July 24, 2026 /PRNewswire/ — Mastech Digital, Inc. (NYSE American: MHH) (“Mastech Digital”), a leading provider of Digital Transformation IT Services, today announced the date for the release of its financial results for the second quarter ended June 30, 2026, and its participation in an upcoming investor conference.
Second Quarter 2026 Earnings:
Mastech Digital will report its financial results for the second quarter 2026 before the market opens on Thursday, August 6, 2026. Management will host a live conference call and webcast at 9:00 a.m. Eastern Time on that day to discuss the Company’s financial performance and operating results. The conference call will be hosted by Nirav Patel, President and CEO, and Kannan Sugantharaman, Chief Financial and Operations Officer.
Those wishing to participate via webcast should access the call through Mastech Digital’s Investor Relations website at https://investors.mastechdigital.com. Those wishing to participate via telephone may dial in at 1-800-715-9871 (USA) or 1-646-307-1963 (International) with the passcode 7506988. The replay will be available via webcast through Mastech Digital’s Investor Relations website.
Upcoming Investor Conference:
Mr. Sugantharaman will host a fireside chat at the Sidoti Micro-Cap Investor Conference on Wednesday, August 19, 2026, at 9:15 a.m. Eastern Time.
Mastech Digital management is scheduled to host virtual one-on-one and small group meetings with investors during the conference on August 19-20, 2026. Investors interested in arranging a meeting should contact their Sidoti representative or reach out to the Mastech Digital investor relations team at investors@mastechdigital.com.
About Mastech Digital, Inc.
Mastech Digital (NYSE American: MHH) is a leading provider of Digital Transformation IT Services. The Company offers Data Management, Analytics & AI Solutions, and IT Staffing Services with a digital-first approach. A minority-owned enterprise, Mastech Digital is headquartered in Pittsburgh, PA, with offices across the U.S., Canada, Europe, and India. Visit us at www.mastechdigital.com.
Investor Relations Contact:
investors@mastechdigital.com
View original content to download multimedia:https://www.prnewswire.com/news-releases/mastech-digital-to-announce-second-quarter-2026-financial-results-participate-in-upcoming-investor-conference-302834421.html
SOURCE Mastech Digital, Inc.
Technology
SOLAI Limited Announces Extraordinary General Meeting
Published
1 hour agoon
July 24, 2026By
AKRON, Ohio, July 24, 2026 /PRNewswire/ — SOLAI Limited (NYSE: SLAI) (“SOLAI” or the “Company”) (previously known as “BIT Mining Limited”), a technology-driven personal AI and digital infrastructure provider, today announced that it will hold its extraordinary general meeting of shareholders at 428 South Seiberling Street, Akron, Ohio, US on August 14, 2026 at 10:00 a.m., New York time.
Holders of record of ordinary shares and preference shares of the Company at the close of business on July 20, 2026, New York time (the “Record Date”) are entitled to receive notice of, and to attend and vote at, the extraordinary general meeting or any adjournment thereof. Holders of the Company’s American Depositary Shares (“ADSs”) who wish to exercise their voting rights for the underlying ordinary shares must act through the depositary of the Company’s ADS program, Deutsche Bank Trust Company Americas.
The notice of the extraordinary general meeting, which sets forth the resolutions to be submitted to shareholder approval at the extraordinary general meeting is available on the Investor Relations section of the Company’s website at https://ir.solai.com.
About SOLAI Limited
SOLAI Limited (previously known as “BIT Mining Limited”) (NYSE: SLAI) (previously traded under “BTCM”) is a technology-driven personal AI and digital infrastructure provider. Building upon its historical legacy in digital asset mining and blockchain network operations, the Company is leveraging extensive experience in large-scale hardware deployment, data center operations, and high-performance computing to build the foundational infrastructure for personal AI computing and digital asset ecosystems globally.
For more information:
SOLAI Limited
ir@solai.com
ir.solai.com
www.solai.com
Christensen Advisory
Jason Ng
Tel: +852-2117-0861
Email: solai@christensencomms.com
View original content:https://www.prnewswire.com/news-releases/solai-limited-announces-extraordinary-general-meeting-302834034.html
SOURCE SOLAI Limited


As ADA Anniversary Approaches, University of Phoenix Survey Highlights AI’s Potential to Advance Accessibility in Work and Learning

EU authorities include HTX exchange in Russian sanctions
Mastech Digital to Announce Second Quarter 2026 Financial Results; Participate in Upcoming Investor Conference
Send Rakhi to UK swiftly with UK Gifts Portal

Whiteboard Series with NEAR | Ep: 45 Joel Thorstensson from ceramic.network

New Gooseneck Omni Antennas Offer Enhanced Signals in a Durable Package

Why You Should Build on #NEAR – Co-founder Illia Polosukhin at CV Labs
Whiteboard Series with NEAR | Ep: 45 Joel Thorstensson from ceramic.network

NEAR End of Year Town Hall 2021: The Open Web World, MetaBUILD 2 Hackathon and 2021 recap
Trending
-

 Coin Market5 days ago
Will the US get CLARITY this week? Bitcoin’s new $80K target: Hodler’s Digest, July 19
-

 Technology5 days ago
“Every Day CO₂ Challenge”: More Than a Game, A New Way of Learning
-

 Technology5 days ago
Trakka Systems to Demonstrate Advanced ISR Capabilities at Farnborough International Airshow 2026
-

 Technology5 days ago
Powering ASEAN’s Manufacturing Transformation: IME 2026 Connects Technology, Industry and Opportunity
-

 Technology4 days ago
Signeasy expands beyond eSignatures with Intelligent Contract Management for growing businesses
-
 Technology5 days ago
DBS named Asia’s Best Digital Bank by Euromoney, recognised for its AI leadership and responsible innovation
-
 Technology5 days ago
CNPC launches China’s first full-chain green, low-carbon ethylene project
-

 Technology5 days ago
BOC Group Releases ADONIS 19.0 LTS to Bring Smarter Support into Everyday BPM Work