
Technology
Baidu Announces Fourth Quarter and Fiscal Year 2024 Results
Published
1 year agoon
By
BEIJING, Feb. 18, 2025 /PRNewswire/ — Baidu, Inc. (NASDAQ: BIDU and HKEX: 9888 (HKD Counter) and 89888 (RMB Counter)) (“Baidu” or the “Company”), a leading AI company with a strong Internet foundation, today announced its unaudited financial results for the quarter and fiscal year ended December 31, 2024.
“2024 marked a pivotal year in our ongoing transformation from an internet-centric to an AI-first business. AI Cloud gained momentum, fueled by broad market recognition of our full stack AI capabilities. In Mobile Ecosystem, we have been steadfast in advancing the AI transformation, making search more AI-native to deliver a better user experience. Apollo Go, after years of investment, validated its business model, paving the way for global expansion and scalable, asset-light strategies,” said Robin Li, Co-founder and CEO of Baidu. “With our strategic foresight increasingly validated, we expect our AI investments to deliver more significant results in 2025.”
“Our AI Cloud business demonstrated robust momentum with fourth-quarter revenue growth accelerating to 26% year over year, offsetting the softness in online marketing business,” said Junjie He, Interim CFO of Baidu. “While navigating near-term pressures, we are confident that our strategic AI investments will drive meaningful progress and foster long-term success.”
Fourth Quarter and Fiscal Year 2024 Financial Highlights[1]
Baidu, Inc.
(In millions except per
Q4
Q3
Q4
FY
FY
ADS, unaudited)
2023
2024
2024
YOY
2023
2024
YOY
RMB
RMB
RMB
US$
RMB
RMB
US$
Total revenues
34,951
33,557
34,124
4,675
(2 %)
134,598
133,125
18,238
(1 %)
Operating income
5,392
5,925
3,917
537
(27 %)
21,856
21,270
2,914
(3 %)
Operating income
(non-GAAP) [2]
7,075
7,014
5,047
691
(29 %)
28,433
26,234
3,594
(8 %)
Net income to Baidu
2,599
7,632
5,192
711
100 %
20,315
23,760
3,255
17 %
Net income to Baidu
(non-GAAP) [2]
7,755
5,886
6,709
919
(13 %)
28,747
27,002
3,699
(6 %)
Diluted earnings per
ADS
6.77
21.60
14.26
1.95
111 %
55.08
65.91
9.03
20 %
Diluted earnings per
ADS (non-GAAP) [2]
21.86
16.60
19.18
2.63
(12 %)
80.85
76.85
10.53
(5 %)
Adjusted EBITDA [2]
9,057
8,733
6,954
953
(23 %)
35,823
33,078
4,532
(8 %)
Adjusted EBITDA
margin
26 %
26 %
20 %
20 %
27 %
25 %
25 %
Baidu Core
Q4
Q3
Q4
FY
FY
(In millions, unaudited)
2023
2024
2024
YOY
2023
2024
YOY
RMB
RMB
RMB
US$
RMB
RMB
US$
Total revenues
27,488
26,524
27,698
3,795
1 %
103,465
104,712
14,345
1 %
Operating income
4,668
5,694
3,638
498
(22 %)
18,825
19,478
2,668
3 %
Operating income
(non-GAAP) [2]
6,197
6,652
4,647
637
(25 %)
24,748
23,890
3,273
(3 %)
Net income to Baidu
Core
2,440
7,536
5,283
724
117 %
19,401
23,431
3,210
21 %
Net income to Baidu
Core (non-GAAP) [2]
7,500
5,676
6,741
924
(10 %)
27,418
26,335
3,608
(4 %)
Adjusted EBITDA [2]
8,118
8,336
6,516
893
(20 %)
31,863
30,587
4,190
(4 %)
Adjusted EBITDA
margin
30 %
31 %
24 %
24 %
31 %
29 %
29 %
[1] Unless otherwise noted, RMB to USD was converted at an exchange rate of RMB 7.2993 as of December 31, 2024,
as set forth in the H.10 statistical release of the Board of Governors of the Federal Reserve System. Translations are
provided solely for the convenience of the reader.
[2] Non-GAAP measures are defined in the Non-GAAP Financial Measures section (see also “Reconciliations of
Non-GAAP Financial Measures to the Nearest Comparable GAAP Measures” for more details).
Operational Highlights
Corporate
Baidu returned US$356 million to shareholders since Q4 2024, bringing the cumulative repurchase to over US$1 billion since 2024 and to US$1.7 billion under the 2023 share repurchase program.Baidu earned a position in the global edition of the S&P Global Sustainability Yearbook for the first time, demonstrating its further advancement in ESG performance. The selection stems from a comprehensive evaluation of 7,690 companies globally as part of the S&P Global 2024 Corporate Sustainability Assessment, underscoring Baidu’s sustainability practices.Forbes China placed Baidu on its 2024 China ESG 50 list.
AI Cloud
ERNIE handled approximately 1.65 billion API calls daily in December 2024, with external API calls increasing by 178% quarter over quarter, highlighting particularly strong momentum.The MAU of Baidu Wenku’s AI-enabled features reached 94 million in December 2024, with a 216% year over year and an 83% quarter over quarter increase.
Intelligent Driving
Apollo Go, Baidu’s autonomous ride-hailing service, provided over 1.1 million rides in the fourth quarter of 2024, up 36% year over year.In January 2025, accumulated rides provided to the public by Apollo Go surpassed 9 million.In November 2024, Apollo Go was granted permits to conduct autonomous driving testing on public roads in Hong Kong, making Apollo Go the first and only of its kind to receive robotaxi testing authorization in the region. This marks Apollo Go’s first entry into a right-hand drive, left-hand traffic market.Apollo Go has commenced 100% fully driverless operations across China since February 2025.
Mobile Ecosystem
In December 2024, Baidu App’s MAUs reached 679 million, up 2% year over year.Managed Page accounted for 48% of Baidu Core’s online marketing revenue in the fourth quarter of 2024.
Fourth Quarter 2024 Financial Results
Total revenues were RMB34.1 billion ($4.68 billion), decreasing 2% year over year.
Revenue from Baidu Core was RMB27.7 billion ($3.80 billion), increasing 1% year over year; online marketing revenue was RMB17.9 billion ($2.46 billion), decreasing 7% year over year, and non-online marketing revenue was RMB9.8 billion ($1.34 billion), up 18% year over year, mainly driven by AI Cloud business.Revenue from iQIYI was RMB6.6 billion ($906 million), decreasing 14% year over year.
Cost of revenues was RMB18.0 billion ($2.47 billion), increasing 3% year over year, primarily due to an increase in traffic acquisition costs, costs related to AI Cloud business and a one-time write-down of inventories, partially offset by a decrease in personnel-related expenses and content costs.
Selling, general and administrative expenses were RMB6.7 billion ($915 million), increasing 14% year over year, primarily due to an increase in expected credit losses, and channel spending and promotional marketing expenses, partially offset by a decrease in personnel-related expenses. RMB561 million of the increase in expected credit losses was pertaining to a one-time accrual.
Research and development expenses were RMB5.5 billion ($756 million), decreasing 12% year over year, primarily due to a decrease in personnel-related expenses, partially offset by an increase in server depreciation expenses and server custody fees which support Gen-AI research and development inputs.
Operating income was RMB3.9 billion ($537 million) in Q4, compared to RMB5.4 billion for the same period last year. Baidu Core operating income was RMB3.6 billion ($498 million), and Baidu Core operating margin was 13% in Q4, compared to RMB4.7 billion and 17% for the same period last year. The decrease was due to one-time losses of RMB1.0 billion including accrual of expected credit losses, write-down of inventories and others. Non-GAAP operating income was RMB5.0 billion ($691 million). Non-GAAP Baidu Core operating income was RMB4.6 billion ($637 million), and non-GAAP Baidu Core operating margin was 17%.
Total other income, net was RMB2.7 billion ($364 million), compared to total other loss, net of RMB2.5 billion for the same period last year, mainly due to an increase in net foreign exchange gain arising from exchange rate fluctuation between Renminbi and U.S. dollar, and a decrease in pickup of losses from an equity method investment, which modified certain terms of its preferred shares and resulted in significant loss pickup in 2023.
Income tax expense was RMB1.6 billion ($222 million), compared to income tax benefit of RMB96 million for the same period last year.
Net income attributable to Baidu was RMB5.2 billion ($711 million), and diluted earnings per ADS was RMB14.26 ($1.95). Net income attributable to Baidu Core was RMB5.3 billion ($724 million), and net margin for Baidu Core was 19%. Non-GAAP net income attributable to Baidu was RMB6.7 billion ($919 million). Non-GAAP diluted earnings per ADS was RMB19.18 ($2.63). Non-GAAP net income attributable to Baidu Core was RMB6.7 billion ($924 million), and non-GAAP net margin for Baidu Core was 24%.
Adjusted EBITDA was RMB7.0 billion ($953 million) and adjusted EBITDA margin was 20%. Adjusted EBITDA for Baidu Core was RMB6.5 billion ($893 million) and adjusted EBITDA margin for Baidu Core was 24%.
As of December 31, 2024, cash, cash equivalents, restricted cash and short-term investments were RMB139.1 billion ($19.06 billion), and cash, cash equivalents, restricted cash and short-term investments excluding iQIYI were RMB134.7 billion ($18.45 billion). Free cash flow was RMB23 million ($3 million), and free cash flow excluding iQIYI was negative RMB476 million (negative $65 million).
Fiscal Year 2024 Results
Total revenues were RMB133.1 billion ($18.24 billion), decreasing 1% year over year.
Revenue from Baidu Core was RMB104.7 billion ($14.35 billion), increasing 1% year over year; online marketing revenue was RMB73.0 billion ($10.00 billion), decreasing 3% year over year, and non-online marketing revenue was RMB31.7 billion ($4.35 billion), up 12% year over year, mainly driven by AI Cloud business.Revenue from iQIYI was RMB29.2 billion ($4.00 billion), decreasing 8% year over year.
Cost of revenues was RMB66.1 billion ($9.06 billion), increasing 2% year over year, primarily due to an increase in traffic acquisition costs, bandwidth costs and server custody fees, partially offset by a decrease in personnel-related expenses and content costs.
Selling, general and administrative expenses were RMB23.6 billion ($3.24 billion), which remained flat compared to the same period last year.
Research and development expenses were RMB22.1 billion ($3.03 billion), decreasing 9% year over year, primarily due to a decrease in personnel-related expenses.
Operating income was RMB21.3 billion ($2.91 billion). Baidu Core operating income was RMB19.5 billion ($2.67 billion), and Baidu Core operating margin was 19%. Non-GAAP operating income was RMB26.2 billion ($3.59 billion). Non-GAAP Baidu Core operating income was RMB23.9 billion ($3.27 billion), and non-GAAP Baidu Core operating margin was 23%.
Total other income, net was RMB7.4 billion ($1.01 billion), increasing 120% year over year, primarily due to a decrease in pickup of losses from an equity method investment, which modified certain terms of its preferred shares and resulted in significant loss pickup in 2023.
Income tax expense was RMB4.4 billion ($609 million), compared to RMB3.6 billion in the same period last year.
Net income attributable to Baidu was RMB23.8 billion ($3.26 billion), and diluted earnings per ADS was RMB65.91 ($9.03). Net income attributable to Baidu Core was RMB23.4 billion ($3.21 billion), and net margin for Baidu Core was 22%. Non-GAAP net income attributable to Baidu was RMB27.0 billion ($3.70 billion). Non-GAAP diluted earnings per ADS was RMB76.85 ($10.53). Non-GAAP net income attributable to Baidu Core was RMB26.3 billion ($3.61 billion), and non-GAAP net margin for Baidu Core was 25%.
Adjusted EBITDA was RMB33.1 billion ($4.53 billion) and adjusted EBITDA margin was 25%. Adjusted EBITDA for Baidu Core was RMB30.6 billion ($4.19 billion) and adjusted EBITDA margin for Baidu Core was 29%.
Free cash flow was RMB13.1 billion ($1.80 billion), and free cash flow excluding iQIYI was RMB11.1 billion ($1.52 billion).
Conference Call Information
Baidu’s management will hold an earnings conference call at 7.30 AM on February 18, 2025, U.S. Eastern Time (8.30 PM on February 18, 2025, Beijing Time).
Please register in advance of the conference call using the link provided below. It will automatically direct you to the registration page of “Baidu Inc. Q4 2024 Earnings Conference Call”. Please follow the steps to enter your registration details, then click “Register”. Upon registering, you will then be provided with the dial-in number, the passcode, and your unique access PIN. This information will also be emailed to you as a calendar invite.
For pre-registration, please click:
https://s1.c-conf.com/diamondpass/10044727-f3pyuq.html
In the 10 minutes prior to the call start time, you may use the conference access information (including dial-in number(s), the passcode and unique access PIN) provided in the calendar invite that you have received following your pre-registration.
Additionally, a live and archived webcast of this conference call will be available at https://ir.baidu.com.
About Baidu
Founded in 2000, Baidu’s mission is to make the complicated world simpler through technology. Baidu is a leading AI company with strong Internet foundation, trading on NASDAQ under “BIDU” and HKEX under “9888”. One Baidu ADS represents eight Class A ordinary shares.
Safe Harbor Statement
This announcement contains forward-looking statements. These statements are made under the “safe harbor” provisions of the U.S. Private Securities Litigation Reform Act of 1995. These forward-looking statements can be identified by terminology such as “will,” “expects,” “anticipates,” “future,” “intends,” “plans,” “believes,” “estimates,” “confident” and similar statements. Among other things, Baidu’s and other parties’ strategic and operational plans, contain forward-looking statements. Baidu may also make written or oral forward-looking statements in its periodic reports to the U.S. Securities and Exchange Commission, in announcements made on the website of The Stock Exchange of Hong Kong Limited (the “Hong Kong Stock Exchange”), in its annual report to shareholders, in press releases and other written materials and in oral statements made by its officers, directors or employees to third parties. Statements that are not historical facts, including but not limited to statements about Baidu’s beliefs and expectations, are forward-looking statements. Forward-looking statements involve inherent risks and uncertainties. A number of factors could cause actual results to differ materially from those contained in any forward-looking statement, including but not limited to the following: Baidu’s growth strategies; its future business development, including development of new products and services; its ability to attract and retain users and customers; competition in the Chinese Internet search and newsfeed market; competition for online marketing customers; changes in the Company’s revenues and certain cost or expense items as a percentage of its revenues; the outcome of ongoing, or any future, litigation or arbitration, including those relating to intellectual property rights; the expected growth of the Chinese-language Internet search and newsfeed market and the number of Internet and broadband users in China; Chinese governmental policies relating to the Internet and Internet search providers, and general economic conditions in China and elsewhere. Further information regarding these and other risks is included in the Company’s annual report on Form 20-F and other documents filed with the Securities and Exchange Commission, and announcements on the website of the Hong Kong Stock Exchange. Baidu does not undertake any obligation to update any forward-looking statement, except as required under applicable law. All information provided in this press release and in the attachments is as of the date of the press release, and Baidu undertakes no duty to update such information, except as required under applicable law.
Non-GAAP Financial Measures
To supplement Baidu’s consolidated financial results presented in accordance with GAAP, Baidu uses the following non-GAAP financial measures: non-GAAP operating income, non-GAAP operating margin, non-GAAP net income (loss) attributable to Baidu, non-GAAP net margin, non-GAAP diluted earnings per ADS, adjusted EBITDA, adjusted EBITDA margin and free cash flow. The presentation of these non-GAAP financial measures is not intended to be considered in isolation or as a substitute for the financial information prepared and presented in accordance with GAAP.
Baidu believes that these non-GAAP financial measures provide meaningful supplemental information regarding its performance and liquidity by excluding certain items that may not be indicative of its recurring core business operating results, such as operating performance excluding non-cash charges or non-operating in nature. The Company believes that both management and investors benefit from referring to these non-GAAP financial measures in assessing its performance and when planning and forecasting future periods. These non-GAAP financial measures also facilitate management’s internal comparisons to Baidu’s historical performance and liquidity. The Company believes these non-GAAP financial measures are useful to investors in allowing for greater transparency with respect to supplemental information used by management in its financial and operational decision making. A limitation of using these non-GAAP financial measures is that these non-GAAP measures exclude certain items that have been and will continue to be for the foreseeable future a significant component in the Company’s results of operations. These non-GAAP financial measures presented here may not be comparable to similarly titled measures presented by other companies. Other companies may calculate similarly titled measures differently, limiting their usefulness as comparative measures to the Company’s data.
Non-GAAP operating income represents operating income excluding share-based compensation expenses, and amortization and impairment of intangible assets resulting from business combinations.
Non-GAAP net income attributable to Baidu represents net income attributable to Baidu excluding share-based compensation expenses, amortization and impairment of intangible assets resulting from business combinations, disposal gain or loss, impairment of long-term investments, and fair value gain or loss of long-term investments, adjusted for related income tax effects. Baidu’s share of equity method investments for these non-GAAP reconciling items, amortization and impairment of intangible assets not on the investees’ books, accretion of their redeemable non-controlling interests, and the gain or loss associated with the issuance of shares by the investees at a price higher or lower than the carrying value per share, adjusted for related income tax effects, are also excluded.
Non-GAAP diluted earnings per ADS represents diluted earnings per ADS calculated by dividing non-GAAP net income attributable to Baidu, by the weighted average number of ordinary shares expressed in ADS. Adjusted EBITDA represents operating income excluding depreciation, amortization and impairment of intangible assets resulting from business combinations, and share-based compensation expenses.
For more information on non-GAAP financial measures, please see the tables captioned “Reconciliations of non-GAAP financial measures to the nearest comparable GAAP measure.”
Baidu, Inc.
Condensed Consolidated Statements of Income
(In millions except for per share (or ADS) information, unaudited)
Three Months Ended
Twelve Months Ended
December 31,
September 30,
December 31,
December 31,
December 31,
December 31,
December 31,
2023
2024
2024
2024
2023
2024
2024
RMB
RMB
RMB
US$(2)
RMB
RMB
US$(2)
Revenues:
Online marketing services
20,804
20,108
19,340
2,650
81,203
78,563
10,763
Others
14,147
13,449
14,784
2,025
53,395
54,562
7,475
Total revenues
34,951
33,557
34,124
4,675
134,598
133,125
18,238
Costs and expenses:
Cost of revenues(1)
17,418
16,399
18,014
2,467
65,031
66,102
9,056
Selling, general and administrative(1)
5,854
5,867
6,678
915
23,519
23,620
3,236
Research and development(1)
6,287
5,366
5,515
756
24,192
22,133
3,032
Total costs and expenses
29,559
27,632
30,207
4,138
112,742
111,855
15,324
Operating income
5,392
5,925
3,917
537
21,856
21,270
2,914
Other (loss) income:
Interest income
2,064
1,877
2,001
274
8,009
7,962
1,091
Interest expense
(774)
(673)
(643)
(88)
(3,248)
(2,824)
(387)
Foreign exchange (loss) gain, net
(449)
(1,096)
1,678
230
595
1,076
147
Share of (losses) earnings from equity method investments
(2,970)
32
(399)
(55)
(3,799)
(691)
(95)
Others, net
(398)
2,535
23
3
1,785
1,829
251
Total other (loss) income, net
(2,527)
2,675
2,660
364
3,342
7,352
1,007
Income before income taxes
2,865
8,600
6,577
901
25,198
28,622
3,921
Income tax (benefit) expense
(96)
814
1,619
222
3,649
4,447
609
Net income
2,961
7,786
4,958
679
21,549
24,175
3,312
Net income (loss) attributable to noncontrolling interests
362
154
(234)
(32)
1,234
415
57
Net income attributable to Baidu
2,599
7,632
5,192
711
20,315
23,760
3,255
Earnings per ADS (1 ADS representing 8 Class A ordinary shares):
-Basic
6.85
21.93
14.41
1.97
55.83
66.40
9.10
-Diluted
6.77
21.60
14.26
1.95
55.08
65.91
9.03
Earnings per share for Class A and Class B ordinary shares:
-Basic
0.86
2.74
1.80
0.25
6.98
8.31
1.14
-Diluted
0.85
2.70
1.78
0.24
6.89
8.24
1.13
Weighted average number of Class A and Class B ordinary shares outstanding (in millions):
-Basic
2,812
2,785
2,775
2,775
2,807
2,790
2,790
-Diluted
2,830
2,789
2,783
2,783
2,837
2,798
2,798
(1) Includes share-based compensation expenses as follows:
Cost of revenues
159
104
103
14
590
461
63
Selling, general and administrative
411
328
297
41
1,678
1,427
195
Research and development
1,068
612
685
93
4,077
2,896
397
Total share-based compensation expenses
1,638
1,044
1,085
148
6,345
4,784
655
(2) All translations from RMB to U.S. dollars are made at a rate of RMB7.2993 to US$1.00, the exchange rate in effect as of December 31, 2024 as set forth in the H.10 statistical release of The Board of Governors of the Federal Reserve System.
Baidu, Inc.
Condensed Consolidated Balance Sheets
(In millions, unaudited)
December 31,
December 31,
December 31,
2023
2024
2024
RMB
RMB
US$
ASSETS
Current assets:
Cash and cash equivalents
25,231
24,832
3,402
Restricted cash
11,503
11,697
1,602
Short-term investments, net
168,670
102,608
14,057
Accounts receivable, net
10,848
10,104
1,384
Amounts due from related parties
1,424
790
108
Other current assets, net
12,579
18,818
2,580
Total current assets
230,255
168,849
23,133
Non-current assets:
Fixed assets, net
27,960
30,102
4,124
Licensed copyrights, net
6,967
6,930
949
Produced content, net
13,377
14,695
2,013
Intangible assets, net
881
772
106
Goodwill
22,586
22,586
3,094
Long-term investments, net
47,957
41,721
5,716
Long-term time deposits and held-to-maturity investments
24,666
98,535
13,499
Amounts due from related parties
195
137
19
Deferred tax assets, net
2,100
2,193
300
Operating lease right-of-use assets
10,851
10,898
1,493
Prepayments and receivables related to the proposed acquisition of YY Live, net
13,198
13,547
1,856
Other non-current assets
5,766
16,815
2,304
Total non-current assets
176,504
258,931
35,473
Total assets
406,759
427,780
58,606
LIABILITIES, REDEEMABLE NONCONTROLLING INTERESTS AND EQUITY
Current liabilities:
Short-term loans
10,257
10,669
1,462
Accounts payable and accrued liabilities
37,717
41,443
5,677
Customer deposits and deferred revenue
14,627
14,624
2,003
Deferred income
306
684
94
Long-term loans, current portion
2
168
23
Convertible senior notes, current portion
2,802
242
33
Notes payable, current portion
6,029
8,026
1,100
Amounts due to related parties
1,603
1,794
246
Operating lease liabilities
3,108
3,303
453
Total current liabilities
76,451
80,953
11,091
Non-current liabilities:
Deferred income
200
231
32
Deferred revenue
481
585
80
Amounts due to related parties
77
56
8
Long-term loans
14,223
15,596
2,137
Notes payable
34,990
27,996
3,835
Convertible senior notes
8,144
8,351
1,144
Deferred tax liabilities
2,725
3,870
530
Operating lease liabilities
5,040
4,973
681
Other non-current liabilities
1,820
1,557
213
Total non-current liabilities
67,700
63,215
8,660
Total liabilities
144,151
144,168
19,751
Redeemable noncontrolling interests
9,465
9,870
1,352
Equity
Total Baidu shareholders’ equity
243,626
263,620
36,116
Noncontrolling interests
9,517
10,122
1,387
Total equity
253,143
273,742
37,503
Total liabilities, redeemable noncontrolling interests, and equity
406,759
427,780
58,606
Baidu, Inc.
Selected Information
(In millions, unaudited)
Three months ended
December 31, 2023 (RMB)
Three months ended
September 30, 2024 (RMB)
Three months ended
December 31, 2024 (RMB)
Three months ended
December 31, 2024 (US$)
Baidu
Core
iQIYI
Elim &
adj(2)
Baidu,
Inc.
Baidu
Core
iQIYI
Elim &
adj(2)
Baidu,
Inc.
Baidu
Core
iQIYI
Elim &
adj(2)
Baidu,
Inc.
Baidu
Core
iQIYI
Elim &
adj(2)
Baidu,
Inc.
Total revenues
27,488
7,707
(244)
34,951
26,524
7,246
(213)
33,557
27,698
6,613
(187)
34,124
3,795
906
(26)
4,675
YOY
1 %
(14 %)
(2 %)
QOQ
4 %
(9 %)
2 %
Costs and expenses:
Cost of revenues (1)
12,050
5,533
(165)
17,418
10,923
5,650
(174)
16,399
13,180
4,995
(161)
18,014
1,806
684
(23)
2,467
Selling, general and administrative (1)
4,936
948
(30)
5,854
4,990
908
(31)
5,867
5,816
882
(20)
6,678
797
121
(3)
915
Research and development (1)
5,834
453
–
6,287
4,917
449
–
5,366
5,064
451
–
5,515
694
62
–
756
Total costs and expenses
22,820
6,934
(195)
29,559
20,830
7,007
(205)
27,632
24,060
6,328
(181)
30,207
3,297
867
(26)
4,138
YOY
Cost of revenues
9 %
(10 %)
3 %
Selling, general and administrative
18 %
(7 %)
14 %
Research and development
(13 %)
(0 %)
(12 %)
Costs and expenses
5 %
(9 %)
2 %
Operating income (loss)
4,668
773
(49)
5,392
5,694
239
(8)
5,925
3,638
285
(6)
3,917
498
39
–
537
YOY
(22 %)
(63 %)
(27 %)
QOQ
(36 %)
19 %
(34 %)
Operating margin
17 %
10 %
15 %
21 %
3 %
18 %
13 %
4 %
11 %
Add: total other (loss) income, net
(2,267)
(260)
–
(2,527)
2,667
8
–
2,675
3,125
(465)
–
2,660
428
(64)
–
364
Less: income tax (benefit) expense
(134)
38
–
(96)
803
11
–
814
1,612
7
–
1,619
221
1
–
222
Less: net income (loss) attributable to NCI
95
9
258(3)
362
22
7
125(3)
154
(132)
2
(104)(3)
(234)
(19)
–
(13)(3)
(32)
Net income (loss) attributable to Baidu
2,440
466
(307)
2,599
7,536
229
(133)
7,632
5,283
(189)
98
5,192
724
(26)
13
711
YOY
117 %
–
100 %
QOQ
(30 %)
–
(32 %)
Net margin
9 %
6 %
7 %
28 %
3 %
23 %
19 %
(3 %)
15 %
Non-GAAP financial measures:
Operating income (non-GAAP)
6,197
927
7,075
6,652
370
7,014
4,647
406
5,047
637
54
691
YOY
(25 %)
(56 %)
(29 %)
QOQ
(30 %)
10 %
(28 %)
Operating margin (non-GAAP)
23 %
12 %
20 %
25 %
5 %
21 %
17 %
6 %
15 %
Net income (loss) attributable to Baidu (non-GAAP)
7,500
681
7,755
5,676
480
5,886
6,741
(59)
6,709
924
(9)
919
YOY
(10 %)
–
(13 %)
QOQ
19 %
–
14 %
Net margin (non-GAAP)
27 %
9 %
22 %
21 %
7 %
18 %
24 %
(1 %)
20 %
Adjusted EBITDA
8,118
988
9,057
8,336
405
8,733
6,516
444
6,954
893
60
953
YOY
(20 %)
(55 %)
(23 %)
QOQ
(22 %)
10 %
(20 %)
Adjusted EBITDA margin
30 %
13 %
26 %
31 %
6 %
26 %
24 %
7 %
20 %
(1) Includes share-based compensation as follows:
Cost of revenues
125
34
159
73
31
104
74
29
103
10
4
14
Selling, general and administrative
340
71
411
268
60
328
240
57
297
33
8
41
Research and development
1,020
48
1,068
574
38
612
652
33
685
90
3
93
Total share-based compensation
1,485
153
1,638
915
129
1,044
966
119
1,085
133
15
148
(2) Relates to intersegment eliminations and adjustments
(3) Relates to the net income attributable to iQIYI noncontrolling interests
Baidu, Inc.
Selected Information
(In millions except for per ADS information, unaudited)
Twelve months ended
December 31, 2023 (RMB)
Twelve months ended
December 31, 2024 (RMB)
Twelve months ended
December 31, 2024 (US$)
Baidu
Core
iQIYI
Elim &
adj(2)
Baidu,
Inc.
Baidu
Core
iQIYI
Elim &
adj(2)
Baidu,
Inc.
Baidu
Core
iQIYI
Elim &
adj(2)
Baidu,
Inc.
Total revenues
103,465
31,873
(740)
134,598
104,712
29,225
(812)
133,125
14,345
4,004
(111)
18,238
YOY
1 %
(8 %)
(1 %)
Costs and expenses:
Cost of revenues (1)
42,592
23,103
(664)
65,031
44,830
21,954
(682)
66,102
6,142
3,008
(94)
9,056
Selling, general and administrative (1)
19,623
4,014
(118)
23,519
20,049
3,682
(111)
23,620
2,747
504
(15)
3,236
Research and development (1)
22,425
1,767
–
24,192
20,355
1,778
–
22,133
2,788
244
–
3,032
Total costs and expenses
84,640
28,884
(782)
112,742
85,234
27,414
(793)
111,855
11,677
3,756
(109)
15,324
YOY
Cost of revenues
5 %
(5 %)
2 %
Selling, general and administrative
2 %
(8 %)
0 %
Research and development
(9 %)
1 %
(9 %)
Cost and expenses
1 %
(5 %)
(1 %)
Operating income (loss)
18,825
2,989
42
21,856
19,478
1,811
(19)
21,270
2,668
248
(2)
2,914
YOY
3 %
(39 %)
(3 %)
Operating margin
18 %
9 %
16 %
19 %
6 %
16 %
Add: total other income (loss), net
4,298
(956)
–
3,342
8,311
(959)
–
7,352
1,139
(132)
–
1,007
Less: income tax expense
3,568
81
–
3,649
4,386
61
–
4,447
601
8
–
609
Less: net income (loss) attributable to NCI
154
27
1,053(3)
1,234
(28)
27
416(3)
415
(4)
4
57(3)
57
Net income (loss) attributable to Baidu
19,401
1,925
(1,011)
20,315
23,431
764
(435)
23,760
3,210
104
(59)
3,255
YOY
21 %
(60 %)
17 %
Net margin
19 %
6 %
15 %
22 %
3 %
18 %
Non-GAAP financial measures:
Operating income (non-GAAP)
24,748
3,643
28,433
23,890
2,363
26,234
3,273
323
3,594
YOY
(3 %)
(35 %)
(8 %)
Operating margin (non-GAAP)
24 %
11 %
21 %
23 %
8 %
20 %
Net income attributable to Baidu (non-GAAP)
27,418
2,838
28,747
26,335
1,512
27,002
3,608
206
3,699
YOY
(4 %)
(47 %)
(6 %)
Net margin (non-GAAP)
26 %
9 %
21 %
25 %
5 %
20 %
Adjusted EBITDA
31,863
3,918
35,823
30,587
2,510
33,078
4,190
344
4,532
YOY
(4 %)
(36 %)
(8 %)
Adjusted EBITDA margin
31 %
12 %
27 %
29 %
9 %
25 %
(1) Includes share-based compensation as follows:
Cost of revenues
457
133
590
340
121
461
47
16
63
Selling, general and administrative
1,363
315
1,678
1,153
274
1,427
158
37
195
Research and development
3,888
189
4,077
2,746
150
2,896
376
21
397
Total share-based compensation
5,708
637
6,345
4,239
545
4,784
581
74
655
(2) Relates to intersegment eliminations and adjustments
(3) Relates to the net loss attributable to iQIYI noncontrolling interests
Baidu, Inc.
Condensed Consolidated Statements of Cash Flows
(In millions,unaudited)
Three months ended
Three months ended
Three months ended
Three months ended
December 31, 2023 (RMB)
September 30, 2024 (RMB)
December 31, 2024 (RMB)
December 31, 2024 (US$)
Baidu
excl.
iQIYI
iQIYI
Baidu,
Inc.
Baidu
excl.
iQIYI
iQIYI
Baidu,
Inc.
Baidu
excl.
iQIYI
iQIYI
Baidu,
Inc.
Baidu
excl.
iQIYI
iQIYI
Baidu,
Inc.
Net cash provided by operating activities
9,985
633
10,618
4,036
243
4,279
1,836
520
2,356
252
71
323
Net cash used in investing activities
(11,805)
(1,431)
(13,236)
(12,300)
(1,663)
(13,963)
(4,741)
(896)
(5,637)
(649)
(123)
(772)
Net cash (used in) provided by financing activities
(7,586)
(22)
(7,608)
(2,787)
(2,612)
(5,399)
(1,784)
114
(1,670)
(245)
16
(229)
Effect of exchange rate changes on cash, cash equivalents and restricted
cash
(364)
(31)
(395)
(721)
(84)
(805)
582
61
643
80
8
88
Net decrease in cash, cash equivalents and restricted cash
(9,770)
(851)
(10,621)
(11,772)
(4,116)
(15,888)
(4,107)
(201)
(4,308)
(562)
(28)
(590)
Cash, cash equivalents and restricted cash
At beginning of period
42,063
6,132
48,195
48,878
7,907
56,785
37,106
3,791
40,897
5,084
519
5,603
At end of period
32,293
5,281
37,574
37,106
3,791
40,897
32,999
3,590
36,589
4,522
491
5,013
Net cash provided by operating activities
9,985
633
10,618
4,036
243
4,279
1,836
520
2,356
252
71
323
Less: Capital expenditures
(3,641)
(19)
(3,660)
(1,637)
(8)
(1,645)
(2,312)
(21)
(2,333)
(317)
(3)
(320)
Free cash flow
6,344
614
6,958
2,399
235
2,634
(476)
499
23
(65)
68
3
Note: Baidu excl. iQIYI represents Baidu, Inc. minus iQIYI’s consolidated cash flows.
Baidu, Inc.
Condensed Consolidated Statements of Cash Flows
(In millions,unaudited)
Twelve months ended
Twelve months ended
Twelve months ended
December 31, 2023 (RMB)
December 31, 2024 (RMB)
December 31, 2024 (US$)
Baidu
excl.
iQIYI
iQIYI
Baidu,
Inc.
Baidu
excl.
iQIYI
iQIYI
Baidu,
Inc.
Baidu
excl.
iQIYI
iQIYI
Baidu,
Inc.
Net cash provided by operating activities
33,263
3,352
36,615
19,126
2,108
21,234
2,620
289
2,909
Net cash used in investing activities
(48,657)
(1,740)
(50,397)
(6,110)
(2,445)
(8,555)
(837)
(335)
(1,172)
Net cash used in financing activities
(9,876)
(4,286)
(14,162)
(12,391)
(1,368)
(13,759)
(1,698)
(187)
(1,885)
Effect of exchange rate changes on cash, cash equivalents and
restricted cash
189
93
282
81
14
95
11
2
13
Net (decrease) increase in cash, cash equivalents and restricted cash
(25,081)
(2,581)
(27,662)
706
(1,691)
(985)
96
(231)
(135)
Cash, cash equivalents and restricted cash
At beginning of period
57,374
7,862
65,236
32,293
5,281
37,574
4,426
722
5,148
At end of period
32,293
5,281
37,574
32,999
3,590
36,589
4,522
491
5,013
Net cash provided by operating activities
33,263
3,352
36,615
19,126
2,108
21,234
2,620
289
2,909
Less: Capital expenditures
(11,154)
(36)
(11,190)
(8,055)
(79)
(8,134)
(1,103)
(11)
(1,114)
Free cash flow
22,109
3,316
25,425
11,071
2,029
13,100
1,517
278
1,795
Note: Baidu excl. iQIYI represents Baidu, Inc. minus iQIYI’s consolidated cash flows.
Baidu, Inc.
Reconciliations of Non-GAAP Financial Measures to the Nearest Comparable GAAP Measures
(In millions except for per ADS information, unaudited)
Three months ended
Three months ended
Three months ended
Three months ended
December 31, 2023 (RMB)
September 30, 2024 (RMB)
December 31, 2024 (RMB)
December 31, 2024 (US$)
Baidu
Core
iQIYI
Baidu,
Inc.
Baidu
Core
iQIYI
Baidu,
Inc.
Baidu
Core
iQIYI
Baidu,
Inc.
Baidu
Core
iQIYI
Baidu,
Inc.
Operating income
4,668
773
5,392
5,694
239
5,925
3,638
285
3,917
498
39
537
Add: Share-based compensation expenses
1,485
153
1,638
915
129
1,044
966
119
1,085
133
15
148
Add: Amortization and impairment of intangible assets(1)
44
1
45
43
2
45
43
2
45
6
–
6
Operating income (non-GAAP)
6,197
927
7,075
6,652
370
7,014
4,647
406
5,047
637
54
691
Add: Depreciation of fixed assets
1,921
61
1,982
1,684
35
1,719
1,869
38
1,907
256
6
262
Adjusted EBITDA
8,118
988
9,057
8,336
405
8,733
6,516
444
6,954
893
60
953
Net income (loss) attributable to Baidu
2,440
466
2,599
7,536
229
7,632
5,283
(189)
5,192
724
(26)
711
Add: Share-based compensation expenses
1,484
153
1,553
914
129
972
965
119
1,019
131
16
140
Add: Amortization and impairment of intangible assets(1)
42
1
42
41
2
42
41
2
42
6
–
6
Add: Disposal (gain) loss
(37)
(1)
(38)
(1,501)
22
(1,491)
7
–
7
1
–
1
Add: Impairment of long-term investments
132
62
160
26
91
68
84
14
90
12
2
12
Add: Fair value loss (gain) of long-term investments
403
–
403
(1,361)
7
(1,358)
(288)
(5)
(290)
(39)
(1)
(40)
Add: Reconciling items on equity method investments(2)
3,172
–
3,172
8
–
8
679
–
679
93
–
93
Add: Tax effects on non-GAAP adjustments(3)
(136)
–
(136)
13
–
13
(30)
–
(30)
(4)
–
(4)
Net income (loss) attributable to Baidu (non-GAAP)
7,500
681
7,755
5,676
480
5,886
6,741
(59)
6,709
924
(9)
919
Diluted earnings per ADS
6.77
21.60
14.26
1.95
Add: Accretion of the redeemable noncontrolling interests
0.53
0.01
0.55
0.08
Add: Non-GAAP adjustments to earnings per ADS
14.56
(5.01)
4.37
0.60
Diluted earnings per ADS (non-GAAP)
21.86
16.60
19.18
2.63
(1) This represents amortization and impairment of intangible assets resulting from business combinations.
(2) This represents Baidu’s share of equity method investments for other non-GAAP reconciling items, amortization and impairment of intangible assets not on the investee’s books, accretion of their redeemable noncontrolling interests, and the gain or loss
associated with the issuance of shares by the investees at a price higher or lower than the carrying value per share.
(3) This represents tax impact of all non-GAAP adjustments.
Baidu, Inc.
Reconciliations of Non-GAAP Financial Measures to the Nearest Comparable GAAP Measures
(In millions except for per ADS information, unaudited)
Twelve months ended
Twelve months ended
Twelve months ended
December 31, 2023 (RMB)
December 31, 2024 (RMB)
December 31, 2024 (US$)
Baidu Core
iQIYI
Baidu, Inc.
Baidu Core
iQIYI
Baidu, Inc.
Baidu Core
iQIYI
Baidu, Inc.
Operating income
18,825
2,989
21,856
19,478
1,811
21,270
2,668
248
2,914
Add: Share-based compensation expenses
5,708
637
6,345
4,239
545
4,784
581
74
655
Add: Amortization and impairment of intangible assets(1)
215
17
232
173
7
180
24
1
25
Operating income (non-GAAP)
24,748
3,643
28,433
23,890
2,363
26,234
3,273
323
3,594
Add: Depreciation of fixed assets
7,115
275
7,390
6,697
147
6,844
917
21
938
Adjusted EBITDA
31,863
3,918
35,823
30,587
2,510
33,078
4,190
344
4,532
Net income attributable to Baidu
19,401
1,925
20,315
23,431
764
23,760
3,210
104
3,255
Add: Share-based compensation expenses
5,704
637
5,993
4,235
545
4,482
580
75
613
Add: Amortization and impairment of intangible assets(1)
195
17
204
165
7
168
23
1
23
Add: Disposal (gain) loss
(1,926)
(90)
(1,967)
(1,982)
22
(1,972)
(272)
3
(270)
Add: Impairment of long-term investments
479
336
631
172
193
260
24
26
36
Add: Fair value (gain) loss of long-term investments
(54)
4
(52)
(393)
(19)
(403)
(54)
(3)
(55)
Add: Reconciling items on equity method investments(2)
3,918
9
3,922
1,050
–
1,050
144
–
144
Add: Tax effects on non-GAAP adjustments(3)
(299)
–
(299)
(343)
–
(343)
(47)
–
(47)
Net income attributable to Baidu (non-GAAP)
27,418
2,838
28,747
26,335
1,512
27,002
3,608
206
3,699
Diluted earnings per ADS
55.08
65.91
9.03
Add: Accretion of the redeemable noncontrolling interests
2.02
1.68
0.23
Add: Non-GAAP adjustments to earnings per ADS
23.75
9.26
1.27
Diluted earnings per ADS (non-GAAP)
80.85
76.85
10.53
(1) This represents amortization and impairment of intangible assets resulting from business combinations.
(2) This represents Baidu’s share of equity method investments for other non-GAAP reconciling items, amortization and impairment of intangible assets not on the investee’s books,
accretion of their redeemable noncontrolling interests, and the gain or loss associated with the issuance of shares by the investees at a price higher or lower than the carrying value per share.
(3) This represents tax impact of all non-GAAP adjustments.
View original content:https://www.prnewswire.com/news-releases/baidu-announces-fourth-quarter-and-fiscal-year-2024-results-302378728.html
SOURCE Baidu, Inc.

You may like
Technology
Secretary of State Belanger announces expansion of high-speed Internet access in Saskatchewan
Published
8 minutes agoon
July 24, 2026By
Federal investment of over $141 million will help connect more than 30,000 homes to high–speed Internet
HUMBOLDT, SK, July 24, 2026 /CNW/ — Reliable and affordable high-speed Internet is essential for all Canadians. It enables access to important online resources, connects friends and families, and drives economic growth and innovation. This is why the Government of Canada is helping bring high-speed Internet access to underserved communities–including Indigenous communities–in Saskatchewan.
Today, the Honourable Buckley Belanger, Secretary of State for Rural Development, announced over $141 million in federal funding for six projects to bring high-speed Internet access to more than 30,000 households in over 500 rural and remote communities across Saskatchewan.
This funding is provided through the Universal Broadband Fund, a program designed to ensure that Canadians in rural, remote and Indigenous communities have access to reliable high-speed Internet.
The Government of Canada has committed to ensuring that every household in Canada has access to high-speed Internet by 2030, and it is on track to meet this connectivity target. These projects will build toward that goal, and the government will continue to invest in infrastructure that creates new opportunities and makes sure communities can benefit from all of Canada’s potential.
Quotes
“High-speed Internet is no longer just a luxury–it’s essential infrastructure, no matter where you live in Canada. It’s how people access health care virtually, start a business or just stay in touch with their loved ones. That’s why we made a historic commitment to provide 100% of Canadian households with access to high-speed Internet by 2030. The projects announced today are a major milestone for connectivity in Saskatchewan, providing reliable and affordable high-speed Internet to more than 30,000 underserved homes in over 500 rural and remote communities across the province.”
– The Honourable Buckley Belanger, Secretary of State for Rural Development
“In many rural and remote areas, connectivity projects like these face a number of financial and structural barriers. Federal tools like the Canada Infrastructure Bank help bridge that gap, ensuring critical infrastructure is built where it otherwise would not be. By supporting initiatives like this, we are advancing economic growth today and helping close the connectivity gap for underserved communities well into the future.”
– The Honourable Gregor Robertson, Minister of Housing and Infrastructure and Minister responsible for Pacific Economic Development Canada
“Access to dependable high-speed Internet should not be determined by where people live. Thanks to support from the Government of Canada through the Universal Broadband Fund, RFNOW is delivering the infrastructure needed to connect underserved rural and First Nations communities across Saskatchewan. Together, we are building a stronger digital future that will enhance economic development, support essential services and improve quality of life for thousands of Canadians.”
– Chris Kennedy, Chief Executive Officer, RFNOW Inc.
“Every community deserves the opportunity that comes with access to reliable high-speed Internet–and that’s exactly what this investment delivers. In partnership with the Government of Canada’s Universal Broadband Fund, Xplore is bringing high-speed Internet connectivity to nearly 20,000 homes and businesses in Saskatchewan. Better connectivity means more than faster downloads–it means students can learn without interruption, families can access health care from home, and local businesses can compete on a level playing field.”
– Brent Johnston, Chief Executive Officer, Xplore Inc.
“Since our establishment in 2007, we have been committed to providing dependable Internet service and strengthening connections in the communities we serve. With support from the Government of Canada’s Universal Broadband Fund, we’re excited to expand our network and introduce new 6 GHz fixed wireless technology capable of delivering speeds of up to 1 Gbps. This project will help more residents of rural and remote communities access the reliable high-speed connectivity they need for work, education, health care, business and everyday life.”
– Allen Stafford, President, Stafford Communications Inc.
“Beaver River Broadband has secured federal Universal Broadband Fund support to deliver fibre-to-the-home infrastructure directly to Peepeekisis Cree Nation. This critical investment guarantees gigabit-capable Internet access that will transform local opportunities in digital education, remote health care and community-led economic development. Crucially, the project underscores the importance of partnering with smaller, regional Internet providers that bring deep community roots, agile deployment and a dedicated focus on serving areas that larger national carriers often overlook. As an Indigenous-led regional provider working closely with First Nations, Beaver River Broadband understands the unique needs of the area and delivers tailored, reliable customer support on the ground. Empowering local providers through initiatives like the Universal Broadband Fund ensures that underserved First Nations are not just connected but also supported by partners invested in their long-term digital sovereignty.”
– John DeGraauw, CEO, Beaver River Broadband
“MCSnet’s fibre-to-the-tower expansion in Saskatchewan will deliver fast, highly reliable Internet access to underserved homes in rural Saskatchewan, courtesy of a dedicated, community-invested provider. As a family-owned company based in the Prairies, we have been serving rural communities with our innovative technology and exceptional customer service for over 30 years.”
– Jerome VanBrabant, Chief Projects Officer, MCSnet
Quick facts
Canada’s Connectivity Strategy aims to provide all Canadians with access to Internet speeds of at least 50 megabits per second (Mbps) download / 10 Mbps upload.The Universal Broadband Fund is a $3.225 billion investment by the Government of Canada designed to help provide high-speed Internet access to 98% of Canadian households by the end of 2026 and achieve the national target of 100% access by 2030.Today, 97.4% of Canadian households have access to high-speed Internet, compared to just 79% in 2014.In Saskatchewan, 89.2% of households currently have access to high-speed internet.Since 2015, the Government of Canada has invested $242 million in connectivity projects in Saskatchewan.The Canada Infrastructure Bank has committed more than $2 billion toward digital (broadband) infrastructure, closing last-mile connectivity gaps across Canada.Indigenous women, girls, Two-Spirit individuals and gender diverse people are more likely to go missing or be murdered than non-Indigenous women. Better connectivity means more tools in moments of danger, enabling victims of violence to access critical online resources and get help when they need it most.Building on the Building a Green Prairie Economy Act, the Government of Canada launched the Prairie Partnership Initiative to build a dynamic, sustainable and inclusive economy in the Prairie provinces.
Associated links
Rural economic developmentHigh-Speed Internet Access DashboardUniversal Broadband FundBackgrounder: Universal Broadband Fund and Telesat low Earth orbit capacity agreementCanada Infrastructure Bank: Digital Infrastructure and AIHigh-Speed Access for All: Canada’s Connectivity StrategyNational Broadband MapFederal Pathway to Address Missing and Murdered Indigenous Women, Girls and 2SLGBTQQIA+ PeoplePrairie Partnership Initiative
Stay connected
Follow Innovation, Science and Economic Development Canada on social media. X (Twitter): @ISED_CA | Facebook: Canadian Innovation | Instagram: @cdninnovation | LinkedIn: Innovation, Science and Economic Development Canada
For easy access to government programs for businesses, download the Canada Business app.
SOURCE Innovation, Science and Economic Development Canada
Technology
Fragmented Web Strategies Leave Organizations Exposed as Digital Expectations Rise, Warns Info-Tech Research Group
Published
8 minutes agoon
July 24, 2026By
Organizations are increasingly focused on modernizing their digital presence to meet rising user expectations, yet many still rely on decentralized content models, inconsistent governance, and legacy platforms. New findings from Info-Tech Research Group show that without a structured web experience management (WEM) strategy, web initiatives often fail to align with business goals and user needs. The firm’s blueprint Develop Your Web Experience Management Strategy provides a five-phase framework and tools to help IT leaders strengthen governance and align web priorities with organizational objectives.
ARLINGTON, Va., July 24, 2026 /CNW/ — Organizations continue to invest in digital platforms and web modernization efforts, but progress is often limited by unclear priorities, inconsistent ownership, and a lack of shared performance measures. New insights from Info-Tech Research Group indicate that without a clear understanding of web experience maturity and readiness, digital investments fail to translate into consistent and measurable outcomes. The global research and advisory firm’s recently published blueprint, Develop Your Web Experience Management Strategy, provides a structured five-phase methodology to assess current-state capabilities, define priority audiences and journeys, and build a practical roadmap for evolving the web ecosystem in alignment with organizational objectives.
“Web experience management has moved beyond basic websites to become a core driver of growth and engagement,” says Hriday Gulrajani, senior research analyst at Info-Tech Research Group. “CIOs and IT leaders need to align marketing, data, and technology teams under clear governance and a structured roadmap to deliver consistent, scalable digital experiences.”
Info-Tech’s blueprint shows that many organizations treat web modernization as a technology upgrade rather than a coordinated experience strategy. As a result, content operations remain decentralized, integration between core systems such as CMS, CRM, and analytics platforms is inconsistent, and governance responsibilities are not clearly defined. While capabilities such as personalization, automation, and advanced analytics offer opportunities to improve engagement and operational efficiency, organizations often lack a structured framework for prioritizing initiatives and measuring progress across the web ecosystem.
Key Challenges IT Leaders Face in Web Experience Management
Despite ongoing investment in digital platforms and experience initiatives, many organizations encounter structural and operational barriers that limit progress. Info-Tech’s research highlights several persistent challenges:
Content decisions are often made in silos, resulting in inconsistent messaging, fragmented governance, and unclear ownership across teams.Limited integration between CMS, CRM, analytics, and other core systems restricts visibility into user behavior and makes it difficult to measure and improve web experience performance.Legacy platforms and constrained architectures limit personalization, automation, accessibility, and multichannel delivery capabilities.Misalignment between marketing, IT, and data teams slows decision-making and weakens the organization’s ability to evolve its web ecosystem strategically.
Info-Tech’s Practical Framework for Web Experience Management
To address these challenges, Info-Tech recommends a structured five-phase approach that connects organizational strategy, customer experience priorities, and web execution. The Develop Your Web Experience Management Strategy blueprint outlines the following priorities for CIOs and IT leaders:
Phase 1: Define Vision & Success Criteria – Align WEM objectives to organizational strategy, define strategic outcomes, and establish experience KPIs to measure performance across digital touchpoints.
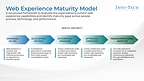
Phase 2: Assess Current State & Readiness – Use a web experience maturity model to evaluate capabilities across people, process, technology, and performance, and identify integration gaps and readiness risks.
Phase 3: Understand Audiences & Experience Priorities – Define priority personas, map end-to-end journeys, and translate organizational goals into structured web experience use cases prioritized by value and feasibility.
Phase 4: Architect & Govern the Ecosystem – Establish architecture principles, design the target-state WEM ecosystem, and define governance structures and operating models that clarify roles, ownership, and decision rights.
Phase 5: Launch, Communicate, & Measure – Develop a phased roadmap aligned to key value drivers, implement performance measurement frameworks, and enable continuous optimization across the web ecosystem.
Info-Tech’s Develop Your Web Experience Management Strategy blueprint is supported by a Web Experience Management Business Case Template and a Web Experience Initiatives Prioritization and Roadmap Planning Tool. These resources are designed to help CIOs and IT leaders build a clear case for modernization, prioritize initiatives based on value and feasibility, and develop phased roadmaps aligned to organizational objectives. By applying this framework and its supporting tools, organizations can strengthen governance, improve cross-functional alignment, and evolve their web ecosystem in a measurable and scalable way.
For exclusive and timely commentary from Info-Tech’s experts, including Hriday Gulrajani, and access to the complete Develop Your Web Experience Management Strategy blueprint, please contact pr@infotech.com.
About Info-Tech Research Group
Info-Tech Research Group is one of the world’s leading and fastest-growing research and advisory firms, serving over 30,000 IT, HR, and marketing professionals around the globe. As a trusted product and service leader, the company delivers unbiased, highly relevant research and industry-leading advisory support to help leaders make strategic, timely, and well-informed decisions. For nearly 30 years, Info-Tech has partnered closely with teams to provide everything they need, from actionable tools to expert guidance, ensuring they deliver measurable results for their organizations.
To learn more about Info-Tech’s HR research and advisory services, visit McLean & Company, and for data-driven software buying insights and vendor evaluations, visit the firm’s SoftwareReviews platform.
Media professionals can register for unrestricted access to research across IT, HR, and software, as well as hundreds of industry analysts through the firm’s Media Insiders program. To gain access, contact pr@infotech.com.
For information about Info-Tech Research Group or to access the latest research, visit infotech.com and connect via LinkedIn and X.
View original content to download multimedia:https://www.prnewswire.com/news-releases/fragmented-web-strategies-leave-organizations-exposed-as-digital-expectations-rise-warns-info-tech-research-group-302834308.html
SOURCE Info-Tech Research Group
Technology
In HelloNation, Custom Fabrication Expert Mark Coyle Explains What to Know Before Choosing an Aluminum Fabrication Partner
Published
8 minutes agoon
July 24, 2026By
The article explains how an integrated fabrication process supports better quality, efficiency, and long-term project success.
ROCHESTER, N.Y., July 24, 2026 /PRNewswire/ — What should someone look for before selecting an aluminum fabrication partner who can guide a project from the first design sketch through final delivery? That question is answered in a HelloNation article featuring insights from Custom Fabrication Expert Mark Coyle of American Custom Metals, Inc. in Rochester, New York, that explains how the full aluminum production workflow shapes accuracy, consistency, and long-term reliability. The article shows why a clear understanding of each stage in the process helps people make informed decisions before committing to a fabrication partner.
The article begins by explaining that aluminum fabrication involves far more than cutting or welding. It describes how every project moves through a connected chain of design support, extrusion, machining, finishing, and logistics. Each step affects the next, and the article notes that the best results come from choosing an aluminum fabrication partner who keeps these stages aligned. By showing how coordination prevents errors, the article gives readers a practical way to evaluate a potential shop.
Early design support is a major focus of the article. It states that many projects benefit when design engineering is handled in-house because small adjustments to a profile can influence strength, weight, and final performance. The HelloNation article explains that an aluminum fabrication partner with internal design capabilities can review shapes before tooling begins, reducing the risk of delays caused by unrealistic or difficult-to-extrude features. This design stage sets the direction for everything that follows, making it one of the most valuable parts of the process.
The article also examines extrusion, which it calls one of the most specialized stages in aluminum manufacturing. It notes that some shops do not extrude their own material, which forces them to rely on outside mills. That structure can lead to longer schedules and more points of communication. By contrast, an aluminum fabrication partner with direct access to extrusion equipment can control die design, schedule production runs, and manage metal flow more precisely. The article explains that this control reduces variation between batches, which supports stable timelines and more predictable quality.
Machining receives detailed attention as well. The article states that accuracy depends on how well each machine is calibrated for the specific alloy and geometry involved. It describes how a fabricator who machines their own extrusions becomes familiar with how those profiles respond to different tool paths and cutting forces. This familiarity supports tighter tolerances and more dependable results. The article explains that when machining is outsourced, the receiving shop may not know the conditions under which the material was extruded or aged, which can cause small adjustments that affect uniformity across long runs.
Finishing is another important stage explored in the article. It explains how anodizing, powder coating, polishing, or protective layers interact with thickness and alloy. The article notes that when finishing is spread across multiple vendors, the project moves more often, which increases the chance for delays or inconsistency. An aluminum fabrication partner with integrated finishing services can keep color and coating texture more uniform while maintaining a tighter schedule.
Logistics also plays a key role in the article’s guidance. It highlights that aluminum profiles, especially long or delicate ones, require thoughtful packaging, palletizing, and freight planning. A shop with its own logistics team can reduce damage risks and speed up the time between manufacturing and delivery. The article explains that when logistics is outsourced, communication slows down and the chances of errors increase, making it harder to keep a project on schedule.
Tolerance control is another subject the article describes. It explains that aluminum reacts to heat, pressure, and machining forces in predictable ways only when the team understands how the material was formed at every stage. The article notes that when extrusion, aging, machining, and inspection all occur within one operation, teams can maintain a closed loop of information. This reduces the risk of dimensional issues and strengthens consistency from batch to batch.
As the article moves toward its conclusion, it emphasizes that choosing the right aluminum fabrication partner comes down to understanding how many stages the shop directly manages. When a partner controls design, extrusion, machining, finishing, and logistics, communication becomes clearer, and the workflow becomes more predictable. The article explains that this unified structure allows teams to adjust quickly because they understand every step of the operation.
The article ends by stating that dependable performance in aluminum work depends on how well each stage connects to the next. A strong aluminum fabrication partner is defined not by one capability but by how the entire process fits together. This guidance gives readers a practical way to evaluate potential partners and make decisions that support long-term project success.
What to Know Before Choosing an Aluminum Fabrication Partner features insights from Mark Coyle, Custom Fabrication Expert of Rochester, NY, in HelloNation.
About HelloNation
HelloNation is America’s Good News Network, a premier media platform built on the idea that good news travels faster when real people tell real stories. Through its community-focused publications and innovative “edvertising” approach, HelloNation delivers content that informs, inspires, and spotlights the leaders making a meaningful impact in their communities.
View original content to download multimedia:https://www.prnewswire.com/news-releases/in-hellonation-custom-fabrication-expert-mark-coyle-explains-what-to-know-before-choosing-an-aluminum-fabrication-partner-302834344.html
SOURCE HelloNation

Secretary of State Belanger announces expansion of high-speed Internet access in Saskatchewan

Fragmented Web Strategies Leave Organizations Exposed as Digital Expectations Rise, Warns Info-Tech Research Group
In HelloNation, Custom Fabrication Expert Mark Coyle Explains What to Know Before Choosing an Aluminum Fabrication Partner
Send Rakhi to UK swiftly with UK Gifts Portal

Whiteboard Series with NEAR | Ep: 45 Joel Thorstensson from ceramic.network

New Gooseneck Omni Antennas Offer Enhanced Signals in a Durable Package

Why You Should Build on #NEAR – Co-founder Illia Polosukhin at CV Labs
Whiteboard Series with NEAR | Ep: 45 Joel Thorstensson from ceramic.network

NEAR End of Year Town Hall 2021: The Open Web World, MetaBUILD 2 Hackathon and 2021 recap
Trending
-

 Coin Market5 days ago
Will the US get CLARITY this week? Bitcoin’s new $80K target: Hodler’s Digest, July 19
-

 Technology5 days ago
“Every Day CO₂ Challenge”: More Than a Game, A New Way of Learning
-

 Technology4 days ago
Trakka Systems to Demonstrate Advanced ISR Capabilities at Farnborough International Airshow 2026
-
Technology5 days ago
China-Europe Youth Exchange Campaign: When Fashion Meets Football — A Green Pitch Appointment for Cross-Cultural Dialogue
-

 Technology5 days ago
Powering ASEAN’s Manufacturing Transformation: IME 2026 Connects Technology, Industry and Opportunity
-

 Technology4 days ago
Signeasy expands beyond eSignatures with Intelligent Contract Management for growing businesses
-
 Technology5 days ago
DBS named Asia’s Best Digital Bank by Euromoney, recognised for its AI leadership and responsible innovation
-

 Technology4 days ago
BOC Group Releases ADONIS 19.0 LTS to Bring Smarter Support into Everyday BPM Work