
Technology
QUEBECOR INC. REPORTS CONSOLIDATED RESULTS FOR FOURTH QUARTER AND FULL YEAR 2024

Published
2 years agoon
By

MONTRÉAL, Feb. 27, 2025 /PRNewswire/ – Quebecor Inc. (“Quebecor” or the “Corporation”) today reported its consolidated financial results for the fourth quarter and full year of 2024. Quebecor consolidates the financial results of its Quebecor Media Inc. (“Quebecor Media”) subsidiary.
Highlights
2024 financial year and recent developments
In 2024, Quebecor recorded cash flows provided by operating activities of $1.72 billion, up $256.8 million (17.6%), adjusted EBITDA1 of $2.37 billion, up $129.7 million (5.8%), and revenues of $5.64 billion, up $204.1 million (3.8%) compared with 2023.The Telecommunications segment increased its adjusted cash flows from operations2 by $62.7 million (3.7%), its adjusted EBITDA by $105.1 million (4.7%), and its revenues by $181.1 million (3.9%).Revenues from mobile services and equipment increased by $324.4 million or 15.9% due to the impact of the acquisition of Freedom Mobile Inc. (“Freedom”) and revenue growth at Videotron Ltd. (“Videotron”).There was a net increase of 373,300 (9.9%) connections to the mobile telephony service and 251,300 (3.3%) total revenue‑generating units3 (“RGUs”) in the Telecommunications segment.The Media and Sports and Entertainment segments also grew their adjusted EBITDA by $24.2 million and $4.4 million respectively in 2024.Quebecor’s net income attributable to shareholders was $747.5 million ($3.23 per basic share), up $97.0 million ($0.41 per basic share) or 14.9%.Adjusted income from operating activities4 was $747.0 million ($3.23 per basic share), an increase of $58.9 million ($0.25 per basic share) or 8.6%.The consolidated net debt leverage ratio decreased to 3.31x, the lowest among Canada’s major telecoms.The quarterly dividend on the Corporation’s Class A Multiple Voting Shares (“Class A Shares”) and Class B Subordinate Voting Shares (“Class B Shares”) was increased from $0.325 to $0.35.On January 28, 2025, Freedom announced a major upgrade to its services: State‑of‑the‑art 5G+ technology was henceforth included in all monthly mobile plans, regardless of price. 5G+ access was also automatically added to the 5G plans of all existing customers with compatible phones, at no extra cost. As well, Freedom expanded international roaming options for its customers by extending the scope of Roam Beyond, a revolutionary plan that lets users enjoy the features of their mobile plan in over 100 global destinations.In 2024, Freedom and Fizz announced the expansion of their service areas in several regions of British Columbia, Alberta and Manitoba through agreements reached under the Canadian Radio‑television and Telecommunications Commission’s (“CRTC”) Mobile Virtual Network Operator (“MVNO”) framework.On February 20, 2025, Videotron announced the expansion of its wireless service area in several sectors of the Municipalité régionale de comté (“MRC”) de Témiscamingue. Residents and businesses in these sectors can now subscribe to Videotron wireless services. This followed the expansion of Videotron’s service area in the MRC de la Haute‑Côte‑Nord and the MRC de Charlevoix‑Est announced on December 12, 2024, and in the Gaspésie and Côte‑Nord regions announced on September 26, 2024.On April 10, 2024, Videotron announced that it would help improve wireless coverage in outlying regions of Québec by installing at least 37 new cell towers in Abitibi‑Témiscamingue and the Laurentians in partnership with the Québec government.On May 7, 2024, Freedom announced the phased roll‑out of its affordable new wireline Internet and TV services, Freedom Home Internet and Freedom TV, becoming a true multi‑service player capable of addressing a new customer segment seeking bundled offers.On February 5, 2025, Fizz announced the launch of Fizz TV, an all‑digital television service. Available to all Fizz Internet subscribers in Québec, Fizz TV is differentiated by a pick‑and‑pay model that lets users build their own low‑cost TV plan.On October 2, 2024, Quebecor, through its Quebecor Out‑of‑Home division, acquired the Canada‑wide out‑of‑home advertising business of Media Group Inc. (“NEO‑OOH”) and integrated it into Québecor Affichage Neo Inc. The Corporation can now offer its advertising partners more than 17,000 advertising faces across Canada, a unified platform with new reach and power that complements Quebecor’s comprehensive multiplatform advertising offering.On June 26, 2024, Event Management Gestev Inc. (“Gestev”) acquired Evenma, a company that manages popular and corporate events including the renowned Festivent and Festibières festivals. This acquisition is an important step in Gestev’s expansion, strengthening its leadership position in the events market.In May 2024, the Corporation obtained Investment Grade ratings from the credit rating agencies S&P Global Ratings, which upgraded Videotron’s unsecured debt from BB+ to BBB‑, and Moody’s Ratings, which upgraded Videotron’s unsecured debt from Ba2 to Baa3. Following these new ratings, all liens on Videotron’s assets granted to the bank lenders were terminated and the related debt instruments (including derivatives) are now unsecured.On June 17, 2024, Videotron redeemed at maturity its Senior Notes in aggregate principal amount of US$600.0 million, bearing interest at 5.375%, and unwound the related hedging contracts for a total cash consideration of $662.3 million.On June 25, 2024, the Corporation redeemed all its outstanding 4.0% convertible debentures for a total aggregate principal amount of $150.0 million. Pursuant to the terms of the debentures, the Corporation elected to settle the redemption in shares and consequently issued and delivered 5,161,237 Class B Shares to the holders.On November 8, 2024, Videotron issued US$700.0 million aggregate principal amount of 5.700% Senior Notes maturing on January 15, 2035 for net proceeds of $964.6 million. Videotron used the net proceeds, together with drawings on its revolving credit facility, to repay in full its $700.0 million Tranche A term loan maturing in October 2025 and its 5.750% Senior Notes maturing in 2026 in the amount of $375.0 million. On June 21, 2024, Videotron also issued $600.0 million aggregate principal amount of Senior Notes bearing interest at 4.650% and maturing on July 15, 2029, and $400.0 million aggregate principal amount of Senior Notes bearing interest at 5.000% and maturing on July 15, 2034, for total net proceeds of $992.6 million.
___________________________________
1 See “Adjusted EBITDA” under “Definitions.”
2 See “Adjusted cash flows from operations” under “Definitions.”
3 See “Key performance indicator” under “Definitions.”
4 See “Adjusted income from operating activities” under “Definitions.”
Fourth quarter 2024
In the fourth quarter of 2024, Quebecor recorded a $56.7 million (16.9%) increase in cash flows provided by operating activities to $392.4 million, and a $23.6 million (4.2%) increase in adjusted EBITDA to $589.0 million, despite a slight $5.8 million (‑0.4%) decrease in revenues to $1.50 billion, compared with the same period of 2023.The Telecommunications segment increased its adjusted cash flows from operations by $32.0 million (8.0%) and its adjusted EBITDA by $6.9 million (1.2%), despite a $32.2 million (‑2.5%) decrease in revenues.Revenues from mobile services and equipment increased by $15.7 million or 2.4%.There was a net increase of 87,500 connections (2.2%) to the mobile telephony service, 32.4% more growth than in the same quarter of 2023, and RGUs increased by 49,700 (0.6%).Quebecor’s net income attributable to shareholders was up $31.5 million ($0.13 per basic share) to $177.7 million ($0.76 per basic share) or 21.5 %.Adjusted income from operating activities was $186.6 million ($0.80 per basic share), an increase of $19.1 million ($0.07 per basic share) or 11.4%.
Comments by Pierre Karl Péladeau, President and Chief Executive Officer of Quebecor
Thanks to rigorous operational management and strict financial discipline with respect to investments and liquidity, Quebecor delivered a solid performance in 2024 despite the highly competitive environment. The Corporation posted increases of 17.6% in cash flows provided by operating activities, 8.6% in adjusted income from operating activities, 5.8% in adjusted EBITDA and 3.8% in revenues. Fourth‑quarter results were also strong, with increases of 16.9% in cash flows provided by operating activities and 4.2% in adjusted EBITDA. This remarkable performance enabled us to continue reducing our net debt and to bring our consolidated net debt leverage ratio down to 3.31x, the lowest among Canada’s major telecom providers.
Since acquiring Freedom in April 2023 and becoming Canada’s fourth major telecom, we have succeeded in disrupting the established order. Despite our aggressive sales strategy, we were the only major Canadian telecom to simultaneously grow market share, increase cash flows, reduce consolidated debt and consolidated net debt leverage ratio on a consistent and steady basis, while continuing to make substantial investments in our networks and customer experience, and increasing the dividend to our shareholders. We continue gaining traction as the new national carrier, while remaining the most profitable player in the Canadian industry and the one with the strongest balance sheet.
In 2024, we successfully promoted genuine competition in telecommunications services across the country and, as promised, brought down wireless prices for the benefit of all Canadians. We also delivered on all of the undertakings we made to Innovation, Science and Economic Development Canada (ISED) and to Canadians when we acquired Freedom. As planned, we expanded Freedom’s and Fizz’s service areas in several regions of Canada, including British Columbia, Alberta, Manitoba and Ontario, notably through agreements signed under the CRTC’s MVNO framework. Videotron and Fizz also continued their regional development by expanding their footprint in the Témiscamingue, Charlevoix‑Est, Gaspésie and Côte‑Nord regions. Together, Videotron, Fizz and Freedom now reach over 33 million Canadians, more than 80% of Canada’s population.
These expansions, together with our range of competitively priced products, drove continuing market share gains across Canada. In 2024, we added 373,300 lines (9.9%) to mobile telephony services, including 87,500 lines (2.2%) in the fourth quarter 2024, 32.4% more than in the same quarter of 2023.
True to our commitment to build a fast, reliable and affordable wireless network, we announced in January 2025 that access to state‑of‑the‑art 5G+ technology will now be included in all Freedom monthly mobile plans and the coverage of the international roaming plan has been expanded. Videotron’s Canada‑International wireless plan was also enhanced with the addition of 28 new destinations and now covers almost half the globe. Strategic investments were also made in network upgrades. In November 2024, we announced improvements to Freedom’s wireless network in Ontario, Alberta and British Columbia with the recent activation of 180 new sites.
As innovation is a key driver of our business model, we continue to enhance our offering in order to deliver maximum value to our customers. In February 2025, we introduced Fizz TV, an all‑digital, low‑cost, customizable television service available to Fizz Internet subscribers in Québec. Meanwhile, in 2024, Freedom rolled out affordable new wireline Internet and TV services, Freedom Home Internet and Freedom TV, making it a true multi‑service player capable of addressing a new customer segment.
Customer experience is our core priority, and we are proud of the many honours we have received as a result. Léger’s 2025 WOW Index once again ranked Videotron first for in‑store experience in Québec, while Fizz held its position as Canada’s leader in online experience for the sixth consecutive year. Freedom moved up to third place in online experience. These distinctions follow those in the August 2024 Léger survey, in which Videotron was named as the telecommunications provider with the best customer service in Québec by more than twice as many respondents as its nearest rival.
Our outstanding customer service was also reflected in the annual report released in January 2025 by the Commission for Complaints for Telecom‑television Services (“CCTS”). While the volume of complaints logged by the CCTS about the telecom industry as a whole increased by 38%, Videotron stood out for the third consecutive year with an exceptional 14% decrease. Fizz and Freedom also performed significantly better than the industry average, even while substantially growing their customer base with the major expansion of their subscription areas.
We continue making the argument to government authorities that wholesale Internet rates should be reviewed to make them just and reasonable, taking into account the retail offerings of the three main incumbents. In particular, Telus Communications Inc. (TELUS) currently pays much lower rates for fibre-to-the-premises (FTTP) access in Québec and Ontario than the rates it charges in the western provinces, allowing it to compete with the established players in eastern Canada while other ISPs are disadvantaged in western Canada by the much higher rates for the same access. This hampers Freedom’s ability to offer new competitively priced Internet access services in western Canada, as it does with wireless services.
TVA Group Inc. (“TVA Group”) posted adjusted EBITDA of $11.1 million in 2024, a favourable variance of $16.6 million compared with the previous year. Despite the continued significant decline in our advertising revenues, reflecting the worldwide crisis in the media industry, we were able to improve our earnings, due in part to the return of major productions to our MELS studios and the reduction in operating expenses resulting from the restructuring plan for our television operations announced on November 2, 2023, which will bring TVA Group’s media, television studio and newsroom teams together under one roof at 4545 Frontenac St. in Montréal. This colossal project, which will be completed in the coming weeks, will provide our media group with a modern newsroom, designed to foster collaboration and responsiveness, as well as state‑of‑the‑art studios.
In this context, we are particularly proud to have held our industry‑leading position with a 40.7% market share in 2024. TVA Network maintained a wide lead among over‑the‑air channels with a 23.5% market share, more than its two main over‑the‑air rivals combined. Flagship shows such as Chanteurs masqués, which averaged more than 1.6 million viewers, and Sortez‑moi d’ici! and La Voix, with more than 1.5 million viewers each, were a major factor in TVA Network’s success. LCN retained its status as the most‑watched specialty channel in Québec with a 7.0% market share, an impressive 0.6‑point increase due in part to the performance of its public affairs programs and their coverage of the U.S. election campaign.
It is regrettable, however, that at a time when the industry is in a pervasive crisis and television is struggling to survive, the government has not chosen to extend the print journalism tax credit to television. To maintain the robust news coverage essential to our democracy, the work of all journalists, regardless of platform, must be supported. The trends affecting our industry will only accelerate; we will therefore continue making our case to government authorities to ensure Quebecers retain access to quality news coverage in all parts of Québec.
In 2024, we also became a major player in out‑of‑home advertising across Canada through the acquisition of NEO‑OOH’s Canada‑wide out‑of‑home business. It has been integrated into our Québecor Affichage Neo division, expanding our comprehensive multiplatform advertising portfolio to more than 17,000 faces across the country.
QUB radio also expanded significantly in 2024, moving to television on the QUB specialty channel and, under a broadcast agreement with Leclerc Communication Inc. and NumériQ Inc., to radio at 99.5 on the FM band in August 2024. Combined with a strong digital presence, these new platforms have grown QUB radio’s audience and amplified its impact on the Québec media landscape.
In the Sports and Entertainment segment, we strengthened our leadership in the events market in 2024 with the acquisition of Evenma, a firm that manages popular and corporate events, positioning us to offer a wider range of events and shows in more regions.
In keeping with the culture of community engagement established by our founder Pierre Péladeau, we announced a historic $10 million donation to the Fondation du CHU de Québec in December 2024. The money will be used, among other things, to support projects to humanize care and to purchase an MRI‑linac, a highly specialized piece of equipment, for the hospital’s cancer centre, which will be named in honour of Pierre Péladeau. In February 2025, reaffirming our commitment to education and our support for the future leaders who will shape the Québec of the tomorrow, we announced a $20 million donation to Université Laval to support the creation of the Carrefour international Brian‑Mulroney. In recognition of this gift, the building adjacent to the Carrefour will be named after Pierre Péladeau, bringing together two great figures in the history of Quebecor and Québec.
With 2025 well underway, we remain firmly committed to pursuing our cross‑Canada expansion in the telecommunications segment, driving competition, and diversifying our products in line with market trends. Leveraging our strong execution capabilities, we will stay focused on our strategic priorities while maintaining strict financial discipline. Our success is, above all, a testament to the dedication and expertise of our people. It is their daily contributions that make Quebecor and its brands industry leaders. Guided by our ambitious vision and our determination to create long‑term value for all our stakeholders, we look to the future with confidence and resolve.
Non‑IFRS financial measures
The Corporation uses financial measures not standardized under International Financial Reporting Standards (“IFRS”), such as adjusted EBITDA, adjusted income from operating activities, adjusted cash flows from operations, free cash flows from operating activities and consolidated net debt leverage ratio, and key performance indicators, including RGU. Definitions of the non‑IFRS measures and key performance indicator used by the Corporation in this press release are provided in the “Definitions” section.
Financial table
Table 1
Consolidated summary of income, cash flows and balance sheet
(in millions of Canadian dollars, except per basic share data)
Years ended
December 31
Three months ended
December 31
2024
2023
2022
2024
2023
Income
Revenues:
Telecommunications
$
4,835.1
$
4,654.0
$
3,718.2
$
1,265.5
$
1,297.7
Media
703.0
721.9
755.4
194.7
204.8
Sports and Entertainment
225.3
213.4
190.6
69.2
56.4
Inter‑segments
(125.0)
(155.0)
(132.3)
(30.4)
(54.1)
5,638.4
5,434.3
4,531.9
1,499.0
1,504.8
Adjusted EBITDA (negative adjusted EBITDA):
Telecommunications
2,335.4
2,230.3
1,912.9
565.9
559.0
Media
31.9
7.7
25.0
15.0
13.6
Sports and Entertainment
27.4
23.0
19.4
10.8
2.2
Head Office
(27.2)
(23.2)
(22.8)
(2.7)
(9.4)
2,367.5
2,237.8
1,934.5
589.0
565.4
Depreciation and amortization
(943.3)
(909.0)
(767.7)
(236.6)
(231.1)
Financial expenses
(414.1)
(408.4)
(323.0)
(96.5)
(107.0)
Gain (loss) on valuation and translation of financial
instruments
15.5
(5.0)
(19.2)
–
(8.7)
Restructuring, impairment of assets and other
(27.4)
(52.4)
(14.5)
(13.1)
(23.5)
Income taxes
(256.7)
(227.9)
(213.4)
(65.4)
(53.9)
Net income
$
741.5
$
635.1
$
596.7
$
177.4
$
141.2
Net income attributable to shareholders
$
747.5
$
650.5
$
599.7
$
177.7
$
146.2
Adjusted income from operating activities
747.0
688.1
624.8
186.6
167.5
Per basic share:
Net income attributable to shareholders
3.23
2.82
2.55
0.76
0.63
Adjusted income from operating activities
3.23
2.98
2.66
0.80
0.73
Table 1 (continued)
Years ended
December 31
Three months ended
December 31
2024
2023
2022
2024
2023
Capital expenditures:
Telecommunications
$
579.1
$
536.7
$
457.1
$
135.3
$
160.4
Media
30.7
12.9
32.0
5.3
6.2
Sports and Entertainment
6.8
7.7
3.9
2.0
2.9
Head Office
0.6
1.1
1.9
0.1
0.2
617.2
558.4
494.9
142.7
169.7
Acquisitions of spectrum licences
298.9
9.9
–
–
–
Cash flows:
Adjusted cash flows from operations:
Telecommunications
1,756.3
1,693.6
1,455.8
430.6
398.6
Media
1.2
(5.2)
(7.0)
9.7
7.4
Sports and Entertainment
20.6
15.3
15.5
8.8
(0.7)
Head Office
(27.8)
(24.3)
(24.7)
(2.8)
(9.6)
1,750.3
1,679.4
1,439.6
446.3
395.7
Free cash flows from operating activities1
1,120.3
910.5
783.2
302.9
184.4
Cash flows provided by operating activities
1,719.0
1,462.2
1,262.7
392.4
335.7
Dividends declared
301.7
277.1
282.1
75.7
69.3
Dividends declared per basic share
1.30
1.20
1.20
0.33
0.30
Balance sheet:
Cash and cash equivalents
$
61.8
$
11.1
$
6.6
Working capital
(36.0)
(1,125.6)
(724.7)
Net assets related to derivative financial instruments
141.2
110.8
520.3
Total assets
12,998.7
12,741.3
10,625.3
Bank indebtedness
6.7
9.6
10.1
Total long‑term debt (including current portion)
7,619.7
7,668.2
6,517.7
Lease liabilities (current and long term)
409.7
376.2
186.2
Convertible debentures, including embedded derivatives
–
165.0
160.0
Equity attributable to shareholders
2,157.2
1,726.9
1,357.3
Equity
2,264.7
1,837.7
1,483.5
Consolidated net debt leverage ratio2
3.31x
3.39x
3.20x
_________________________________
1 See “Free cash flows from operating activities” under “Definitions.”
2 See “Consolidated net debt leverage ratio” under “Definitions.”
2024/2023 FINANCIAL YEAR COMPARISON
Revenues: $5.64 billion, a $204.1 million (3.8%) increase.
Revenues increased in Telecommunications ($181.1 million or 3.9% of segment revenues), due primarily to the contribution of Freedom, and in Sports and Entertainment ($11.9 million or 5.6%).Revenues decreased in Media ($18.9 million or ‑2.6%).
Adjusted EBITDA: $2.37 billion, a $129.7 million (5.8%) increase.
Adjusted EBITDA increased in Telecommunications ($105.1 million or 4.7% of segment adjusted EBITDA), mainly related to the contribution of Freedom; in Media ($24.2 million), due primarily to the $10.2 million favourable retroactive impact of an agreement on carriage fees for the LCN specialty channel combined with higher volume in film production and audiovisual services; and in Sports and Entertainment ($4.4 million or 19.1%).There was an unfavourable variance at Head Office ($4.0 million).
Net income attributable to shareholders: $747.5 million ($3.23 per basic share) in 2024, compared with $650.5 million ($2.82 per basic share) in 2023, an increase of $97.0 million ($0.41 per basic share).
The favourable variances were:$129.7 million increase in adjusted EBITDA;$25.0 million favourable variance in the charge for restructuring, impairment of assets and other;$20.5 million favourable variance in gain and loss on valuation and translation of financial instruments, without any tax consequences.The unfavourable variances were:$34.3 million increase in the depreciation and amortization charge;$28.8 million increase in the income tax expense;$9.4 million unfavourable variance in non‑controlling interest;$5.7 million increase related to financial expenses.
Adjusted income from operating activities: $747.0 million ($3.23 per basic share) in 2024, compared with $688.1 million ($2.98 per basic share) in 2023, an increase of $58.9 million ($0.25 per basic share).
Adjusted cash flows from operations: $1.75 billion, a $70.9 million (4.2%) increase due to the $129.7 million increase in adjusted EBITDA, partially offset by a $58.8 million increase in capital expenditures.
Cash flows provided by operating activities: $1.72 billion, a $256.8 million (17.6%) increase due primarily to the favourable net change in non‑cash balances related to operating activities, the increase in adjusted EBITDA and the decrease in the cash portion of the charge for restructuring, impairment of assets and other, partially offset by the increase in current income taxes.
2024/2023 FOURTH QUARTER COMPARISON
Revenues: $1.50 billion, a $5.8 million (‑0.4%) decrease.
Revenues decreased in Telecommunications ($32.2 million or ‑2.5% of segment revenues) and in Media ($10.1 million or ‑4.9%).Revenues increased in Sports and Entertainment ($12.8 million or 22.7%).
Adjusted EBITDA: $589.0 million, a $23.6 million (4.2%) increase.
Adjusted EBITDA increased in Telecommunications ($6.9 million or 1.2% of segment adjusted EBITDA), Media ($1.4 million or 10.3%) and Sports and Entertainment ($8.6 million). There was a favourable variance at Head Office ($6.7 million).The change in the fair value of Quebecor stock options and stock‑price‑based share units was the main factor in a $15.1 million favourable variance in the Corporation’s stock‑based compensation charge in the fourth quarter of 2024 compared with the same period of 2023.
Net income attributable to shareholders: $177.7 million ($0.76 per basic share) in the fourth quarter of 2024, compared with $146.2 million ($0.63 per basic share) in the same period of 2023, an increase of $31.5 million ($0.13 per basic share) or 21.5%.
The favourable variances were:$23.6 million increase in adjusted EBITDA;$10.5 million decrease in financial expenses;$10.4 million decrease in the charge for restructuring, impairment of assets and other;$8.7 million favourable variance in gain and loss on valuation and translation of financial instruments, including $8.8 million without any tax consequences.The unfavourable variances were:$11.5 million increase in the income tax expense;$5.5 million increase in the depreciation and amortization charge;$4.7 million unfavourable variance in non‑controlling interest.
Adjusted income from operating activities: $186.6 million ($0.80 per basic share) in the fourth quarter of 2024, compared with $167.5 million ($0.73 per basic share) in the same period of 2023, an increase of $19.1 million ($0.07 per basic share) or 11.4%.
Adjusted cash flows from operations: $446.3 million, a $50.6 million (12.8%) increase in the fourth quarter of 2024 due to the $23.6 million increase in adjusted EBITDA and the $27.0 million decrease in capital expenditures.
Cash flows provided by operating activities: $392.4 million, a $56.7 million (16.9%) increase in the fourth quarter of 2024 due primarily to the increase in adjusted EBITDA, the favourable net change in non‑cash balances related to operating activities, the decrease in the cash portion of the charge for restructuring, impairment of assets and other, and a decrease in the cash portion of financial expenses, partially offset by an increase in current income taxes.
Financing operations
On February 26, 2025, Videotron amended and restated its credit agreement to, among other things, amend its existing $500.0 million revolving credit facility by creating two tranches: (i) a first tranche in the amount of $250.0 million maturing in February 2030, and (ii) a second tranche in the amount of $250.0 million maturing in February 2026 and providing for a conversion option into a term facility maturing in February 2027.On January 29, 2025, Videotron adjusted the total amount of credit available under its revolving credit facility from $2.00 billion to $500.0 million.On November 8, 2024, Videotron issued US$700 million aggregate principal amount of 5.700% Senior Notes, or 5.10% taking into account cross‑currency swaps, maturing on January 15, 2035. Videotron used the net proceeds, together with drawings on its revolving credit facility, to repay in full its $700.0 million Tranche A term loan maturing in October 2025 and its 5.750% Senior Notes maturing in 2026 in the amount of $375.0 million.On June 25, 2024, the Corporation redeemed all its outstanding 4.0% convertible debentures for a total aggregate principal amount of $150.0 million. Pursuant to the terms of the debentures, the Corporation elected to settle the redemption in shares and consequently issued and delivered 5,161,237 Class B Shares to the holders.On June 21, 2024, Videotron issued $600.0 million aggregate principal amount of Senior Notes bearing interest at 4.650% and maturing on July 15, 2029, and $400.0 million aggregate principal amount of Senior Notes bearing interest at 5.000% and maturing on July 15, 2034, for total net proceeds of $992.6 million, net of discount at issuance and financing costs of $7.4 million. The proceeds were used to repay US$600.0 million aggregate principal amount of Senior Notes on June 17, 2024 and to reduce drawings on its revolving bank credit facility.On June 17, 2024, Videotron redeemed at maturity its Senior Notes in aggregate principal amount of US$600.0 million, bearing interest at 5.375%, and unwound the related hedging contracts for a total cash consideration of $662.3 million.On June 13, 2024, Videotron amended its term credit facility by extending the maturity of the first tranche of $700.0 million from October 2024 to October 2025 and transitioning to the Canadian Overnight Repo Rate Average (CORRA). This tranche was repaid in November 2024.On June 13, 2024, following new credit ratings for Videotron in May 2024, all liens on Videotron’s assets granted to the bank lenders were terminated and the related debt instruments (including derivatives) are now unsecured.On May 6, 2024, S&P Global Ratings upgraded Videotron’s unsecured debt from BB+ to BBB‑ with a stable outlook. On May 30, 2024, Moody’s Ratings upgraded Videotron’s unsecured debt from Ba2 to Baa3 with a stable outlook.
Capital stock
Repurchase of shares
On August 7, 2024, the Board of Directors of the Corporation authorized a normal course issuer bid for a maximum of 1,000,000 Class A Shares representing approximately 1.3% of issued and outstanding Class A Shares, and for a maximum of 5,000,000 Class B Shares representing approximately 3.2% of issued and outstanding Class B Shares as of August 1, 2024. The purchases can be made from August 15, 2024 to August 14, 2025, at prevailing market prices on the open market through the facilities of the Toronto Stock Exchange (“TSX”) or other alternative trading systems in Canada. All shares purchased under the bid will be cancelled.
On August 9, 2024, the Corporation entered into an automatic securities purchase plan (“the plan”) with a designated broker whereby shares may be repurchased under the plan at times when such purchases would otherwise be prohibited pursuant to regulatory restrictions or self‑imposed blackout periods. The plan received prior approval from the Toronto Stock Exchange. It came into effect on August 15, 2024 and will terminate on the same date as the normal course issuer bid.
Under the plan, before entering a self‑imposed blackout period, the Corporation may, but is not required to, ask the designated broker to make purchases under the normal course issuer bid. Such purchases shall be made at the discretion of the designated broker, within parameters established by the Corporation prior to the blackout periods. Outside the blackout periods, purchases will be made at the discretion of the Corporation’s management.
In 2024, the Corporation purchased and cancelled 3,619,092 Class B Shares for a total cash consideration of $114.7 million (260,500 Class B Shares for a total cash consideration of $7.8 million in 2023).
Share issuance
On June 25, 2024, the Corporation redeemed all its outstanding 4.0% convertible debentures for a total aggregate principal amount of $150.0 million. Pursuant to the terms of the debentures, the Corporation elected to settle the redemption in shares and consequently issued and delivered 5,161,237 Class B Shares to the holders.
Dividends
On February 26, 2025, the Board of Directors of Quebecor declared a quarterly dividend of $0.35 per share on its Class A Shares and Class B Shares, payable on April 8, 2025 to shareholders of record as of the record date of March 14, 2025. This dividend is designated an eligible dividend, as provided under subsection 89(14) of the Canadian Income Tax Act and its provincial counterpart.
Acquisition
On April 3, 2023, Videotron acquired Freedom from Shaw Communications Inc. Videotron paid $2.07 billion in cash and assumed certain liabilities, mainly lease obligations. The acquisition included the Freedom brand’s entire wireless and Internet customer base, as well as its owned infrastructure, spectrum and retail outlets.
Spectrum licences
On May 29, 2024, Videotron acquired 305 blocks of spectrum in the 3800 MHz band across the country for a total price of $298.9 million (of which $59.8 million was paid in January 2024 and $239.1 million in May 2024). Approximately 61% of the 305 blocks of wireless spectrum are located outside Québec, mainly in southern Ontario, Alberta and British Columbia.
Detailed financial information
For a detailed analysis of Quebecor’s fourth quarter and full‑year 2024 results, please refer to the Management Discussion and Analysis and condensed consolidated financial statements of Quebecor, available on the Corporation’s website at www.quebecor.com/en/investors/financial-documentation and the SEDAR+ website at www.sedarplus.ca.
Conference call for investors and webcast
Quebecor will hold a conference call to discuss its fourth quarter and full‑year 2024 results on February 27, 2025 at 11:00 a.m. EST. There will be a question period reserved for financial analysts. To access the conference call, please dial 1‑877‑293‑8052, access code for participants 27370#. The conference call will also be broadcast live on Quebecor’s website at www.quebecor.com/en/investors/conferences‑and‑annual‑meeting. It is advisable to ensure the appropriate software is installed before accessing the call. Instructions and links to free player downloads are available at the Internet address shown above. Anyone unable to attend the conference call will be able to listen to a recording by dialing 1‑877‑293‑8133, access code 27370#, recording access code 27370#. The recording will be available until May 29, 2025.
Cautionary statement regarding forward‑looking statements
The statements in this press release that are not historical facts are forward‑looking statements and are subject to significant known and unknown risks, uncertainties and assumptions that could cause Quebecor’s actual results for future periods to differ materially from those set forth in forward‑looking statements. Forward‑looking statements may be identified by the use of the conditional or by forward‑looking terminology such as the terms “plans,” “expects,” “may,” “anticipates,” “intends,” “estimates,” “projects,” “seeks,” “believes,” or similar terms, variations of such terms or the negative of such terms. Some important factors that could cause actual results to differ materially from those expressed in these forward‑looking statements include, but are not limited to:
Quebecor’s ability to continue successfully developing its network and the facilities that support its mobile services;general economic climate, financial and economic market conditions, global business challenges, such as tariffs and trade barriers, as well as market conditions and variations in the businesses of local, regional and national advertisers in Quebecor’s newspapers, television outlets and other media properties;Quebecor’s ability to implement its business and growth strategies successfully;the intensity of competitive activity in the industries in which Quebecor operates and its ability to penetrate new markets and successfully develop its business, including in growth sectors and new geographies;fragmentation of the media landscape and its impact on the advertising market and the media properties of Quebecor;new technologies that might change consumer behaviour with respect to Quebecor’s product suites;unanticipated higher capital spending required for developing Quebecor’s network or to address the continued development of competitive alternative technologies, or the inability to obtain additional capital to continue the development of Quebecor’s business segments;risks relating to the ongoing integration of Freedom, acquired in 2023, which could result in additional and unforeseen expenses, capital expenditures and financial risks, such as the incurrence of unexpected write‑offs, unanticipated or unknown liabilities, or unforeseen litigation. In addition, the anticipated benefits of the Freedom acquisition may not be fully realized or could take longer to realize than expected;the impacts of the significant and recurring investments that will be required for development and expansion and to compete effectively with the incumbent local exchange carriers (ILECs) and other current or potential competitors in the Telecommunications segment’s target markets;disruptions to the network through which Quebecor provides its television, Internet access, mobile and wireline telephony and over-the-top (OTT) services, and its ability to protect such services against piracy, unauthorized access and other security breaches;labour disputes and strikes, service interruptions resulting from equipment breakdown, network failure, the threat of natural disasters, epidemics, public‑health crises and political instability in some countries;impacts related to environmental issues, cybersecurity and the protection of personal information;changes in Quebecor’s ability to obtain services and equipment critical to its operations;changes in laws and regulations, or in their interpretations, which could result, among other things, in increased competition, changes in Quebecor’s markets, increased operating expenses, capital expenditures or tax expenses, or a reduction in the value of some assets; andQuebecor’s substantial indebtedness, interest rate and exchange rate fluctuations, the tightening of credit markets and the restrictions on its business imposed by the terms of its debt.
The forward‑looking statements in this document are made to provide investors and the public with a better understanding of the Corporation’s circumstances and are based on assumptions it believes to be reasonable as of the day on which they are made. Investors and others are cautioned that the foregoing list of factors that may affect future results is not exhaustive and that undue reliance should not be placed on any forward‑looking statements. For more information on the risks, uncertainties and assumptions that could cause Quebecor’s actual results to differ from current expectations, please refer to Quebecor’s public filings, available at www.sedarplus.ca and www.quebecor.com, including, in particular, the “Trend Information,” “Risks and Uncertainties” and “Financial Instruments and Financial Risk Management” sections of the Corporation’s Management Discussion and Analysis for the year ended December 31, 2024.
The forward‑looking statements in this press release reflect the Corporation’s expectations as of February 27, 2025 and are subject to change after this date. The Corporation expressly disclaims any obligation or intention to update or revise any forward‑looking statements, whether as a result of new information, future events or otherwise, except as required by applicable securities laws.
About Quebecor
Quebecor, a Canadian leader in telecommunications, entertainment, news media and culture, is one of the best‑performing integrated communications companies in the industry. Driven by their determination to deliver the best possible customer experience, all of Quebecor’s subsidiaries and brands are differentiated by their high‑quality, multiplatform, convergent products and services.
Quebecor (TSX: QBR.A, QBR.B) is headquartered in Québec and employs more than 11,000 people in Canada.
A family business founded in 1950, Quebecor is strongly committed to the community. Every year, it actively supports more than 400 organizations in the vital fields of culture, health, education, the environment, and entrepreneurship.
Visit our website: www.quebecor.com
Follow us on X: www.x.com/Quebecor
DEFINITIONS
Adjusted EBITDA
In its analysis of operating results, the Corporation defines adjusted EBITDA, as reconciled to net income under IFRS, as net income before depreciation and amortization, financial expenses, gain (loss) on valuation and translation of financial instruments, restructuring, impairment of assets and other, and income taxes. Adjusted EBITDA as defined above is not a measure of results that is consistent with IFRS. It is not intended to be regarded as an alternative to IFRS financial performance measures or to the statement of cash flows as a measure of liquidity. This measure should not be considered in isolation or as a substitute for other performance measures prepared in accordance with IFRS. The Corporation’s management and Board of Directors use this measure in evaluating its consolidated results as well as the results of the Corporation’s operating segments. This measure eliminates the significant level of impairment and depreciation/amortization of tangible and intangible assets and is unaffected by the capital structure or investment activities of the Corporation and its business segments.
Adjusted EBITDA is also relevant because it is a component of the Corporation’s annual incentive compensation programs. A limitation of this measure, however, is that it does not reflect the capital expenditures and acquisitions of spectrum licences needed to generate revenues in the Corporation’s segments. The Corporation also uses other measures that do reflect capital expenditures, such as adjusted cash flows from operations and free cash flows from operating activities. The Corporation’s definition of adjusted EBITDA may not be the same as similarly titled measures reported by other companies.
Table 2 provides a reconciliation of adjusted EBITDA to net income as disclosed in Quebecor’s consolidated financial statements. The consolidated financial information for the three‑month periods ended December 31, 2024 and 2023 presented in Table 2 below is drawn from the Corporation’s unaudited quarterly consolidated financial statements.
Table 2
Reconciliation of the adjusted EBITDA measure used in this press release to the net income measure used in the consolidated financial statements
(in millions of Canadian dollars)
Years ended
December 31
Three months ended
December 31
2024
2023
2022
2024
2023
Adjusted EBITDA (negative adjusted EBITDA):
Telecommunications
$
2,335.4
$
2,230.3
$
1,912.9
$
565.9
$
559.0
Media
31.9
7.7
25.0
15.0
13.6
Sports and Entertainment
27.4
23.0
19.4
10.8
2.2
Head Office
(27.2)
(23.2)
(22.8)
(2.7)
(9.4)
2,367.5
2,237.8
1,934.5
589.0
565.4
Depreciation and amortization
(943.3)
(909.0)
(767.7)
(236.6)
(231.1)
Financial expenses
(414.1)
(408.4)
(323.0)
(96.5)
(107.0)
Gain (loss) on valuation and translation of financial
instruments
15.5
(5.0)
(19.2)
–
(8.7)
Restructuring, impairment of assets and other
(27.4)
(52.4)
(14.5)
(13.1)
(23.5)
Income taxes
(256.7)
(227.9)
(213.4)
(65.4)
(53.9)
Net income
$
741.5
$
635.1
$
596.7
$
177.4
$
141.2
Adjusted income from operating activities
The Corporation defines adjusted income from operating activities, as reconciled to net income attributable to shareholders under IFRS, as net income attributable to shareholders before the gain (loss) on valuation and translation of financial instruments, and restructuring, impairment of assets and other, net of income tax related to adjustments and net income attributable to non‑controlling interest related to adjustments. Adjusted income from operating activities, as defined above, is not a measure of results that is consistent with IFRS. It should not be considered in isolation or as a substitute for measures of performance prepared in accordance with IFRS. The Corporation uses adjusted income from operating activities to analyze trends in the performance of its businesses. The above‑listed items are excluded from the calculation of this measure because they impair the comparability of financial results. Adjusted income from operating activities is more representative for forecasting income. The Corporation’s definition of adjusted income from operating activities may not be identical to similarly titled measures reported by other companies.
Table 3 provides a reconciliation of adjusted income from operating activities to the net income attributable to shareholders measure used in Quebecor’s consolidated financial statements. The consolidated financial information for the three‑month periods ended December 31, 2024 and 2023 presented in Table 3 below is drawn from the Corporation’s unaudited quarterly consolidated financial statements.
Table 3
Reconciliation of the adjusted income from operating activities measure used in this press release to the net income attributable to shareholders measure used in the consolidated financial statements
(in millions of Canadian dollars)
Years ended
December 31
Three months ended
December 31
2024
2023
2022
2024
2023
Adjusted income from operating activities
$
747.0
$
688.1
$
624.8
$
186.6
$
167.5
Gain (loss) on valuation and translation of
financial instruments
15.5
(5.0)
(19.2)
–
(8.7)
Restructuring, impairment of assets and other
(27.4)
(52.4)
(14.5)
(13.1)
(23.5)
Income taxes related to adjustments1
9.4
12.7
8.6
4.2
6.3
Non‑controlling interest related to adjustments
3.0
7.1
–
–
4.6
Net income attributable to shareholders
$
747.5
$
650.5
$
599.7
$
177.7
$
146.2
1 Includes impact of fluctuations in income tax applicable to adjusted items, either for statutory reasons or in connection with tax transactions.
Adjusted cash flows from operations and free cash flows from operating activities
Adjusted cash flows from operations
Adjusted cash flows from operations represents adjusted EBITDA less capital expenditures (excluding spectrum licence acquisitions). Adjusted cash flows from operations represents funds available for interest and income tax payments, expenditures related to restructuring programs, business acquisitions, acquisitions of spectrum licences, payment of dividends, repayment of long‑term debt and lease liabilities, and share repurchases. Adjusted cash flows from operations is not a measure of liquidity that is consistent with IFRS. It is not intended to be regarded as an alternative to IFRS financial performance measures or to the statement of cash flows as a measure of liquidity. Adjusted cash flows from operations is used by the Corporation’s management and Board of Directors to evaluate the cash flows generated by the operations of all of its segments, on a consolidated basis, in addition to the operating cash flows generated by each segment. Adjusted cash flows from operations is also relevant because it is a component of the Corporation’s annual incentive compensation programs. The Corporation’s definition of adjusted cash flows from operations may not be identical to similarly titled measures reported by other companies.
Free cash flows from operating activities
Free cash flows from operating activities represents cash flows provided by operating activities calculated in accordance with IFRS, less cash flows used for capital expenditures (excluding spectrum licence acquisitions), plus proceeds from disposal of assets. Free cash flows from operating activities is used by the Corporation’s management and Board of Directors to evaluate cash flows generated by the Corporation’s operations. Free cash flows from operating activities represents available funds for business acquisitions, acquisitions of spectrum licences, payment of dividends, repayment of long‑term debt and lease liabilities, and share repurchases. Free cash flows from operating activities is not a measure of liquidity that is consistent with IFRS. It is not intended to be regarded as an alternative to IFRS financial performance measures or to the statement of cash flows as a measure of liquidity. The Corporation’s definition of free cash flows from operating activities may not be identical to similarly titled measures reported by other companies.
Tables 4 and 5 provide a reconciliation of adjusted cash flows from operations and free cash flows from operating activities to cash flows provided by operating activities reported in the consolidated financial statements. The consolidated financial information for the three‑month periods ended December 31, 2024 and 2023 presented in Tables 4 and 5 is drawn from the Corporation’s unaudited quarterly consolidated financial statements.
Table 4
Adjusted cash flows from operations
(in millions of Canadian dollars)
Years ended
December 31
Three months ended
December 31
2024
2023
2022
2024
2023
Adjusted EBITDA (negative adjusted EBITDA)
Telecommunications
$
2,335.4
$
2,230.3
$
1,912.9
$
565.9
$
559.0
Media
31.9
7.7
25.0
15.0
13.6
Sports and Entertainment
27.4
23.0
19.4
10.8
2.2
Head Office
(27.2)
(23.2)
(22.8)
(2.7)
(9.4)
2,367.5
2,237.8
1,934.5
589.0
565.4
Minus
Capital expenditures:1
Telecommunications
(579.1)
(536.7)
(457.1)
(135.3)
(160.4)
Media
(30.7)
(12.9)
(32.0)
(5.3)
(6.2)
Sports and Entertainment
(6.8)
(7.7)
(3.9)
(2.0)
(2.9)
Head Office
(0.6)
(1.1)
(1.9)
(0.1)
(0.2)
(617.2)
(558.4)
(494.9)
(142.7)
(169.7)
Adjusted cash flows from operations
Telecommunications
1,756.3
1,693.6
1,455.8
430.6
398.6
Media
1.2
(5.2)
(7.0)
9.7
7.4
Sports and Entertainment
20.6
15.3
15.5
8.8
(0.7)
Head Office
(27.8)
(24.3)
(24.7)
(2.8)
(9.6)
$
1,750.3
$
1,679.4
$
1,439.6
$
446.3
$
395.7
1 Reconciliation to cash flows used for capital
Years ended
December 31
Three months ended
December 31
expenditures as per consolidated financial statements
2024
2023
2022
2024
2023
Capital expenditures
$
(617.2)
$
(558.4)
$
(494.9)
$
(142.7)
$
(169.7)
Net variance in current operating items related to capital
expenditures (excluding government credits receivable for
large investment projects)
17.7
5.0
8.4
52.9
17.5
Cash flows used for capital expenditures
$
(599.5)
$
(553.4)
$
(486.5)
$
(89.8)
$
(152.2)
Table 5
Free cash flows from operating activities and cash flows provided by operating activities reported in the consolidated financial statements
(in millions of Canadian dollars)
Years ended
December 31
Three months ended
December 31
2024
2023
2022
2024
2023
Adjusted cash flows from operations from Table 4
$
1,750.3
$
1,679.4
$
1,439.6
$
446.3
$
395.7
Plus (minus)
Cash portion of financial expenses
(404.7)
(400.0)
(315.7)
(94.2)
(104.8)
Cash portion of restructuring, impairment of assets and other
(17.9)
(39.5)
(10.3)
(4.4)
(17.8)
Current income taxes
(248.9)
(221.2)
(276.7)
(46.8)
(40.4)
Other
2.2
(4.1)
1.0
(0.2)
(8.1)
Net change in non‑cash balances related to
operating activities
21.6
(109.1)
(63.1)
(50.7)
(57.7)
Net variance in current operating items related to
capital expenditures (excluding government credits
receivable for large investment projects)
17.7
5.0
8.4
52.9
17.5
Free cash flows from operating activities
1,120.3
910.5
783.2
302.9
184.4
Plus (minus)
Cash flows used for capital expenditures (excluding
spectrum license acquisitions)
599.5
553.4
486.5
89.8
152.2
Proceeds from disposal of assets
(0.8)
(1.7)
(7.0)
(0.3)
(0.9)
Cash flows provided by operating activities
$
1,719.0
$
1,462.2
$
1,262.7
$
392.4
$
335.7
Consolidated net debt leverage ratio
The consolidated net debt leverage ratio represents consolidated net debt, excluding convertible debentures, divided by the trailing 12‑month adjusted EBITDA. Consolidated net debt, excluding convertible debentures, represents total long‑term debt plus bank indebtedness, lease liabilities and liabilities related to derivative financial instruments, less assets related to derivative financial instruments and cash and cash equivalents. The consolidated net debt leverage ratio serves to evaluate the Corporation’s financial leverage and is used by management and the Board of Directors in decisions on the Corporation’s capital structure, including its financing strategy, and in managing debt maturity risks. The consolidated net debt leverage ratio excludes convertible debentures because, subject to certain conditions, those debentures can be repurchased at the Corporation’s discretion by issuing Quebecor Class B Shares. Consolidated net debt leverage ratio is not a measure established in accordance with IFRS. It is not intended to be used as an alternative to IFRS measures or the balance sheet to evaluate the Corporation’s financial position. The Corporation’s definition of consolidated net debt leverage ratio may not be identical to similarly titled measures reported by other companies.
Table 6 provides the calculation of consolidated net debt leverage ratio and the reconciliation to balance sheet items reported in Quebecor’s consolidated financial statements.
Table 6
Consolidated net debt leverage ratio
(in millions of Canadian dollars)
Dec. 31,
2024
Dec. 31,
2023
Dec. 31,
2022
Total long‑term debt1
$
7,619.7
$
7,668.2
$
6,517.7
Plus (minus)
Lease liabilities2
409.7
376.2
186.2
Bank indebtedness
6.7
9.6
10.1
Derivative financial instruments3
(141.2)
(110.8)
(520.3)
Cash and cash equivalents
(61.8)
(11.1)
(6.6)
Consolidated net debt excluding convertible debentures
7,833.1
7,932.1
6,187.1
Divided by:
Trailing 12‑month adjusted EBITDA4
$
2,367.5
$
2,337.1
$
1,934.5
Consolidated net debt leverage ratio4
3.31x
3.39x
3.20x
1
Excluding changes in the fair value of long‑term debt related to hedged interest rate risk and financing costs.
2
Current and long‑term liabilities.
3
Current and long‑term assets less long‑term liabilities.
4
On a pro forma basis as at December 31, 2023, using Freedom’s trailing 12‑month adjusted EBITDA.
Key performance indicator
Revenue‑generating unit
The Corporation uses RGU, an industry metric, as a key performance indicator. An RGU represents, as the case may be, subscriber connections to the mobile and wireline telephony services and subscriptions to the Internet access and television services. RGU is not a measurement that is consistent with IFRS and the Corporation’s definition and calculation of RGU may not be the same as identically titled measurements reported by other companies or published by public authorities.
QUEBECOR INC.
CONSOLIDATED STATEMENTS OF INCOME
(in millions of Canadian dollars, except for earnings per share data)
Three months ended
Twelve months ended
(unaudited)
December 31
December 31
2024
2023
2024
2023
Revenues
$
1,499.0
$
1,504.8
$
5,638.4
$
5,434.3
Employee costs
180.5
198.2
752.0
755.5
Purchase of goods and services
729.5
741.2
2,518.9
2,441.0
Depreciation and amortization
236.6
231.1
943.3
909.0
Financial expenses
96.5
107.0
414.1
408.4
Loss (gain) on valuation and translation of financial instruments
–
8.7
(15.5)
5.0
Restructuring, impairment of assets and other
13.1
23.5
27.4
52.4
Income before income taxes
242.8
195.1
998.2
863.0
Income taxes (recovery):
Current
46.8
40.4
248.9
221.2
Deferred
18.6
13.5
7.8
6.7
65.4
53.9
256.7
227.9
Net income
$
177.4
$
141.2
$
741.5
$
635.1
Net income (loss) attributable to
Shareholders
$
177.7
$
146.2
$
747.5
$
650.5
Non-controlling interests
(0.3)
(5.0)
(6.0)
(15.4)
Earnings per share attributable to shareholders
Basic
$
0.76
$
0.63
$
3.23
$
2.82
Diluted
0.76
0.63
3.23
2.80
Weighted average number of shares outstanding (in millions)
232.9
230.7
231.6
230.9
Weighted average number of diluted shares (in millions)
233.5
230.9
232.1
236.2
QUEBECOR INC.
CONSOLIDATED STATEMENTS OF COMPREHENSIVE INCOME
(in millions of Canadian dollars)
Three months ended
Twelve months ended
(unaudited)
December 31
December 31
2024
2023
2024
2023
Net income
$
177.4
$
141.2
$
741.5
$
635.1
Other comprehensive (loss) income:
Items that may be reclassified to income:
Cash flow hedges:
(Loss) gain on valuation of derivative financial instruments
(55.2)
(42.4)
(76.2)
5.4
Deferred income taxes
(0.2)
10.4
4.4
0.5
Gain (loss) on translation of investments in foreign associates
0.7
(1.4)
(1.9)
(11.3)
Items that will not be reclassified to income:
Defined benefit plans:
Re-measurement (loss) gain
(19.7)
16.9
38.3
16.9
Deferred income taxes
5.1
(4.5)
(10.1)
(4.5)
Equity investment:
Loss on revaluation of an equity investment
(2.7)
(2.8)
(2.8)
(2.7)
Deferred income taxes
0.4
0.3
0.4
0.3
(71.6)
(23.5)
(47.9)
4.6
Comprehensive income
$
105.8
$
117.7
$
693.6
$
639.7
Comprehensive income (loss) attributable to
Shareholders
$
107.4
$
122.1
$
696.7
$
654.5
Non-controlling interests
(1.6)
(4.4)
(3.1)
(14.8)
QUEBECOR INC.
SEGMENTED INFORMATION
(in millions of Canadian dollars)
(unaudited)
Three months ended December 31, 2024
Sports
Head
and
office
Telecommuni-
Enter-
and Inter-
cations
Media
tainment
segments
Total
Revenues
$
1,265.5
$
194.7
$
69.2
$
(30.4)
$
1,499.0
Employee costs
124.1
40.1
11.0
5.3
180.5
Purchase of goods and services
575.5
139.6
47.4
(33.0)
729.5
Adjusted EBITDA1
565.9
15.0
10.8
(2.7)
589.0
Depreciation and amortization
236.6
Financial expenses
96.5
Restructuring, impairment of assets and other
13.1
Income before income taxes
$
242.8
Cash flows used for capital expenditures
$
82.9
$
4.5
$
2.2
$
0.2
$
89.8
Three months ended December 31, 2023
Sports
Head
and
office
Telecommuni-
Enter-
and Inter-
cations
Media
tainment
segments
Total
Revenues
$
1,297.7
$
204.8
$
56.4
$
(54.1)
$
1,504.8
Employee costs
125.1
50.6
11.4
11.1
198.2
Purchase of goods and services
613.6
140.6
42.8
(55.8)
741.2
Adjusted EBITDA1
559.0
13.6
2.2
(9.4)
565.4
Depreciation and amortization
231.1
Financial expenses
107.0
Loss on valuation and translation of financial instruments
8.7
Restructuring, impairment of assets and other
23.5
Income before income taxes
$
195.1
Cash flows used for capital expenditures
$
146.7
$
2.6
$
2.8
$
0.1
$
152.2
QUEBECOR INC.
SEGMENTED INFORMATION (continued)
(in millions of Canadian dollars)
(unaudited)
Twelve months ended December 31, 2024
Sports
Head
and
office
Telecommuni-
Enter-
and Inter-
cations
Media
tainment
segments
Total
Revenues
$
4,835.1
$
703.0
$
225.3
$
(125.0)
$
5,638.4
Employee costs
490.8
174.8
45.3
41.1
752.0
Purchase of goods and services
2,008.9
496.3
152.6
(138.9)
2,518.9
Adjusted EBITDA1
2,335.4
31.9
27.4
(27.2)
2,367.5
Depreciation and amortization
943.3
Financial expenses
414.1
Gain on valuation and translation of financial instruments
(15.5)
Restructuring, impairment of assets and other
27.4
Income before income taxes
$
998.2
Cash flows used for capital expenditures
$
565.6
$
26.2
$
7.0
$
0.7
$
599.5
Acquisition of spectrum licences
298.9
–
–
–
298.9
Twelve months ended December 31, 2023
Sports
Head
and
office
Telecommuni-
Enter-
and Inter-
cations
Media
tainment
segments
Total
Revenues
$
4,654.0
$
721.9
$
213.4
$
(155.0)
$
5,434.3
Employee costs
472.3
206.0
44.5
32.7
755.5
Purchase of goods and services
1,951.4
508.2
145.9
(164.5)
2,441.0
Adjusted EBITDA1
2,230.3
7.7
23.0
(23.2)
2,237.8
Depreciation and amortization
909.0
Financial expenses
408.4
Loss on valuation and translation of financial instruments
5.0
Restructuring, impairment of assets and other
52.4
Income before income taxes
$
863.0
Cash flows used for capital expenditures
$
536.0
$
9.4
$
7.3
$
0.7
$
553.4
Acquisition of spectrum licences
9.9
–
–
–
9.9
1
The Chief Executive Officer uses adjusted EBITDA as the measure of profit to assess the performance of each segment. Adjusted EBITDA is a non-IFRS measure and is defined as net income before depreciation and amortization, financial expenses, loss (gain) on valuation and translation of financial instruments, restructuring, impairment of assets and other and income taxes.
QUEBECOR INC.
CONSOLIDATED STATEMENTS OF EQUITY
(in millions of Canadian dollars)
(unaudited)
Equity attributable to shareholders
Equity
Accumulated
attributable
other com-
to non-
Capital
Contributed
Retained
prehensive
controlling
Total
stock
surplus
earnings
income (loss)
interests
equity
Balance as of December 31, 2022
$
916.2
$
17.4
$
421.9
$
1.8
$
126.2
$
1,483.5
Net income (loss)
–
–
650.5
–
(15.4)
635.1
Other comprehensive income
–
–
–
4.0
0.6
4.6
Dividends
–
–
(277.1)
–
(0.2)
(277.3)
Repurchase of Class B Shares
(1.6)
–
(6.2)
–
–
(7.8)
Business disposal
–
–
–
–
(0.4)
(0.4)
Balance as of December 31, 2023
914.6
17.4
789.1
5.8
110.8
1,837.7
Net income (loss)
–
–
747.5
–
(6.0)
741.5
Other comprehensive (loss) income
–
–
–
(50.8)
2.9
(47.9)
Dividends
–
–
(301.7)
–
(0.2)
(301.9)
Repurchase of Class B Shares
(23.4)
–
(91.3)
–
–
(114.7)
Issuance of Class B Shares
150.0
–
–
–
–
150.0
Balance as of December 31, 2024
$
1,041.2
$
17.4
$
1,143.6
$
(45.0)
$
107.5
$
2,264.7
QUEBECOR INC.
CONSOLIDATED STATEMENTS OF CASH FLOWS
(in millions of Canadian dollars)
Three months ended
Twelve months ended
(unaudited)
December 31
December 31
2024
2023
2024
2023
Cash flows related to operating activities
Net income
$
177.4
$
141.2
$
741.5
$
635.1
Adjustments for:
Depreciation of property, plant and equipment
141.4
141.2
564.7
582.2
Amortization of intangible assets
63.0
60.5
253.1
226.7
Depreciation of right-of-use assets
32.2
29.4
125.5
100.1
Loss (gain) on valuation and translation of financial instruments
–
8.7
(15.5)
5.0
Impairment of assets
11.8
0.5
23.6
8.5
Amortization of financing costs
2.3
2.2
9.4
8.4
Deferred income taxes
18.6
13.5
7.8
6.7
Other
(3.6)
(3.8)
(12.7)
(1.4)
443.1
393.4
1,697.4
1,571.3
Net change in non-cash balances related to operating activities
(50.7)
(57.7)
21.6
(109.1)
Cash flows provided by operating activities
392.4
335.7
1,719.0
1,462.2
Cash flows related to investing activities
Capital expenditures
(89.8)
(152.2)
(599.5)
(553.4)
Deferred subsidies (used) received to finance
capital expenditures
(2.8)
–
34.2
(39.3)
Acquisitions of spectrum licences
–
–
(298.9)
(9.9)
Business acquisition
(16.9)
–
(23.9)
(2,069.6)
Proceeds from disposals of assets
0.3
0.9
0.8
1.7
Acquisitions of investments and other
(1.6)
(0.3)
(34.6)
(7.0)
Cash flows used in investing activities
(110.8)
(151.6)
(921.9)
(2,677.5)
Cash flows related to financing activities
Net change in bank indebtedness
(5.9)
(13.0)
(2.9)
(0.5)
Net change under revolving facilities, net of financing costs
(6.2)
(84.0)
(387.0)
299.0
Issuance of long-term debt, net of financing costs
964.6
–
1,957.2
2,092.5
Repayment of long-term debt
(1,075.0)
–
(1,900.3)
(1,138.1)
Settlement of hedging contracts
–
–
163.0
307.2
Repayment of lease liabilities
(32.9)
(31.1)
(125.6)
(94.5)
Repurchase of Class B Shares
(45.9)
(0.7)
(114.7)
(7.8)
Dividends
(75.7)
(69.3)
(301.9)
(277.3)
Cash flows (used in) provided by financing activities
(277.0)
(198.1)
(712.2)
1,180.5
Net change in cash, cash equivalents and restricted cash
4.6
(14.0)
84.9
(34.8)
Cash, cash equivalents and restricted cash at beginning of period
91.4
25.1
11.1
45.9
Cash, cash equivalents and restricted cash at end of period
$
96.0
$
11.1
$
96.0
$
11.1
QUEBECOR INC.
CONSOLIDATED BALANCE SHEETS
(in millions of Canadian dollars)
(unaudited)
December 31
December 31
2024
2023
Assets
Current assets
Cash and cash equivalents
$
61.8
$
11.1
Restricted cash
34.2
–
Accounts receivable
1,208.9
1,175.1
Contract assets
139.6
125.4
Income taxes
32.6
49.0
Inventories
440.1
512.1
Derivative financial instruments
–
129.3
Other current assets
185.1
192.3
2,102.3
2,194.3
Non-current assets
Property, plant and equipment
3,302.7
3,417.9
Intangible assets
3,486.9
3,385.1
Right-of-use assets
376.7
340.8
Goodwill
2,713.4
2,721.2
Derivative financial instruments
148.4
35.8
Deferred income taxes
24.7
23.4
Other assets
843.6
622.8
10,896.4
10,547.0
Total assets
$
12,998.7
$
12,741.3
Liabilities and equity
Current liabilities
Bank indebtedness
$
6.7
$
9.6
Accounts payable, accrued charges and provisions
1,167.0
1,185.9
Deferred revenue
376.7
370.6
Deferred subsidies
34.2
–
Income taxes
46.5
24.7
Convertible debentures
–
150.0
Current portion of long-term debt
400.0
1,480.6
Current portion of lease liabilities
107.2
98.5
2,138.3
3,319.9
Non-current liabilities
Long-term debt
7,182.2
6,151.8
Lease liabilities
302.5
277.7
Derivative financial instruments
7.2
54.3
Deferred income taxes
814.7
809.7
Other liabilities
289.1
290.2
8,595.7
7,583.7
Equity
Capital stock
1,041.2
914.6
Contributed surplus
17.4
17.4
Retained earnings
1,143.6
789.1
Accumulated other comprehensive (loss) income
(45.0)
5.8
Equity attributable to shareholders
2,157.2
1,726.9
Non-controlling interests
107.5
110.8
2,264.7
1,837.7
Total liabilities and equity
$
12,998.7
$
12,741.3
View original content:https://www.prnewswire.com/news-releases/quebecor-inc-reports-consolidated-results-for-fourth-quarter-and-full-year-2024-302386657.html
SOURCE Quebecor Inc.

You may like
Technology
DataOne Adds Massachusetts Registration and Sales Data to Cross-Sell Reports for Auto Dealers, Expanding State Coverage to 40 States
Published
57 minutes agoon
October 19, 2026By
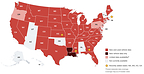
BEVERLY, Mass., Oct. 19, 2026 /PRNewswire/ — DataOne Software, a Dominion Enterprises company and a leading provider of automotive data and software solutions, today announced the availability of Massachusetts vehicle registration and sales data within its Cross-Sell Reports market intelligence solutions for dealers. Cross-Sell Reports, including the Cross-Sell Interactive web interface, provide auto dealers with unparalleled insight into local market trends, giving them a competitive edge in reaching new customers and expanding market share. The addition of Massachusetts data to Cross-Sell Reports expands coverage to 40 states.
“As of today, Massachusetts dealers can now access a current, accurate view of new and used vehicle transactions within their market area,” explains David Wall, DataOne head of Cross-Sell Reports. “Localized data, in easy-to-interpret views, are an incredible advantage to dealers who want to spot trends early and make decisions based on accurate market intelligence. We are thrilled to be bringing this capability not only to Massachusetts dealers but also to dealerships in other New England states whose target markets cross into Massachusetts.”
On average, over 3.8 million vehicle transactions are processed monthly for inclusion in Cross-Sell Reports, covering new and used dealer transactions across 40 states, all sourced from official state DMV records. Each dealer subscription is configured to the dealer’s unique market area and provides:
Competitive market share analysis by dealership, make, and modelZIP code-level heat mapping to identify buyer activity and emerging marketsInventory trend analysis to inform stocking decisions by segment and seasonInteractive dashboards with drill-down reporting — no analytics infrastructure required
“We know dealers trust Cross-Sell Reports for critical market insight, and for those insights to be delivered with industry-leading speed and timeliness,” says Jake Maki, DataOne President. “With the addition of Massachusetts state coverage, we continue to expand our coverage providing more dealers with the most immediate, accurate market intelligence available.”
Since welcoming the Cross-Sell brand into DataOne earlier this year, DataOne has accelerated efforts to expand state coverage of vehicle registration and sales data. In addition to Massachusetts, Cross-Sell Reports recently added Mississippi, Kansas and Georgia to its coverage.
“Our goal is to make DataOne the most accurate and comprehensive source of vehicle registration and sales data, however customers choose to use it,” says Maki. “For a dealer, that might be a Cross-Sell Interactive dashboard tuned to their local market. For other customers looking to license the data, it might be multi-state data integrated directly into their own platforms. Every new state we add makes both more valuable.”
In addition to Cross-Sell Reports and Cross-Sell Interactive, DataOne offers Vehicle Registration and Sales Data for licensing via API or FTP data feed, with coverage configurable by state or region.
For general information about DataOne solutions, contact DataOne at 877.438.8467, e-mail sales@dataonesoftware.com or visit dataonesoftware.com. For specific information about Cross-Sell Reports or Cross-Sell Interactive for dealers, visit Cross-Sell Reports.
About DataOne Software
DataOne Software (www.dataonesoftware.com) is a premier automotive data source providing the data and software solutions needed to power modern businesses across all segments of the automotive industry. DataOne’s comprehensive data solutions cover everything from VIN decoding and vehicle descriptions to specifications, optional equipment, and market pricing. With the acquisition of Cross-Sell in 2026, DataOne has expanded our product offering to include PII-free vehicle sales and registration data. Our high-quality solutions are delivered with industry-leading support, making them easy to integrate and scale.
Media Contact
Alice Fackre, Product and Brand Marketing Manager
Email: alice.fackre@dataonesoftware.com
Phone: (978) 473-9097
View original content to download multimedia:https://www.prnewswire.com/news-releases/dataone-adds-massachusetts-registration-and-sales-data-to-cross-sell-reports-for-auto-dealers-expanding-state-coverage-to-40-states-302911528.html
SOURCE DataOne Software
Technology
DR. PHONE FIX ENTERS DEVICE LIFECYCLE AND FULFILLMENT MOU WITH GEO NOVA SCOTIA
Published
57 minutes agoon
October 19, 2026By

Agreement expands Dr. Phone Fix’s institutional platform through device procurement, triage, repair, refurbishment, accessories and fulfillment services
EDMONTON, AB, Oct. 19, 2026 /CNW/ — Dr. Phone Fix Canada Corporation (TSXV: DPF) (“Dr. Phone Fix” or the “Company”), one of Canada’s fastest-growing and award-winning national consumer electronics lifecycle platforms, is pleased to announce that it has entered into a Memorandum of Understanding (“MOU”) with GEO Nova Scotia (“GEO” or “Getting Everyone Online”), a nonprofit organization focused on advancing digital inclusion across Nova Scotia.
Under the MOU, Dr. Phone Fix will provide a broad range of device lifecycle services supporting GEO’s programs, including device procurement and inventory management, donated-device triage, repair and refurbishment, device preparation, accessories, packaging, fulfillment, shipping, tracking and environmentally responsible disposition, with GEO’s approval, of devices that are uneconomical or impractical to repair.
The relationship builds on GEO’s digital inclusion programs across Nova Scotia. Since 2022, GEO has distributed more than 8,500 devices, including almost 3,500 refurbished mobile phones and iPads, and has provided more than 4,500 home internet and mobile phone connections to individuals who otherwise may not be able to afford them. GEO delivers its programs through a network of more than 125 partner agencies across the province.
“This relationship is a strong example of how the infrastructure we have built at Dr. Phone Fix can support customers well beyond the traditional retail environment,” said Piyush Sawhney, Founder and Chief Executive Officer of Dr. Phone Fix. “We can manage a broad range of device lifecycle services – from procurement and inventory management to assessment, repair, preparation and ultimately fulfillment to the end user. We believe this type of institutional relationship represents an important growth opportunity for Dr. Phone Fix as we continue expanding our capabilities across Canada.”
Under the commercial structure contemplated by the MOU, Dr. Phone Fix will generate revenue through the sale of devices to GEO, per-device processing services, accessories and approved repair and refurbishment work, where applicable. DPF will also maintain GEO-owned inventory and manage fulfillment and distribution of devices to GEO program participants and partner organizations.
Each device processed for fulfillment may include services and accessories such as protective cases, screen protection, charging cables and charging equipment, with DPF managing the preparation, packaging, shipment and associated tracking requirements.
Management believes these relationships can leverage DPF’s existing national infrastructure, supplier network, repair capabilities and centralized operating systems while creating incremental revenue streams across device procurement, repair, refurbishment, accessories and fulfillment.
About GEO Nova Scotia
GEO Nova Scotia, or Getting Everyone Online, is a nonprofit organization dedicated to advancing digital inclusion by helping ensure individuals have access to the devices, connectivity and basic skills required to participate in an increasingly digital economy. GEO works with public-sector, private-sector and community partners across Nova Scotia to support individuals facing barriers to digital access.
About Dr. Phone Fix
Dr. Phone Fix is an award-winning, eco-friendly, and customer-centric integrated device care platform providing repair, refurbishment, certified pre-owned devices, trade-in solutions, accessories and related services through its growing national retail network. Founded in 2019, the Company serves consumers and businesses across multiple Canadian markets, delivering convenient and reliable device care solutions through its corporately owned retail network. With a focus on operational execution, customer service and sustainability, Dr. Phone Fix continues to expand its national platform while supporting the repair, reuse and extension of the useful life of connected devices.
NEITHER THE TSXV NOR ITS REGULATION SERVICES PROVIDER (AS THAT TERM IS DEFINED IN THE POLICIES OF THE TSXV) ACCEPTS RESPONSIBILITY FOR THE ADEQUACY OR ACCURACY OF THIS NEWS RELEASE.
Cautionary Statement Regarding Forward-Looking Information
This news release contains “forward-looking information” within the meaning of applicable securities laws. Forward-looking information can be identified by words such as “intend”, “believe”, “estimate”, “expect”, “may”, “will”, “would”, “could”, “should”, “plans”, “anticipates” and similar references to future periods. Forward-looking information includes, but is not limited to, statements regarding the expected scope, scale and benefits of the Company’s relationship with GEO Nova Scotia; potential revenues from device sales, processing, repair, refurbishment, accessories and related services; the continued expansion of the Company’s institutional and enterprise business; and the Company’s ability to leverage its national operating platform to support additional device lifecycle programs. Forward-looking information is based on management’s current expectations, assumptions and estimates as of the date of this news release. The MOU does not guarantee any specific number of device purchases and does not specify a minimum processing volume, and actual volumes, revenues and profitability may differ materially from management’s expectations. Forward-looking information is subject to known and unknown risks, uncertainties and other factors that may cause actual results, performance or achievements to differ materially from those expressed or implied. These include, among others, changes in GEO’s program requirements or funding, actual device volumes, availability and condition of donated and purchased devices, supply chain and inventory availability, repair and fulfillment costs, operational execution, termination or modification of the MOU, competitive conditions and general economic and business conditions. Readers are cautioned not to place undue reliance on forward-looking information. The Company undertakes no obligation to update or revise any forward-looking information except as required by applicable law.
SOURCE Dr. Phone Fix
Technology
A Speed Cap Nobody Will Own Just Shook Up the Satellite Trade
Published
57 minutes agoon
October 19, 2026By

WASHINGTON, Oct. 19, 2026 /PRNewswire/ — USA News Group News Commentary – Ukrainian President Volodymyr Zelenskyy said on Saturday that tests showed Starlink-equipped drones lost their connection when flying faster than about 100 mph inside Ukraine, while Starlink terminals moving at more than 112 mph inside the European Union worked normally. “In other words, this is a planned operation,” he said. No one in Washington or at SpaceX has claimed the decision. Most U.S.-listed space stocks fell sharply last week, while Europe’s only low Earth orbit broadband rival to SpaceX had its best day in 16 months. Active Companies from around the markets with current developments this week include: Space Exploration Technologies Corp. (NASDAQ: SPCX), AST SpaceMobile, Inc. (NASDAQ: ASTS), Iridium Communications Inc. (NASDAQ: IRDM), Rocket Lab Corporation (NASDAQ: RKLB), Eutelsat Communications SA (Euronext Paris: ETL).
The restrictions reportedly cover both Starlink and Starshield, SpaceX’s military-use service, which Ukraine relies on for communications, logistics, live drone video and targeting. The Telegraph reported on Oct. 16, citing four unnamed sources, that Elon Musk approached President Trump with the idea of slowing Starlink in Ukraine and that Trump “agreed.” Musk said on X that speed or usage limits on Starshield “are decided by the US military and ultimately POTUS.” Trump told reporters, “it wasn’t me, and I don’t think it was Elon.”
Secretary of State Marco Rubio said on Saturday, “We had nothing to do with it. Nobody ordered that Starlink speed to be slowed down. It sorta happened.” He also said Starshield was not available to Ukraine, which Yahoo Finance noted conflicts with a late 2024 Pentagon contract that expanded Ukraine’s Starshield access from about 500 to roughly 3,000 terminals. Speaking on NBC’s Meet the Press on Sunday, Zelenskyy said, “Just give us back Starlink.”
Europe is paying close attention. The European Union is working to develop its own alternative to Starlink, and on Sunday the U.S. ambassador to the EU threatened “devastating” retaliation if the bloc advanced a proposal favoring EU-made satellites over companies like SpaceX, Yahoo Finance reported.
CONTINUED… Read this and more news for the space sector at: usanewsgroup.com
In other industry developments and happenings in the market this week include:
Space Exploration Technologies Corp. (NASDAQ: SPCX)
Shares of SpaceX fell 10.17% last week, from $162.57 at the Oct. 9 close to $146.03 on Oct. 16, according to Stock Analysis data, though they remain above the $135 price of the company’s June initial public offering. Starlink, a core part of SpaceX’s business, has more than 13 million subscribers worldwide, and Yahoo Finance noted this is the first throttling episode since the company went public.
SpaceX has limited service in Ukraine before. In 2023, President and COO Gwynne Shotwell acknowledged the company could restrict how Ukraine used Starlink, saying, “There are things that we can do, and have done.” Musk said on X last week that Starlink “is limited to civilian or defensive activities.”
AST SpaceMobile, Inc. (NASDAQ: ASTS)
AST SpaceMobile, which is building a space-based cellular broadband network that connects directly to standard smartphones, fell 20.23% last week, from $50.97 to $40.66. On Oct. 13, Piper Sandler downgraded the stock to Neutral from Overweight and cut its price target to $54 from $98, citing SpaceX’s direct-to-cell ambitions after its agreement to acquire Grain Management’s 800 MHz spectrum for about $8 billion, subject to regulatory approval.
Piper warned that SpaceX could, in theory, limit launch opportunities for competitors such as AST and pressure pricing by competing with telecom operators. Not every analyst agreed. Deutsche Bank upgraded the shares to Buy on Oct. 12 with a $93 target, and Clear Street reiterated a Buy rating with a $115 target, arguing AST is about six months ahead of SpaceX in direct-to-cell.
Iridium Communications Inc. (NASDAQ: IRDM)
Iridium announced on Oct. 14 that Altair Semiconductor is adding Iridium NTN Direct to its ALT1350 and ALT1550 cellular IoT chipsets, letting device makers, module makers and mobile network operators add satellite coverage without a separate satellite modem. “Iridium is offering device manufacturers a powerful new way to develop connected products,” said Tim Last, executive vice president at Iridium.
Iridium stockholders approved the company’s acquisition by Rocket Lab on Sept. 24, with about 99.6% of votes cast in favor. Each Iridium share is to be exchanged for $27.00 in cash plus Rocket Lab stock based on an exchange ratio subject to a collar, for a notional value of $54.00 per share, and the deal is expected to close by mid-2027, subject to remaining regulatory approvals. Iridium shares fell 7.82% last week, from $47.47 to $43.76.
Rocket Lab Corporation (NASDAQ: RKLB)
Rocket Lab shares fell 25.47% last week, from $68.21 to $50.84, after founder and CEO Sir Peter Beck said in a video posted to YouTube that the first launch of the company’s Neutron rocket would move from late 2026 into 2027. Inspectors found voids in the carbon-fiber layers of a recently made forward propellant dome after curing, according to Space.com.
Beck said the voids “don’t necessarily mean that the dome would fail in flight,” but added, “Possible success isn’t our standard.” Rocket Lab expects to finish a new forward dome by the end of the year and complete first-stage testing in the first quarter of 2027, after which Beck said the company expects to be “in good shape to share a new target launch date.”
Eutelsat Communications SA (Euronext Paris: ETL)
Eutelsat shares jumped 23% on Oct. 14, the stock’s biggest one-day gain in 16 months, Reuters reported, after Ukraine said Starlink had introduced restrictions on its military-grade service. Eutelsat’s OneWeb network has more than 600 satellites in low Earth orbit, compared with about 10,000 for Starlink, and it is the only company besides SpaceX providing space-based internet through a low Earth orbit network. Bernstein analyst Aleksander Peterc said the news put European providers “back in the spotlight as potential alternatives.”
Not everyone sees an easy swap. Existing Starlink users cannot simply switch to OneWeb, since a transition would require new terminals and supporting infrastructure, and independent consultant Christian Freiherr von der Ropp said “considering it as a straightforward substitute overlooks significant operational and infrastructure constraints.”
Space stocks swung hard on headlines last week. Learn to read the charts behind moves like these with the free Stock Preachers guide, plus The Roadmap market reports, at stockpreachers.com.
Contact Information:
usanewsgroup.com
Media Contact: info@usanewsgroup.com
DISCLAIMER: Nothing in this publication should be considered as personalized financial advice. We are not licensed under securities laws to address your particular financial situation. No communication by our employees to you should be deemed as personalized financial advice. Please consult a licensed financial advisor before making any investment decision. This is not a paid advertisement and is neither an offer nor recommendation to buy or sell any security. We hold no investment licenses and are thus neither licensed nor qualified to provide investment advice. The content in this report or email is not provided to any individual with a view toward their individual circumstances.
This article is independent news commentary. USA News Group is wholly owned and operated by Market Equities Limited (“MEL”), a company incorporated under the laws of Ireland. MEL has not been paid by any company mentioned in this article. MEL and its owners, operators, directors, and affiliates do not currently own any shares of the companies mentioned in this article, but reserve the right to, and will, buy and sell shares of those companies at any time without further notice. Weekly price changes are from the October 9, 2026 close to the October 16, 2026 close based on Stock Analysis data. Information is drawn from company news releases, published reporting and third-party data believed to be reliable, but its accuracy is not guaranteed. Investing in securities carries risk, including the loss of some or all of your investment. This document is governed by the laws of Ireland.
View original content to download multimedia:https://www.prnewswire.com/news-releases/a-speed-cap-nobody-will-own-just-shook-up-the-satellite-trade-302912322.html
SOURCE USA News Group


DataOne Adds Massachusetts Registration and Sales Data to Cross-Sell Reports for Auto Dealers, Expanding State Coverage to 40 States

DR. PHONE FIX ENTERS DEVICE LIFECYCLE AND FULFILLMENT MOU WITH GEO NOVA SCOTIA

A Speed Cap Nobody Will Own Just Shook Up the Satellite Trade

Send Rakhi to UK swiftly with UK Gifts Portal

Whiteboard Series with NEAR | Ep: 45 Joel Thorstensson from ceramic.network

Nullmax and Renesas Forge Strategic Partnership to Deliver Competitive ADAS Solutions for the Global Market

Why You Should Build on #NEAR – Co-founder Illia Polosukhin at CV Labs
Whiteboard Series with NEAR | Ep: 45 Joel Thorstensson from ceramic.network

NEAR End of Year Town Hall 2021: The Open Web World, MetaBUILD 2 Hackathon and 2021 recap
Trending
-

 Coin Market5 days ago
‘Bunker mode’ won’t protect your crypto, critics say
-

 Coin Market5 days ago
Organizations join forces to fight Illinois crypto tax, after 6-month pause
-

 Coin Market5 days ago
EU authority classifies Circle’s USDC as ‘significant’ under MiCA
-

 Technology5 days ago
Omega Point’s MCP Is Now Anthropic Verified in Claude’s Marketplace, Built To Compute
-

 Technology5 days ago
WIN Expands Executive Leadership Team Following Period of Rapid Growth
-

 Technology5 days ago
Rothschild Financial Partners Launches: A Partner-Owned RIA Built on a 1908 Foundation
-

 Technology5 days ago
Mapbox Launches 3D Live Navigation in Neue Klasse BMW Vehicles
-

 Technology5 days ago
Carrier Logistics and LSP44 Join Forces to Solve AI Bot Fatigue