
Technology
Baozun Announces Fourth Quarter and Fiscal Year 2024 Unaudited Financial Results
Published
1 year agoon
By
SHANGHAI, March 20, 2025 /PRNewswire/ — Baozun Inc. (Nasdaq: BZUN and HKEX: 9991) (“Baozun”, the “Company” or the “Group”), a leading brand e-commerce solution provider and digital commerce enabler in China, today announced its unaudited financial results for the fourth quarter and fiscal year ended December 31, 2024.
Mr. Vincent Qiu, Chairman and Chief Executive Officer of Baozun, commented, “I am pleased that Baozun’s three-year transformation continues with strong momentum, as both BEC and BBM segments return to topline growth alongside bottom-line improvements. In the fourth quarter of 2024, we achieved 8% year-over-year revenue growth and remarkable growth in operating profit. With technology as our backbone, we drive digital innovations and AI applications to enhance efficiency, streamline omni-channel operations, and improve content creation for sustainable growth. As 2025 marks the transformation’s culmination, we remain committed to accelerating this shift, fostering an entrepreneurial, innovative and customer-centric approach to drive quality growth.”
Ms. Catherine Zhu, Chief Financial Officer of Baozun Inc., commented, “Baozun delivered solid topline growth in the fourth quarter of 2024, with E-Commerce revenue increasing by 6% and Brand Management revenue accelerating by 17% year-over-year. While investing in our strategic initiatives, we have also implemented comprehensive measures to enhance efficiency and optimize costs. These efforts drove a 16% increase in adjusted operating profits for our BEC segment and reduced adjusted operating loss for our BBM segment by 20% for the quarter. With healthy cash reserves, a continuing focus on financial discipline and innovation in technology, we remain confident in sustaining long-term profitability and growth.”
Fourth Quarter 2024 Financial Highlights
Total net revenues were RMB2,994.4 million (US$[1] 410.2 million), representing an increase of 7.7% compared with RMB2,780.4 million in the same quarter of last year.Income from operations was RMB73.2 million (US$10.0 million), an improvement from RMB6.4 million in the same quarter of last year. Operating margin was 2.4%, improved from 0.2% for the same period of 2023.Non-GAAP income from operations[2] was RMB103.3 million (US$14.2 million), an improvement of 36.6% from RMB75.7 million in the same quarter of last year. Non-GAAP operating margin was 3.5%, improved from 2.7% for the same period of 2023.Adjusted operating profit of E-Commerce[3] was RMB137.4 million (US$18.8 million), an improvement of 16.3% from RMB118.2 million for the same period of 2023.Adjusted operating loss of Brand Management[3] narrowed to RMB34.2 million (US$4.7 million), an improvement of 19.7% from RMB42.5million for the same period of 2023.Net income attributable to ordinary shareholders of Baozun was RMB0.1 million (US$0.02 million), compared with net loss attributable to ordinary shareholders of Baozun was RMB48.4 million for the same period of 2023.Non-GAAP net income attributable to ordinary shareholders of Baozun[4] was RMB45.7 million (US$6.3 million), an improvement of 58.9% from RMB28.8 million for the same period of 2023. Basic and diluted net income attributable to ordinary shareholders of Baozun per American Depositary Share (“ADS[5]”) were both RMB0.00[6], compared with basic and diluted net loss attributable to ordinary shareholders of Baozun per American Depositary Share were both RMB0.80 for the same period of 2023.Diluted non-GAAP net income attributable to ordinary shareholders of Baozun per ADS[7] was RMB0.77 (US$0.11), compared with RMB0.47 for the same period of 2023.Cash and cash equivalents, restricted cash, and short-term investments totaled RMB2,915.9 million (US$399.5 million), as of December 31, 2024, compared with RMB3,072.8 million as of December 31, 2023.
Fiscal Year 2024 Financial Highlights
Total net revenues were RMB9,422.2 million (US$1,290.8million), representing an increase of 6.9% compared with RMB8,812.0 million in the fiscal year of 2023.Loss from operations was RMB114.8 million (US$15.7 million), improved from RMB206.4 million in the fiscal year of 2023. Operating margin was negative 1.2%, compared with negative 2.3% for the fiscal year of 2023.Non-GAAP income from operations was RMB10.6 million (US$1.5 million), compared with non-GAAP loss from operations RMB23.7 million for the fiscal year of 2023. Non-GAAP operating margin was 0.1%, compared with negative 0.3% for the fiscal year of 2023.Adjusted operating profit of E-Commerce was RMB179.6 million (US$24.6 million), an improvement of 9.5% from RMB164.0 million for the fiscal year of 2023.Adjusted operating loss of Brand Management narrowed to RMB168.8 million (US$23.1 million), an improvement of 10.1% from RMB187.7 million for the fiscal year of 2023.Net loss attributable to ordinary shareholders of Baozun was RMB185.2 million (US$25.4 million), improved from RMB278.4 million for the fiscal year of 2023.Non-GAAP net loss attributable to ordinary shareholders of Baozun was RMB40.4 million (US$5.5 million), improved from RMB65.1 million for the fiscal year of 2023.Basic and diluted net loss attributable to ordinary shareholders of Baozun per American Depositary Share (“ADS”) were both RMB3.09 (US$0.42), compared with both RMB4.68 for the fiscal year of 2023.Diluted non-GAAP net loss attributable to ordinary shareholders of Baozun per ADS was RMB0.67 (US$0.09), compared with RMB1.09 for the fiscal year of 2023.
Reconciliations of GAAP measures to non-GAAP measures presented above are included at the end of this results announcement.
Adjusted operating profits (losses) are included in the Segments data of Segment Information.
[1] This announcement contains translations of certain Renminbi (RMB) amounts into U.S. dollars (US$) at a specified rate solely for the convenience of the reader. Unless otherwise noted, the translation of RMB into US$ has been made at RMB7.2993 to US$1.00, the noon buying rate in effect on December 31, 2024 as set forth in the H.10 Statistical Release of the Federal Reserve Board.
[2] Non-GAAP income (loss) from operations is a non-GAAP financial measure, which is defined as income (loss) from operations excluding the impact of share-based compensation expenses, amortization of intangible assets resulting from business acquisition, acquisition-related expenses, impairment of goodwill and cancellation fees of repurchased ADSs.
[3] Following the acquisition of Gap Shanghai, the Group updated its operating segment structure resulting in two segments, which were (i) E-Commerce; (ii) Brand Management, for more information, please refer to Supplemental Information.
[4] Non-GAAP net income (loss) attributable to ordinary shareholders of Baozun is a non-GAAP financial measure, which is defined as net income (loss) attributable to ordinary shareholders of Baozun excluding the impact of share-based compensation expenses, amortization of intangible assets resulting from business acquisition, acquisition-related expenses, impairment of goodwill and investments, other-than-temporary impairment of equity method investments, cancellation fees of repurchased ADSs, fair value gain on derivative liabilities, gain on disposal/acquisition of subsidiaries, and unrealized investment loss (gain).
[5] Each ADS represents three Class A ordinary shares.
[6] The amount is less than RMB 0.01.
[7] Diluted non-GAAP net income (loss) attributable to ordinary shareholders of Baozun per ADS are non-GAAP financial measures, which is defined as non-GAAP net income (loss) attributable to ordinary shareholders of Baozun divided by weighted average number of shares used in calculating diluted net income (loss) per ordinary share multiplied by three.
Business Highlights
Baozun e-Commerce, or “BEC”
BEC encompasses our China e-commerce businesses, including brand store operations, customer services, and value-added services in warehouse and logistics management, IT and digital marketing. During the quarter, total revenue from BEC increased by 6.0% year-over-year, primarily driven by higher demand from digital marketing and IT solutions. As of December 31, 2024, we served approximately 490 brand partners, compared to approximately 450 brand partners as of December 31, 2023. The increase in brand partners was mainly driven by greater engagement in our value-added services, aimed at enhancing the consumer experience.
Omni-channel expansion remains a key theme for our brand partners. By the end of the fourth quarter, approximately 48.8% of our brand partners engaged with us for store operations of at least two channels, compared to 44.7% at the end of same quarter of last year. For value-added services in warehouse and logistics management, IT and digital marketing, most brand partners engaged with us in an omni-channel basis, to enhance productivity and efficiency for their omni-channel development.
Baozun Brand Management, or “BBM”
The Company launched the BBM business line in 2023, to leverage its leading portfolio of technologies in service of brands, fostering deeper and longer relationships to drive sustainable business growth in China.
BBM provides holistic brand management, encompassing strategic and tactical positioning, branding and marketing, retail and e-commerce operations, supply chain and logistics, and technology enablement. We aim to leverage our portfolio of technologies to build longer and deeper relationships with brands. Currently, our Brand Management business line includes the Gap and Hunter brands. By the end of the fourth quarter of 2024, Gap and Hunter brands have 156 offline stores under our management.
Fourth Quarter 2024 Financial Results
Total net revenues were RMB2,994.4 million (US$410.2 million), an increase of 7.7% from RMB2,780.4 million in the same quarter of last year. The increase in total net revenues was driven by revenue growth in both the Company’s BEC and BBM business lines.
Total product sales revenue was RMB1,106.0 million (US$151.5 million), an increase of 5.0% compared with RMB1,053.0 million in the same quarter of last year, of which,
Product sales revenue of E-Commerce was RMB571.7 million (US$78.3 million), a decrease of 4.3% from RMB597.5 million in the same quarter of last year. The decrease was primarily attributable to lower sales from its brand portfolio under the distribution model in the appliances category, partially offset by the introduction of high-quality new distribution businesses.
The following table sets forth a breakdown of product sales revenues of E-Commerce by key categories [8] for the periods indicated:
For the three months ended December 31,
2023
2024
RMB
% of
Net
Revenues
RMB
US$
% of
Net
Revenues
YoY
Change
(In millions, except for percentage)
Product Sales of E-Commerce
Appliances
255.6
8 %
220.5
30.2
7 %
-14 %
Beauty and cosmetics
131.1
5 %
130.7
17.9
4 %
0 %
Home and furnishing
46.1
2 %
84.6
11.6
3 %
84 %
Others
164.7
6 %
135.9
18.6
5 %
-17 %
Total net revenues from product sales of E-Commerce
597.5
21 %
571.7
78.3
19 %
-4 %
[8] Key categories refer to the categories that accounted for no less than 10% of product sales of BEC during the periods indicated.
Product sales revenue of Brand Management was RMB534.6 million (US$73.2 million), an increase of 17.3% from RMB455.5 million in the same quarter of last year. The increase was primarily driven by higher sales from the Gap brand, as the Company continued to optimize merchandising plans and enhance customer experience to boost sales in both its online and offline channels.
Services revenue was RMB1,888.5 million (US$258.7 million), an increase of 9.3% from RMB 1,727.4 million in the same quarter of last year. The increase was primarily attributable to a 16.2% year-over-year growth in online store operations, together with a 14.8% year-over-year growth in digital marketing and IT solutions, driven by content creation and technology monetization.
The following table sets forth a breakdown of services revenue by business models for the periods indicated:
For the three months ended December 31,
2023
2024
RMB
% of
Net
Revenues
RMB
US$
% of
Net
Revenues
YoY
Change
(In millions, except for percentage)
Services revenue
Online store operations
511.8
18 %
594.8
81.5
20 %
16 %
Warehousing and fulfillment
704.8
25 %
705.7
96.7
24 %
0 %
Digital marketing and IT solutions
549.4
20 %
630.5
86.3
20 %
15 %
Inter-segment eliminations[9]
(38.6)
-1 %
(42.5)
(5.8)
-1 %
10 %
Total net revenues from services
1,727.4
62 %
1,888.5
258.7
63 %
9 %
Breakdown of total net revenues of online store operations of services revenue by key categories [10] for the periods indicated:
For the three months ended December 31,
2023
2024
RMB
% of
Net
Revenues
RMB
US$
% of
Net
Revenues
YoY
Change
(In millions, except for percentage)
Online store operations in Services revenue
Apparel and accessories
372.7
13 %
472.0
64.6
15 %
27 %
Luxury
123.2
4 %
126.9
17.3
4 %
3 %
Sportswear
133.9
5 %
157.6
21.6
5 %
18 %
Other apparel
115.6
4 %
187.5
25.7
6 %
62 %
Others
139.1
6 %
122.8
16.9
4 %
-12 %
Inter-segment eliminations[11]
(18.6)
-1 %
(14.6)
(2.0)
0 %
-22 %
Total net revenues from online store operations in services
493.2
18 %
580.2
79.5
19 %
18 %
[9] The inter-segment eliminations mainly consist of revenues from online store operations, digital marketing and IT services provided by E-Commerce to Gap, a brand under Brand Management.
[10] Key categories refer to the categories that accounted for no less than 10% of services revenue during the periods indicated.
[11] The inter-segment eliminations mainly consist of revenues from store operation services provided by E-Commerce to Gap, a brand under Brand Management.
Total operating expenses were RMB2,921.2 million (US$400.2 million), compared with RMB2,774.0 million in the same quarter of last year.
Cost of products was RMB773.9 million (US$106.0 million), compared with RMB737.8 million in the same quarter of last year. The increase was primarily due to an increase in product sales volume.Fulfillment expenses were RMB768.9 million (US$105.3 million), compared with RMB768.0 million in the same quarter of last year. Fulfillment expenses remained flat, which is in line with the warehousing and fulfillment service revenue.Sales and marketing expenses were RMB1,041.4 million (US$142.7 million), compared with RMB892.4 million in the same quarter of last year. The increase was mainly due to higher revenue contributions from digital marketing services for BEC, as well as increased marketing activities and expenses associated with the expansion of offline stores for BBM during the quarter.Technology and content expenses were RMB146.6 million (US$20.1 million), compared with RMB140.8 million in the same quarter of last year. As the Company continued to implement cost control and efficiency improvements initiatives, technology and content expenses remained flat, despite strong double-digit net revenues growth in IT solutions.General and administrative expenses were RMB191.8 million (US$26.3 million), a decrease of 16.1% compared with RMB228.7 million in the same quarter of last year. The decrease was primarily due to the Company’s cost control initiatives and efficiency improvements.
Income from operations was RMB73.2 million (US$10.0 million), significant improvement compared with RMB6.4 million in the same quarter of last year. The operating margin was 2.4%, compared with 0.2% in the same quarter of last year.
Non-GAAP income from operations was RMB103.3 million (US$14.2 million), an increase of 36.6% compared with RMB75.7 million in the same quarter of last year. Non-GAAP operating margin was 3.5%, an improvement from 2.7% in the same quarter of last year.
Adjusted operating profit of E-Commerce was RMB137.4 million (US$18.8 million), an improvement of 16.3% from RMB118.2 million in the same quarter of last year.Adjusted operating loss of Brand Management was RMB34.2 million (US$4.7 million), an improvement of 19.7% compared with RMB42.5million in the same quarter of last year.
Unrealized investment gain was RMB20.9 million (US$2.9 million), compared with an unrealized investment loss of RMB8.4 million in the same quarter of last year. The unrealized investment gain of this quarter was mainly related to the increase in the trading price of iClick Interactive Asia Group Limited, or iClick Interactive, a public company listed on the Nasdaq Global Market that the Company invested in January 2021.
Impairment loss of investments was RMB14.4 million (US$2.0 million), compared with nil in the same quarter of last year. The impairment loss of investments during the period was primarily associated with certain equity investees.
Fair value change on financial instruments was a gain of RMB17.7 million (US$2.4 million), compared with nil in the same quarter of last year. The fair value change on financial instruments is mainly comprised of the gain recognized from the financial instruments the Company invested in during the second quarter of 2024.
Exchange loss was RMB11.5 million (US$1.6 million), due to exchange rate fluctuation in the quarter ended December 31, 2024, compared to exchange gain of RMB0.7 million in the same quarter last year.
Net income attributable to ordinary shareholders of Baozun was RMB0.1 million (US$0.02 million), compared with net loss attributable to ordinary shareholders of Baozun RMB48.4 million in the same quarter of last year.
Basic and diluted net income attributable to ordinary shareholders of Baozun per ADS were both RMB0.00[12], compared with net loss of both RMB0.80 for the same period of 2023.
Non-GAAP net income attributable to ordinary shareholders of Baozun Inc. was RMB45.7 million (US$6.3 million), compared with Non-GAAP net loss attributable to ordinary shareholders of Baozun Inc. RMB28.8 million in the same quarter of last year.
Diluted non-GAAP net income attributable to ordinary shareholders of Baozun per ADS was RMB0.77 (US$0.11), compared with diluted non-GAAP net loss attributable to ordinary shareholders of Baozun per ADS was RMB0.47 for the same period of 2023.
[12] The amount is less than RMB 0.01.
Fiscal Year 2024 Financial Results
Total net revenues were RMB9,422.2 million (US$1,290.8 million), an increase of 6.9% from RMB8,812.0 million in fiscal year 2023. The increase in total net revenues was driven by revenue growth in both the Company’s E-Commerce and BBM business lines.
Total product sales revenue was RMB3,466.9 million (US$475.0 million), compared with RMB3,357.2 million in the fiscal year of 2023, of which,
Product sales revenue of E-Commerce was RMB1,999.6 million (US$273.9 million), a decrease of 4.4% from RMB2,092.2 million in the fiscal year of 2023. The decrease was primarily attributable lower sales from the brand portfolio under the distribution model in the appliances category, fast-moving consumer goods and electronics categories, due to the macro-economic weakness, as well as the Company’s optimization of its brand portfolio in distribution model.
The following table sets forth a breakdown of product sales revenues of E-Commerce by key categories for the years indicated:
For the fiscal year ended December 31,
2023
2024
RMB
% of
Net
Revenues
RMB
US$
% of
Net
Revenues
YoY
Change
(In millions, except for percentage)
Product Sales of E-Commerce
Appliances
936.3
11 %
852.5
116.8
9 %
-9 %
Beauty and cosmetics
378.2
4 %
397.3
54.4
4 %
5 %
Home and furnishing
169.9
2 %
201.9
27.7
2 %
19 %
Others
607.8
7 %
547.9
75.0
6 %
-10 %
Total net revenues from product sales of E-Commerce
2,092.2
24 %
1,999.6
273.9
21 %
-4 %
Product sales revenue of Brand Management was RMB1,469.6 million (US$201.3 million), an increase of 16.2% from RMB1,265.0 million in the fiscal year of 2023. The increase was primarily driven by higher sales from the Gap brand, as the Company continued to optimize its merchandising plans and enhance customer experience to boost sales in both its online and offline channels.
Services revenue was RMB5,955.3 million (US$815.9 million), an increase of 9.2% from RMB5,454.8 million in the fiscal year of 2023. The increase was primarily attributable to a 10.0% year-over-year growth in online store operations, together with a 22.2% year-over-year growth in digital marketing and IT solutions, driven by content creation and technology monetization.
The following table sets forth a breakdown of services revenue by business models for the years indicated:
For the fiscal year ended December 31,
2023
2024
RMB
% of
Net
Revenues
RMB
US$
% of
Net
Revenues
YoY
Change
(In millions, except for percentage)
Services revenue
Online store operations
1,604.7
18 %
1,765.4
241.9
19 %
10 %
Warehousing and fulfillment
2,194.4
25 %
2,189.2
299.9
22 %
0 %
Digital marketing and IT solutions
1,735.8
20 %
2,120.9
290.6
23 %
22 %
Inter-segment eliminations[13]
(80.1)
-1 %
(120.2)
(16.5)
-1 %
50 %
Total net revenues from services
5,454.8
62 %
5,955.3
815.9
63 %
9 %
Breakdown of total net revenues of online store operations of services revenue by key categories for the years indicated:
For the fiscal year ended December 31,
2023
2024
RMB
% of
Net
Revenues
RMB
US$
% of
Net
Revenues
YoY
Change
(In millions, except for percentage)
Online store operations in Services revenue
Apparel and accessories
1,134.8
13 %
1,342.7
184.0
14 %
18 %
Luxury
406.4
4 %
407.0
55.8
4 %
0 %
Sportswear
419.1
5 %
487.1
66.7
5 %
16 %
Other apparel
309.3
4 %
448.6
61.5
5 %
45 %
Others
469.9
5 %
422.7
57.9
4 %
-10 %
Inter-segment eliminations[14]
(44.4)
-1 %
(55.2)
(7.6)
-1 %
24 %
Total net revenues from online store operations in services
1,560.3
17 %
1,710.2
234.3
17 %
10 %
[13] The inter-segment eliminations mainly consist of revenues from online store operations, digital marketing and IT services provided by E-Commerce to Gap, a brand under Brand Management.
[14] The inter-segment eliminations mainly consist of revenues from store operation services provided by E-Commerce to Gap, a brand under Brand Management.
Total operating expenses were RMB9,537.1 million (US$1,306.6 million), compared with RMB9,018.4 million in the fiscal year of 2023.
Cost of products was RMB2,473.8 million (US$338.9 million), compared with RMB2,409.1 million in the fiscal year of 2023. The increase was primarily due to an increase in product sales volume.Fulfillment expenses were RMB2,461.6 million (US$337.2 million), compared with RMB2,507.3 million in the fiscal year of 2023. The decrease was mainly due to the Company’s cost control initiatives and efficiency improvements.Sales and marketing expenses were RMB3,380.7 million (US$ 463.2 million), compared with RMB2,829.0 million in the fiscal year of 2023. The increase was mainly due to higher revenue contributions from digital marketing services for BEC, as well as increased marketing activities and expenses related to more offline stores for BBM during the year.Technology and content expenses were RMB550.3 million (US$75.4 million), compared with RMB505.2 million in the fiscal year of 2023. The increase was mainly due to more revenues from IT solutions during the year, partially offset by the Company’s cost control initiatives and efficiency improvements.General and administrative expenses were RMB719.2 million (US$98.5 million), compared with RMB855.9 million in the fiscal year of 2023. The decrease was primarily due to the Company’s cost control initiatives and efficiency improvements.
Loss from operations was RMB114.8 million (US$15.7 million), significantly improved compared with RMB206.4 million in the fiscal year of 2023. Operating margin was negative 1.2%, compared with negative 2.3% in the fiscal year of 2023.
Non-GAAP income from operations was RMB10.6 million (US$1.5 million), compared with non-GAAP loss from operations RMB23.7 million in the fiscal year of 2023. Non-GAAP operating margin was 0.1%, an improvement from negative 0.3% in the fiscal year of 2023.
Adjusted operating profit of E-Commerce was RMB179.6 million (US$24.6 million), an improvement of 9.5% from RMB164.0 million in the fiscal year of 2023.Adjusted operating loss of Brand Management was RMB168.8 million (US$23.1 million), an improvement of 10.1% compared with RMB187.7 million in the fiscal year of 2023.
Unrealized investment gain was RMB4.9 million (US$0.7 million), compared with an unrealized investment loss of RMB68.0 million in the fiscal year of 2023. The unrealized investment gain during the year was mainly related to the increase in the trading price of iClick Interactive Asia Group Limited, or iClick Interactive, a public company listed on the Nasdaq Global Market that the Company invested in January 2021.
Impairment loss of investments was RMB14.4 million (US$2.0 million), compared with nil in the fiscal year of 2023. The impairment loss of investments during the year was primarily associated with certain equity investees.
Fair value change on financial instruments was a gain of RMB11.8 million (US$1.6 million), compared with RMB24.5 million in the fiscal year of 2023. The fair value gain on financial instruments this year is mainly comprised of the gain recognized from the financial instruments the Company invested in during the second quarter of 2024, while the fair value gain on derivative liabilities last year was in connection with the equity contracts with a holder of non-controlling interest.
Exchange loss was RMB10.2 million (US$1.4 million), due to exchange rate fluctuation in the year ended December 31, 2024, compared to RMB8.5 million last year.
Net loss attributable to ordinary shareholders of Baozun narrowed to RMB185.2 million (US$25.4 million), an improvement from RMB278.4 million in the fiscal year of 2023.
Basic and diluted net loss attributable to ordinary shareholders of Baozun per ADS were both RMB3.09 (US$0.42 million), compared with both RMB4.68 in the fiscal year of 2023.
Non-GAAP net loss attributable to ordinary shareholders of Baozun Inc. was RMB40.4 million (US$5.5 million), compared with RMB65.1 million in the fiscal year of 2023.
Diluted non-GAAP net loss attributable to ordinary shareholders of Baozun per ADS was RMB0.67 (US$0.09), compared with RMB1.09 in the fiscal year of 2023.
Segment Information
(a) Description of segments
Following the acquisition of Gap Shanghai in February 2023, the Group updated its operating segments structure resulting in two segments, which were (i) E-Commerce and (ii) Brand Management;
The following summary describes the operations in each of the Group’s operating segment:
(i) E-Commerce focuses on Baozun traditional e-commerce service business and comprises two business lines, BEC (Baozun E-Commerce) and BZI (Baozun International).
a> BEC includes our mainland China e-commerce businesses, such as brands’ store operations, customer services and value-added services in logistics and supply chain management, IT and digital marketing.
b> BZI includes our e-commerce businesses outside of mainland China, including locations such as Hong Kong, Macau, Taiwan, South East Asia and Europe.
(ii) Brand Management engages in holistic brand management, encompassing strategic and tactical positioning, branding and marketing, retail and e-commerce operations, supply chain and logistics and technology enablement to leverage our portfolio of technologies to build into longer and deeper relationships with brands. Currently, the Company runs brand management operations for the Gap and Hunter brands in Greater China.
(b) Segments data
The table below provides a summary of the Group’s reportable segment results for the three months ended December 31, 2023 and 2024:
For the three months ended December 31,
2023
2024
RMB
RMB
Net revenues:
E-Commerce
2,361,066
2,501,781
Brand Management
457,961
535,475
Inter-segment eliminations *
(38,612)
(42,811)
Total consolidated net revenues
2,780,415
2,994,445
Adjusted Operating Profits (Losses) **:
E-Commerce
118,190
137,433
Brand Management
(42,535)
(34,157)
Inter-segment eliminations *
–
41
Total Adjusted Operating Profits
75,655
103,317
Unallocated expenses:
Share-based compensation expenses
(24,667)
(15,171)
Amortization of intangible assets resulting from business acquisition
(7,911)
(7,901)
Acquisition-related expenses
(1,467)
–
Cancellation fees of repurchased ADSs
–
(101)
Impairment of goodwill
(35,212)
(6,934)
Total other (expenses) income, net
(165)
21,315
Profit before income tax and share of income (loss) in equity method investment
6,233
94,525
The table below provides a summary of the Group’s reportable segment results for the fiscal years of 2023 and 2024:
For the fiscal year ended December 31,
2023
2024
RMB
RMB
Net revenues:
E-Commerce
7,621,114
8,070,271
Brand Management
1,271,027
1,474,351
Inter-segment eliminations *
(80,128)
(122,393)
Total consolidated net revenues
8,812,013
9,422,229
Adjusted Operating Profits (Losses) **:
E-Commerce
163,990
179,622
Brand Management
(187,663)
(168,767)
Inter-segment eliminations *
–
(210)
Total Adjusted Operating Profits (Losses)
(23,673)
10,645
Unallocated expenses:
Share-based compensation expenses
(103,449)
(81,601)
Amortization of intangible assets resulting from business acquisition
(31,875)
(36,257)
Acquisition-related expenses
(12,171)
–
Cancellation fees of repurchased ADSs
–
(678)
Impairment of goodwill
(35,212)
(6,934)
Total other (expenses) income, net
(10,646)
21,838
Loss before income tax and share of income (loss) in equity method investment
(217,026)
(92,987)
*The inter-segment eliminations mainly consist of revenues from services provided by E-Commerce to Brand Management.
** Adjusted Operating (Losses) Profits represent segment (losses) profits, which is (loss) income from operations from each segment without allocating share-based compensation expenses, acquisition-related expenses and amortization of intangible assets resulting from business acquisition, cancellation fees of repurchased ADSs and impairment of goodwill.
Update in Share Repurchase Programs
On January 24, 2024, the Company’s board of directors (the “Board”) authorized the management to set up and implement a new share repurchase program under which the Company may repurchase up to US$20 million worth of its outstanding (i) American depositary shares (“ADSs”), each representing three Class A ordinary shares, and/or (ii) Class A ordinary shares over the next 12 months starting from January 24, 2024. As of January 17, 2025, the Company repurchased approximately 5.3 million of ADSs for approximately US$14.7 million under its share repurchase program through the open market.
Conference Call
The Company will host a conference call to discuss the earnings at 7:30 a.m. Eastern Time on Thursday, March 20, 2025 (7:30 p.m. Beijing time on the same day).
Dial-in details for the earnings conference call are as follows:
United States: 1-888-317-6003
Hong Kong: 800-963-976
Singapore: 800-120-5863
Mainland China: 4001-206-115
International: 1-412-317-6061
Passcode: 3445230
A replay of the conference call may be accessible through March 27, 2025 by dialing the following numbers:
United States: 1-877-344-7529
International: 1-412-317-0088
Canada: 855-669-9658
Replay Access Code: 7399162
A live webcast of the conference call will be available on the Investor Relations section of Baozun’s website at http://ir.baozun.com. An archived webcast will be available through the same link following the call.
Use of Non-GAAP Financial Measures
The Company also uses certain non-GAAP financial measures in evaluating its business. For example, the Company uses non-GAAP income (loss) from operations, non-GAAP net income (loss), non-GAAP net margin, non-GAAP net income (loss) attributable to ordinary shareholders of Baozun and diluted non-GAAP net income (loss) attributable to ordinary shareholders of Baozun per ADS, as supplemental measures to review and assess its financial and operating performance. The presentation of these non-GAAP financial measures is not intended to be considered in isolation, or as a substitute for the financial information prepared and presented in accordance with U.S. GAAP.
The Company defines non-GAAP income (loss) from operations as income (loss) from operations excluding the impact of share-based compensation expenses, amortization of intangible assets resulting from business acquisition, acquisition-related expenses, impairment of goodwill and cancelation fees of repurchased. The Company defines non-GAAP net income (loss) as net (loss) income excluding the impact of share-based compensation expenses, amortization of intangible assets resulting from business acquisition, acquisition-related expenses, impairment of goodwill and investments, other-than-temporary impairment of equity method investments, cancellation fees of repurchased ADSs, fair value gain on derivative liabilities, loss (gain) on disposal/acquisition of subsidiaries, and unrealized investment loss (gain). The Company defines non-GAAP net income (loss) attributable to ordinary shareholders of Baozun as net income (loss) attributable to ordinary shareholders of Baozun excluding the impact of share-based compensation expenses, amortization of intangible assets resulting from business acquisition, acquisition-related expenses, impairment of goodwill and investments, other-than-temporary impairment of equity method investments, cancellation fees of repurchased ADSs, fair value gain on derivative liabilities, loss (gain) on disposal/acquisition of subsidiaries, and unrealized investment loss (gain). The Company defines diluted non-GAAP net income (loss) attributable to ordinary shareholders of Baozun per ADS as non-GAAP net income (loss) attributable to ordinary shareholders of Baozun divided by weighted average number of shares used in calculating net income (loss) per ordinary share multiplied by three.
The Company presents the non-GAAP financial measures because they are used by the Company’s management to evaluate the Company’s financial and operating performance and formulate business plans. Non-GAAP income (loss) from operations, non-GAAP net income (loss), non-GAAP net income (loss) attributable to ordinary shareholders of Baozun and Non-GAAP net income (loss) attributable to ordinary shareholders of Baozun per ADS reflect the Company’s ongoing business operations in a manner that allows more meaningful period-to-period comparisons. The Company believes that the use of the non-GAAP financial measures facilitates investors to understand and evaluate the Company’s current operating performance and future prospects in the same manner as management does, if they so choose. The Company also believes that the non-GAAP financial measures provide useful information to both management and investors by excluding certain expenses, gain/loss and other items that are not expected to result in future cash payments or that are non-recurring in nature or may not be indicative of the Company’s core operating results and business outlook.
The non-GAAP financial measures are not defined under U.S. GAAP and are not presented in accordance with U.S. GAAP. The non-GAAP financial measures have limitations as analytical tools. One of the key limitations of using non-GAAP income (loss) from operations, non-GAAP net income (loss), non-GAAP net income (loss) attributable to ordinary shareholders of Baozun, and non-GAAP net income (loss) attributable to ordinary shareholders of Baozun per ADS is that they do not reflect all items of income and expense that affect the Company’s operations. Further, the non-GAAP measures may differ from the non-GAAP measures used by other companies, including peer companies, potentially limiting the comparability of their financial results to the Company’s. In light of the foregoing limitations, the non-GAAP income (loss) from operations, non-GAAP operating margin, non-GAAP net income (loss), non-GAAP net margin, non-GAAP net income (loss) attributable to ordinary shareholders of Baozun and non-GAAP net income (loss) attributable to ordinary shareholders of Baozun per ADS for the period should not be considered in isolation from or as an alternative to income (loss) from operations, operating margin, net income (loss), net margin, net income (loss) attributable to ordinary shareholders of Baozun and net income (loss) attributable to ordinary shareholders of Baozun per ADS, or other financial measures prepared in accordance with U.S. GAAP.
The Company compensates for these limitations by reconciling the non-GAAP financial measures to the nearest U.S. GAAP performance measures, which should be considered when evaluating the Company’s performance. The company encourages you to review the company’s financial information in its entirety and not rely on a single financial measure. For reconciliations of these non-GAAP financial measures to the most directly comparable GAAP financial measures, please see the section of the accompanying tables titled, “Reconciliations of GAAP and Non-GAAP Results.”
Safe Harbor Statements
This announcement contains forward-looking statements. These statements are made under the “safe harbor” provisions of the U.S. Private Securities Litigation Reform Act of 1995. These forward-looking statements can be identified by terminology such as “will,” “expects,” “anticipates,” “future,” “intends,” “plans,” “believes,” “estimates,” “confident,” “potential,” “continues,” “ongoing,” “targets,” “guidance,” “going forward,” “looking forward,” “outlook” or other similar expressions. Statements that are not historical facts, including but not limited to statements about Baozun’s beliefs and expectations, are forward-looking statements. Forward-looking statements involve inherent risks and uncertainties. A number of factors could cause actual results to differ materially from those contained in any forward-looking statement, including but not limited to Baozun’s filings with the United States Securities and Exchange Commission and its announcements, notices or other documents published on the website of The Stock Exchange of Hong Kong Limited. All information provided in this announcement is as of the date hereof and is based on assumptions that Baozun believes to be reasonable as of this date, and Baozun undertakes no obligation to update such information, except as required under applicable law.
About Baozun Inc.
Founded in 2007, Baozun Inc. is a leader in brand e-commerce service, brand management, and digital commerce service. It serves approximately 490 brands from various industries and sectors around the world, including East and Southeast Asia, Europe and North America as of December 31, 2024.
Baozun Inc. comprises three major business lines – Baozun e-Commerce (BEC), Baozun Brand Management (BBM) and Baozun International (BZI) and is committed to accelerating high-quality and sustainable growth. Driven by the principle that “Technology Empowers the Future Success”, Baozun’s business lines are devoted to empowering their clients’ business and navigating their new phase of development.
For more information, please visit http://ir.baozun.com.
For investor and media inquiries, please contact:
Baozun Inc.
Ms. Wendy Sun
Email: ir@baozun.com
Baozun Inc.
UNAUDITED CONDENSED CONSOLIDATED BALANCE SHEETS
(In thousands)
As of
December 31,
2023
December 31,
2024
December 31,
2024
RMB
RMB
US$
ASSETS
Current assets
Cash and cash equivalents
2,149,531
1,289,323
176,636
Restricted cash
202,764
354,991
48,634
Short-term investments
720,522
1,271,618
174,211
Accounts receivable, net
2,184,729
2,033,778
278,626
Inventories
1,045,116
1,117,439
153,089
Advances to suppliers
311,111
404,353
55,396
Derivative financial assets
–
11,557
1,583
Prepayments and other current assets
590,350
724,091
99,200
Amounts due from related parties
86,661
7,021
962
Total current assets
7,290,784
7,214,171
988,337
Non-current assets
Long term investments
359,129
341,687
46,811
Property and equipment, net
851,151
822,229
112,645
Intangible assets, net
306,420
357,307
48,951
Land use right, net
38,464
37,438
5,129
Operating lease right-of-use assets
1,070,120
767,376
105,130
Goodwill
312,464
362,399
49,648
Other non-current assets
45,316
69,886
9,574
Deferred tax assets
200,628
234,508
32,127
Total non-current assets
3,183,692
2,992,830
410,015
Total assets
10,474,476
10,207,001
1,398,352
LIABILITIES AND SHAREHOLDERS’ EQUITY
Current liabilities
Short-term loan
1,115,721
1,220,957
167,270
Accounts payable
563,562
620,679
85,033
Notes payable
506,629
461,179
63,181
Income tax payables
18,768
26,559
3,638
Accrued expenses and other current liabilities
1,188,179
1,169,547
160,228
Derivative liabilities
–
130
18
Amounts due to related parties
32,118
5,369
735
Current operating lease liabilities
332,983
243,137
33,310
Total current liabilities
3,757,960
3,747,557
513,413
Non-current liabilities
Deferred tax liabilities
24,966
32,783
4,491
Long-term operating lease liabilities
799,096
597,805
81,899
Other non-current liabilities
40,718
48,277
6,614
Total non-current liabilities
864,780
678,865
93,004
Total liabilities
4,622,740
4,426,422
606,417
Redeemable non-controlling interests
1,584,858
1,670,379
228,841
Baozun Inc. shareholders’ equity:
Class A ordinary shares (US$0.0001 par
value; 470,000,000 shares authorized,
167,901,880 and 175,668,586 shares
issued, 167,901,880 and 161,337,586
shares outstanding, as of December 31,
2023, and December 31, 2024, respectively)
93
95
13
Class B ordinary shares (US$0.0001 par
value; 30,000,000 shares authorized,
13,300,738 shares issued and outstanding
as of December 31, 2023, and December
31, 2024)
8
8
1
Additional paid-in capital
4,571,439
4,646,631
636,586
Treasury shares (nil and 14,331,000
shares as of December 31, 2023, and
December 31, 2024, respectively)
–
(95,502)
(13,084)
Accumulated deficit
(506,587)
(691,785)
(94,775)
Accumulated other comprehensive income
32,251
54,575
7,477
Total Baozun Inc. shareholders’ equity
4,097,204
3,914,022
536,218
Non-controlling interests
169,674
196,178
26,876
Total Shareholders’ equity
4,266,878
4,110,200
563,094
Total liabilities, redeemable non-
controlling interests and shareholders’ equity
10,474,476
10,207,001
1,398,352
Baozun Inc.
UNAUDITED CONDENSED CONSOLIDATED STATEMENTS OF COMPREHENSIVE INCOME
(In thousands, except for share and per share data and per ADS data)
For the three months ended September 30,
For the year ended December 31,
2023
2024
2023
2024
RMB
RMB
US$
RMB
RMB
US$
Net revenues
Product sales(1)
1,053,022
1,105,971
151,517
3,357,202
3,466,928
474,967
Services
1,727,392
1,888,474
258,720
5,454,811
5,955,301
815,873
Total net revenues
2,780,414
2,994,445
410,237
8,812,013
9,422,229
1,290,840
Operating expenses (2)
Cost of products
(737,813)
(773,887)
(106,022)
(2,409,110)
(2,473,804)
(338,910)
Fulfillment(3)
(768,028)
(768,863)
(105,334)
(2,507,306)
(2,461,591)
(337,237)
Sales and marketing (3)
(892,401)
(1,041,421)
(142,674)
(2,829,016)
(3,380,724)
(463,157)
Technology and content(3)
(140,788)
(146,589)
(20,083)
(505,203)
(550,289)
(75,389)
General and administrative(3)
(228,697)
(191,822)
(26,280)
(855,914)
(719,157)
(98,524)
Other operating income, net
28,923
8,281
1,134
123,368
55,445
7,596
Impairment of goodwill
(35,212)
(6,934)
(950)
(35,212)
(6,934)
(950)
Total operating expenses
(2,774,016)
(2,921,235)
(400,209)
(9,018,393)
(9,537,054)
(1,306,571)
Income (loss) from operations
6,398
73,210
10,028
(206,380)
(114,825)
(15,731)
Other income (expenses)
Interest income
19,508
18,298
2,507
82,113
68,752
9,419
Interest expense
(9,436)
(9,619)
(1,318)
(41,344)
(38,987)
(5,341)
Unrealized investment (loss) gain
(8,352)
20,851
2,857
(68,031)
4,851
665
(Loss) gain on disposal/acquisition of subsidiaries
(2,620)
–
–
631
–
–
Impairment loss of investments
–
(14,403)
(1,973)
–
(14,403)
(1,973)
Fair value change on financial instruments
–
17,654
2,419
24,515
11,838
1,622
Exchange gain (loss)
735
(11,466)
(1,571)
(8,530)
(10,213)
(1,399)
Gain (loss) before income tax
6,233
94,525
12,949
(217,026)
(92,987)
(12,738)
Income tax expense (4)
(5,952)
(28,443)
(3,897)
(12,003)
(20,739)
(2,841)
Share of (loss) income in equity method investment, net of tax of nil(5)
(2,264)
(23,930)
(3,278)
6,253
(24,658)
(3,378)
Net (loss) income
(1,983)
42,152
5,774
(222,776)
(138,384)
(18,957)
Net (income) loss attributable to
noncontrolling interests
(22,368)
(18,253)
(2,501)
(9,677)
1,990
273
Net income attributable to
redeemable noncontrolling
interests
(24,063)
(23,770)
(3,256)
(45,969)
(48,804)
(6,686)
Net (loss) income attributable to ordinary shareholders of Baozun Inc.
(48,414)
129
17
(278,422)
(185,198)
(25,370)
Net (loss) income per share attributable to ordinary shareholders of Baozun Inc.:
Basic
(0.27)
0.00*
0.00*
(1.56)
(1.03)
(0.14)
Diluted
(0.27)
0.00*
0.00*
(1.56)
(1.03)
(0.14)
Net (loss) income per ADS attributable to ordinary shareholders of Baozun Inc.:
Basic
(0.80)
0.00*
0.00*
(4.68)
(3.09)
(0.42)
Diluted
(0.80)
0.00*
0.00*
(4.68)
(3.09)
(0.42)
Weighted average shares used in calculating net loss per ordinary share
Basic
180,642,328
176,942,201
176,942,201
178,549,849
179,678,986
179,678,986
Diluted
180,642,328
178,685,466
178,685,466
178,549,849
179,678,986
179,678,986
Net (loss) income
(1,983)
42,152
5,774
(222,776)
(138,384)
(18,957)
Other comprehensive income, net of tax of nil:
Foreign currency translation adjustment
(23,783)
24,732
3,388
16,573
22,324
3,058
Comprehensive (loss) income
(25,766)
66,884
9,162
(206,203)
(116,060)
(15,899)
* The amounts are less than 0.01.
(1) These amounts include product sales from E-Commerce and Brand Management of RMB571.7 million and RMB534.6 million for the three months period ended December 31, 2024, respectively, compared with product sales from E-Commerce of RMB597.5 million and Brand Management of RMB455.5 million for the three months period ended December 31, 2023.
These amounts also include product sales from E-Commerce and Brand Management of RMB1,999.6 million and RMB1,469.6 million for the fiscal year ended December 31, 2024, respectively, compared with product sales from E-Commerce of RMB2,092.2 million and Brand Management of RMB1,265.0 million for the fiscal year ended December 31, 2023.
(2) Share-based compensation expenses are allocated in operating expenses items as follows:
For the three months ended December 31,
For the year ended December 31,
2023
2024
2023
2024
RMB
RMB
US$
RMB
RMB
US$
Fulfillment
1,873
732
100
6,443
4,885
669
Sales and marketing
5,239
3,075
421
33,955
19,943
2,732
Technology and content
3,681
2,077
285
12,184
11,290
1,547
General and administrative
13,874
9,287
1,272
50,867
45,483
6,231
24,667
15,171
2,078
103,449
81,601
11,179
(3) These amounts include amortization of intangible assets resulting from business acquisition, which amounted to RMB7.9 million and RMB7.9 million for the three months period ended December 31, 2023 and 2024, respectively.
These amounts also include amortization of intangible assets resulting from business acquisition, which amounted to RMB31.9 million and RMB36.3 million for the fiscal year ended December 31, 2023 and 2024, respectively.
(4) These amounts include income tax benefits of RMB1.5 million and RMB1.8 million related to the reversal of deferred tax liabilities, which was recognized on business acquisition for the three months period ended December 31, 2023 and 2024, respectively.
These amounts also include income tax benefits of RMB6.1 million and RMB7.6 million related to the reversal of deferred tax liabilities, which was recognized on business acquisition for the fiscal year ended December 31, 2023 and 2024, respectively.
(5) These amounts include the other-than-temporary impairment of an equity method investment of nil and RMB26.1 million for the three months period and for the fiscal year ended December 31, 2023 and 2024, respectively.
Reconciliations of GAAP and Non-GAAP Results
(In thousands, except for share and per ADS data)
For the three months ended December 31,
For the year ended December 31,
2023
2024
2023
2024
RMB
RMB
US$
RMB
RMB
US$
Income (loss) from operations
6,398
73,210
10,028
(206,380)
(114,825)
(15,731)
Add: Share-based compensation expenses
24,667
15,171
2,078
103,449
81,601
11,179
Amortization of intangible assets resulting from business
acquisition
7,911
7,901
1,082
31,875
36,257
4,967
Acquisition-related expenses
1,467
–
–
12,171
–
–
Impairment of goodwill
35,212
6,934
950
35,212
6,934
950
Cancellation fees of repurchased ADSs
–
101
14
–
678
93
Non-GAAP income (loss) from operations
75,655
103,317
14,152
(23,673)
10,645
1,458
Net (loss) income
(1,983)
42,152
5,774
(222,776)
(138,384)
(18,957)
Add: Share-based compensation expenses
24,667
15,171
2,078
103,449
81,601
11,179
Amortization of intangible assets resulting from business
acquisition
7,911
7,901
1,082
31,875
36,257
4,967
Acquisition-related expenses
1,467
–
–
12,171
–
–
Impairment of goodwill and investments
35,212
21,337
2,923
35,212
21,337
2,923
Other-than-temporary impairment of equity method investments
–
26,115
3,578
–
26,115
3,578
Cancellation fees of repurchased ADSs
–
101
14
–
678
93
Fair value gain on derivative liabilities
–
–
–
(24,515)
–
–
Loss (gain) on disposal/acquisition of subsidiaries
2,620
–
–
(631)
–
–
Unrealized investment loss (gain)
8,352
(20,851)
(2,857)
68,031
(4,851)
(665)
Less: Tax effect of amortization of intangible assets resulting
from business acquisition
(1,507)
(1,802)
(247)
(6,086)
(7,611)
(1,043)
Non-GAAP net income (loss)
76,739
90,124
12,345
(3,270)
15,142
2,075
Net (loss) income attributable to ordinary shareholders of
Baozun Inc.
(48,414)
129
17
(278,422)
(185,198)
(25,370)
Add: Share-based compensation expenses
24,667
15,171
2,078
103,449
81,601
11,179
Amortization of intangible assets resulting from business
acquisition
5,991
5,528
757
24,206
25,776
3,531
Acquisition-related expenses
1,467
–
–
12,171
–
–
Impairment of goodwill and investments
35,212
20,742
2,842
35,212
20,742
2,842
Other-than-temporary impairment of equity method investments
–
26,115
3,578
–
26,115
3,578
Cancellation fees of repurchased ADSs
–
101
14
–
678
93
Fair value gain on derivative liabilities
–
–
–
(24,515)
–
–
Loss (gain) on disposal/acquisition of subsidiaries
2,620
–
–
(652)
–
–
Unrealized investment loss (gain)
8,352
(20,851)
(2,857)
68,031
(4,851)
(665)
Less: Tax effect of amortization of intangible assets resulting from business acquisition
(1,127)
(1,209)
(166)
(4,569)
(5,234)
(717)
Non-GAAP net income (loss) attributable to ordinary
shareholders of Baozun Inc.
28,768
45,726
6,263
(65,089)
(40,371)
(5,529)
Diluted non-GAAP net income (loss) attributable to ordinary
shareholders of Baozun Inc. per ADS:
0.47
0.77
0.11
(1.09)
(0.67)
(0.09)
Weighted average shares used in calculating diluted net
income (loss) per ordinary share
182,780,715
178,685,466
178,685,466
178,549,849
179,678,986
179,678,986
(1) The Company evaluated the non-GAAP adjustments items and concluded that these items have immaterial income tax effects except for amortization of intangible assets resulting from business acquisition.
View original content:https://www.prnewswire.com/news-releases/baozun-announces-fourth-quarter-and-fiscal-year-2024-unaudited-financial-results-302406876.html
SOURCE Baozun Inc.

You may like
Technology
As ADA Anniversary Approaches, University of Phoenix Survey Highlights AI’s Potential to Advance Accessibility in Work and Learning
Published
53 minutes agoon
July 24, 2026By
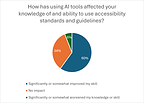
Survey conducted by The Harris Poll on behalf of University of Phoenix finds among those already using AI in the workplace, 60% say AI has improved their knowledge of and ability to use accessibility standards and guidelines.
PHOENIX, July 24, 2026 /PRNewswire/ — As artificial intelligence becomes part of how people work, learn and solve problems, a new University of Phoenix survey conducted by The Harris Poll finds that recent working learners see meaningful opportunities for AI to support accessibility. The survey was designed to understand the impact of AI in the workplace and learning environments on accessibility, defined as ensuring digital content, tools and resources, including AI tools and output, are usable by people with different abilities through inclusive design, use of assistive technology or conformance with accessibility standards, such as the Web Content Accessibility Guidelines (WCAG). The findings are being released ahead of the 36th anniversary of the Americans with Disabilities Act (ADA) on July 26.
The survey, conducted among 1,019 U.S. employed adults who completed a professionally presented training or school course in the past 12 months (“recent working learners”), found that, among workers already using AI in the workplace, 3 in 5 (60%) say AI has improved their knowledge of and ability to use accessibility standards and guidelines, including nearly 1 in 5 (19%) who report significant improvement.
While the findings point to optimism about AI’s accessibility potential, they also reveal an opportunity for clearer organizational guidance: 45% of respondents say accessibility is absent from, unclear in, or they are uncertain whether it is covered by their workplace AI policies.
“The reality is that accessibility benefits everyone,” shares Kelly Hermann, Vice President of Accessibility and Student Affairs at University of Phoenix. “If accessibility is built in from the beginning, organizations are more likely to create AI-enabled environments that are universally usable. Clearer content, better summaries, accurate captions, and multiple formats can help workers and learners with disabilities, but they also help busy adults, multilingual learners, mobile users, and anyone trying to absorb information quickly.”
Key findings from the survey include:
Workers see AI’s accessibility potential: 89% of recent working learners identify workflows that could benefit from AI and accessibility tools, especially creating accessible documents, presentations, websites or learning materials (38%), presenting information in different formats such as plain language, audio, summaries or translations (33%), and training employees or learners on accessibility practices (30%).AI may help build accessibility awareness: Among those already using AI in the workplace, 60% say AI has improved their knowledge of and ability to use accessibility standards and guidelines.Accessibility is not always clear in workplace AI policies: 45% of recent working learners say accessibility is absent from, unclear in, or they are uncertain whether it is covered by their workplace AI policies.AI tools may not yet fully support different access needs: Among those who use workplace AI tools, only about a quarter of survey respondents (27%) say AI tools available through their workplace or professional learning environment support people with disabilities very well.Human oversight remains important: 36% of recent working learners say human review for important decisions or high-impact work should be part of responsible AI use at work or school.Workers also recognize how AI and accessibility can have an impact on their own career journey: 90% of recent working learners identify AI and accessibility skills that would be valuable in their current or desired career field, including 45% who see value in understanding when AI-generated content needs human review.
Why accessibility is essential to responsible AI adoption
As AI tools are used to draft documents, summarize information, generate captions and transcripts, create image descriptions, support learning and assist with workplace tasks, accessibility becomes central to responsible use. Poorly implemented AI can also create or amplify barriers, including inaccessible content, inaccurate summaries, biased outputs and tools that do not work effectively with assistive technologies.
“Responsible AI is not only about productivity,” Hermann said. “It is about whether the technology works for the people who need to use it. AI can help create more accessible materials and more flexible ways to engage with information, but it still requires clear policies, practical training and human judgment to make sure the outputs are accurate, applicable and usable.”
What the findings mean for employers and educators
The survey suggests that organizations have an opportunity to align AI adoption with supportive design, accessibility practices and workforce training. Employers and educators can take immediate steps by:
Naming accessibility directly in AI policies and guidance.Choosing AI tools with accessibility and assistive technology compatibility in mind.Training workers and learners to create, check and improve accessible AI-generated content.Making support pathways clear for people who experience barriers using AI tools.Keeping human review in place for important decisions, high-impact work and accessibility-sensitive outputs.
The survey also found workers want practical AI training. The most helpful resources identified by recent working learners include real-world examples from their field or industry (36%), hands-on practice using realistic workplace scenarios (34%) and step-by-step demonstrations of common tasks (33%).
Accessibility insights from University of Phoenix
Hermann shared the survey findings ahead of the ADA anniversary in recent media interviews. Hermann oversees the University’s accessibility initiative, including evaluation and remediation of curricular resources, the Center for Access, Resources, Engagement and Support Services (CARES), and the Office of Collaborative Learning and Educational Engagement. Her work focuses on fostering accessible and welcoming educational environments for students, faculty and staff.
Hermann’s office at University of Phoenix also convenes accessibility conversations through initiatives such as Access Amplified™, a free, annual virtual event focused on advancing digital accessibility in web development. The event brings together engineers, developers, designers, content authors and digital strategists for practical strategies and human-centered conversations that address the gap between coding practices and how users with assistive technology experience the web.
About the survey
The survey was conducted online within the United States by The Harris Poll on behalf of University of Phoenix from June 22–29, 2026, among 1,019 employed adults ages 18 and older who have taken a professionally presented training or a school course in the past 12 months, referred to as “recent working learners.” Data were weighted where necessary by age, gender, race/ethnicity, region, education, employment, marital status, household size, household income and smoking status to bring them in line with their actual proportions in the population.
Respondents for this survey were selected from among those who have agreed to participate in surveys. The sampling precision of Harris online polls is measured by using a Bayesian credible interval. For this study, the sample data is accurate to within +/- 3.8 percentage points using a 95% confidence level. This credible interval will be wider among subsets of the surveyed population of interest.
Review the complete survey at phoenix.edu/aiaccessibility.
About University of Phoenix
University of Phoenix is Built for Real Life. 50 Years Strong. The University innovates to help working adults enhance their careers and develop skills in a rapidly changing world through flexible online learning, relevant courses, academic AI pillars, and skills-mapped curriculum for associate, bachelor’s and master’s degree programs. Active students and alumni have access to Career Services for Life® resources including career guidance and tools. For more information, visit phoenix.edu.
View original content to download multimedia:https://www.prnewswire.com/news-releases/as-ada-anniversary-approaches-university-of-phoenix-survey-highlights-ais-potential-to-advance-accessibility-in-work-and-learning-302834448.html
SOURCE University of Phoenix
Technology
Mastech Digital to Announce Second Quarter 2026 Financial Results; Participate in Upcoming Investor Conference
Published
2 hours agoon
July 24, 2026By
PITTSBURGH, July 24, 2026 /PRNewswire/ — Mastech Digital, Inc. (NYSE American: MHH) (“Mastech Digital”), a leading provider of Digital Transformation IT Services, today announced the date for the release of its financial results for the second quarter ended June 30, 2026, and its participation in an upcoming investor conference.
Second Quarter 2026 Earnings:
Mastech Digital will report its financial results for the second quarter 2026 before the market opens on Thursday, August 6, 2026. Management will host a live conference call and webcast at 9:00 a.m. Eastern Time on that day to discuss the Company’s financial performance and operating results. The conference call will be hosted by Nirav Patel, President and CEO, and Kannan Sugantharaman, Chief Financial and Operations Officer.
Those wishing to participate via webcast should access the call through Mastech Digital’s Investor Relations website at https://investors.mastechdigital.com. Those wishing to participate via telephone may dial in at 1-800-715-9871 (USA) or 1-646-307-1963 (International) with the passcode 7506988. The replay will be available via webcast through Mastech Digital’s Investor Relations website.
Upcoming Investor Conference:
Mr. Sugantharaman will host a fireside chat at the Sidoti Micro-Cap Investor Conference on Wednesday, August 19, 2026, at 9:15 a.m. Eastern Time.
Mastech Digital management is scheduled to host virtual one-on-one and small group meetings with investors during the conference on August 19-20, 2026. Investors interested in arranging a meeting should contact their Sidoti representative or reach out to the Mastech Digital investor relations team at investors@mastechdigital.com.
About Mastech Digital, Inc.
Mastech Digital (NYSE American: MHH) is a leading provider of Digital Transformation IT Services. The Company offers Data Management, Analytics & AI Solutions, and IT Staffing Services with a digital-first approach. A minority-owned enterprise, Mastech Digital is headquartered in Pittsburgh, PA, with offices across the U.S., Canada, Europe, and India. Visit us at www.mastechdigital.com.
Investor Relations Contact:
investors@mastechdigital.com
View original content to download multimedia:https://www.prnewswire.com/news-releases/mastech-digital-to-announce-second-quarter-2026-financial-results-participate-in-upcoming-investor-conference-302834421.html
SOURCE Mastech Digital, Inc.
Technology
SOLAI Limited Announces Extraordinary General Meeting
Published
2 hours agoon
July 24, 2026By
AKRON, Ohio, July 24, 2026 /PRNewswire/ — SOLAI Limited (NYSE: SLAI) (“SOLAI” or the “Company”) (previously known as “BIT Mining Limited”), a technology-driven personal AI and digital infrastructure provider, today announced that it will hold its extraordinary general meeting of shareholders at 428 South Seiberling Street, Akron, Ohio, US on August 14, 2026 at 10:00 a.m., New York time.
Holders of record of ordinary shares and preference shares of the Company at the close of business on July 20, 2026, New York time (the “Record Date”) are entitled to receive notice of, and to attend and vote at, the extraordinary general meeting or any adjournment thereof. Holders of the Company’s American Depositary Shares (“ADSs”) who wish to exercise their voting rights for the underlying ordinary shares must act through the depositary of the Company’s ADS program, Deutsche Bank Trust Company Americas.
The notice of the extraordinary general meeting, which sets forth the resolutions to be submitted to shareholder approval at the extraordinary general meeting is available on the Investor Relations section of the Company’s website at https://ir.solai.com.
About SOLAI Limited
SOLAI Limited (previously known as “BIT Mining Limited”) (NYSE: SLAI) (previously traded under “BTCM”) is a technology-driven personal AI and digital infrastructure provider. Building upon its historical legacy in digital asset mining and blockchain network operations, the Company is leveraging extensive experience in large-scale hardware deployment, data center operations, and high-performance computing to build the foundational infrastructure for personal AI computing and digital asset ecosystems globally.
For more information:
SOLAI Limited
ir@solai.com
ir.solai.com
www.solai.com
Christensen Advisory
Jason Ng
Tel: +852-2117-0861
Email: solai@christensencomms.com
View original content:https://www.prnewswire.com/news-releases/solai-limited-announces-extraordinary-general-meeting-302834034.html
SOURCE SOLAI Limited


As ADA Anniversary Approaches, University of Phoenix Survey Highlights AI’s Potential to Advance Accessibility in Work and Learning

EU authorities include HTX exchange in Russian sanctions
Mastech Digital to Announce Second Quarter 2026 Financial Results; Participate in Upcoming Investor Conference
Send Rakhi to UK swiftly with UK Gifts Portal

Whiteboard Series with NEAR | Ep: 45 Joel Thorstensson from ceramic.network

New Gooseneck Omni Antennas Offer Enhanced Signals in a Durable Package

Why You Should Build on #NEAR – Co-founder Illia Polosukhin at CV Labs
Whiteboard Series with NEAR | Ep: 45 Joel Thorstensson from ceramic.network

NEAR End of Year Town Hall 2021: The Open Web World, MetaBUILD 2 Hackathon and 2021 recap
Trending
-

 Coin Market5 days ago
Will the US get CLARITY this week? Bitcoin’s new $80K target: Hodler’s Digest, July 19
-

 Technology5 days ago
“Every Day CO₂ Challenge”: More Than a Game, A New Way of Learning
-

 Technology5 days ago
Trakka Systems to Demonstrate Advanced ISR Capabilities at Farnborough International Airshow 2026
-

 Technology5 days ago
Powering ASEAN’s Manufacturing Transformation: IME 2026 Connects Technology, Industry and Opportunity
-

 Technology4 days ago
Signeasy expands beyond eSignatures with Intelligent Contract Management for growing businesses
-
 Technology5 days ago
DBS named Asia’s Best Digital Bank by Euromoney, recognised for its AI leadership and responsible innovation
-
 Technology5 days ago
CNPC launches China’s first full-chain green, low-carbon ethylene project
-

 Technology5 days ago
BOC Group Releases ADONIS 19.0 LTS to Bring Smarter Support into Everyday BPM Work