
Technology
WIC Asia-Pacific Summit spotlights digital intelligence future

Published
2 years agoon
By

BEIJING, April 17, 2025 /PRNewswire/ — A news report from CRI Online:
The Main Forum on the Digital Intelligence Future at the 2025 World Internet Conference (WIC) Asia-Pacific Summit was held in Hong Kong on April 14.
Francis Gurry, vice-chair of the WIC; Paul Chan Mo-po, financial secretary of the Government of the Hong Kong Special Administrative Region (HKSAR); and Sun Weimin, chief engineer of the Cyberspace Administration of China, attended the forum and delivered speeches.
Distinguished guests included Zhao Houlin, former secretary-general of the International Telecommunication Union; Sun Dong, secretary for innovation, technology and industry, the government of the Hong Kong Speical Administrative Region of the People’s Republic of China; Nahima Janett Díaz Flores, general director of the Nicaraguan Institute of Telecommunications and Postal Services; Hun Kim, acting vice-president, investment solutions and director general, AIIB; Veni Markovski, vice-president of the Internet Corporation for Assigned Names and Numbers; Zhang Donggang, chair of the University Council, Renmin University of China; Wu Jianping, academician of the Chinese Academy of Engineering and professor at Tsinghua University; Hans Dekkers, general manager of IBM Asia Pacific; Chen Feng, CEO of Arm China; and Zhu Hao, co-founder and CTO of Manycore Tech.
View original content to download multimedia:https://www.prnewswire.com/news-releases/wic-asia-pacific-summit-spotlights-digital-intelligence-future-302431286.html
SOURCE CRIOnline

You may like
Technology
Silicon Labs Reports Third Quarter 2026 Results
Published
9 minutes agoon
November 10, 2026By

Wireless IoT leader delivers $251 million in revenue and strong earnings growth
AUSTIN, Texas, Nov. 10, 2026 /PRNewswire/ — Silicon Labs (NASDAQ: SLAB), the leading innovator in low-power wireless, reported financial results for the third quarter, which ended October 3, 2026.
“We delivered strong third-quarter results, with revenue up 10% sequentially, underpinned by broad-based growth across many end applications and another record quarter for medical revenue as known customer ramps continued,” said Matt Johnson, President and Chief Executive Officer. “Earnings significantly outpaced revenue growth, a result of strong operational execution by the team. Looking ahead, our current backlog and design-win ramps position us for continued revenue growth and meaningful earnings expansion.”
Third Quarter Financial Highlights
Revenue was $251 million, up 22% year-over-yearIndustrial & Commercial revenue was $141 million, up 20% year-over-yearHome & Life revenue was $110 million, up 24% year-over-yearBookings imply a healthy demand environment, while distributor inventory declined further to a multi-year low and end customer inventory was near record lows during the quarterMedical revenue reached a new quarterly record, increasing 48% sequentially and more than 300% year-over-yearGAAP diluted earnings per share was $0.26, compared with a loss of $0.30 in the year-ago quarterNon-GAAP diluted earnings per share was $1.05, up 228% over the comparable period last year
Results on a GAAP basis:
GAAP gross margin was 60.8%GAAP operating expenses were $145 millionGAAP operating income was $8 millionGAAP diluted earnings per share was $0.26
Results on a non-GAAP basis, excluding the impact of stock compensation, amortization of acquired intangible assets, merger-related costs, and certain other items as set forth in the below GAAP to Non-GAAP reconciliation tables were as follows:
Non-GAAP gross margin was 61.0%Non-GAAP operating expenses were $113 millionNon-GAAP operating income was $40 millionNon-GAAP diluted earnings per share was $1.05
Due to the announced pending acquisition of Silicon Labs by Texas Instruments, Silicon Labs has suspended providing forward-looking guidance.
About Silicon Labs
Silicon Labs (NASDAQ: SLAB) is the leading innovator in low-power wireless connectivity, building embedded technology that connects devices and improves lives. Merging cutting-edge technology into the world’s most highly integrated SoCs, Silicon Labs provides device makers the solutions, support, and ecosystems needed to create advanced edge connectivity applications. Headquartered in Austin, Texas, Silicon Labs has operations in over 16 countries and is the trusted partner for innovative solutions in the smart home, industrial IoT, and smart cities markets. Learn more at silabs.com.
Forward-Looking Statements
This press release contains forward-looking statements regarding Silicon Labs’ current expectations, which are based on its current views and assumptions. The words “believe”, “estimate”, “expect”, “intend”, “anticipate”, “plan”, “project”, “will”, and similar phrases as they relate to Silicon Labs are intended to identify such forward-looking statements, although the absence of such words does not necessarily mean a statement is not forward looking. These forward-looking statements include, but are not necessarily limited to, Silicon Labs’ expectations regarding its near- and long-term strength and continued revenue growth and earnings expansion and are subject to various risks and uncertainties that could cause actual results to differ materially from expectations that are expressed or implied herein. Among the factors that could cause actual results to differ materially from those in the forward-looking statements are the following: our ability to complete the merger with Texas Instruments within the time frame expected, or at all, as well as potential disruptions in our business and restrictions on our activities during the pendency of the merger; fluctuating changes in global trade policies, including the imposition of tariffs, duties, trade sanctions, or other barriers to international commerce; the impact of the current global memory chip shortage; the competitive and cyclical nature of the semiconductor industry; the challenging macroeconomic environment, including disruptions in the financial services industry; geographic concentration of manufacturers, assemblers, test service providers and customers in Asia that subjects Silicon Labs’ business and results of operations to risks of natural disasters, epidemics or pandemics, war and political unrest; risks that demand and the supply chain may be adversely affected by military conflict (including in the Middle East, and between Russia and Ukraine), terrorism, sanctions or other geopolitical events globally (including in the Middle East, and conflict between Taiwan and China); risks that Silicon Labs may not be able to maintain its historical growth; quarterly fluctuations in revenues and operating results; difficulties developing new products that achieve market acceptance; risks associated with international activities (including trade barriers, particularly with respect to China); intellectual property litigation risks; risks associated with acquisitions and divestitures; product liability risks; difficulties managing and/or obtaining sufficient supply from Silicon Labs’ distributors, manufacturers and subcontractors; dependence on a limited number of products; absence of long-term commitments from customers; inventory-related risks; difficulties managing international activities; risks that Silicon Labs may not be able to manage strains associated with its growth; credit risks associated with its accounts receivable; dependence on key personnel; stock price volatility; the impact of public health crises on the U.S. and global economy; debt-related risks; capital-raising risks; the timing and scope of share repurchases and/or dividends; average selling prices of products may decrease significantly and rapidly; information technology risks; cyber-attacks against Silicon Labs’ products and its networks; risks associated with any material weakness in our internal controls over financial reporting; risks relating to compliance with laws and regulations; and other factors that are detailed in the SEC filings of Silicon Laboratories Inc. Silicon Labs disclaims any intention or obligation to update or revise any forward-looking statements, whether as a result of new information, future events, or otherwise, except as required by law. References in this press release to Silicon Labs shall mean Silicon Laboratories Inc.
Note to editors: Silicon Laboratories, Silicon Labs, the “S” symbol, and the Silicon Labs logo are trademarks of Silicon Laboratories Inc. All other product names noted herein may be trademarks of their respective holders.
For more information: Silicon Labs Investor Relations, investor.relations@silabs.com
Silicon Laboratories Inc.
Condensed Consolidated Statements of Operations
(In thousands, except per share data)
(Unaudited)
Three Months Ended
Nine Months Ended
October 3,
2026
October 4,
2025
October 3,
2026
October 4,
2025
Revenues
$ 250,892
$ 205,999
$ 692,581
$ 576,558
Cost of revenues
98,314
86,980
272,331
251,653
Gross profit
152,578
119,019
420,250
324,905
Operating expenses:
Research and development
93,174
87,685
276,784
263,725
Selling, general and administrative
51,453
43,676
163,263
128,469
Operating expenses
144,627
131,361
440,047
392,194
Operating income (loss)
7,951
(12,342)
(19,797)
(67,289)
Other income (expense):
Interest income and other, net
3,185
3,046
9,300
10,672
Interest expense
(226)
(226)
(709)
(761)
Income (loss) before income taxes
10,910
(9,522)
(11,206)
(57,378)
Provision for income taxes
2,059
414
6,432
4,845
Net income (loss)
$ 8,851
$ (9,936)
$ (17,638)
$ (62,223)
Earnings (loss) per share:
Basic
$ 0.27
$ (0.30)
$ (0.53)
$ (1.91)
Diluted
$ 0.26
$ (0.30)
$ (0.53)
$ (1.91)
Weighted-average common shares outstanding:
Basic
33,376
32,835
33,182
32,656
Diluted
33,752
32,835
33,182
32,656
Non-GAAP Financial Measurements
In addition to the GAAP results provided throughout this document, Silicon Labs has provided non-GAAP financial measurements on a basis excluding non-cash and other charges and benefits. Details of these excluded items are presented in the tables below, which reconcile the GAAP results to non-GAAP financial measurements.
The non-GAAP financial measurements do not replace the presentation of Silicon Labs’ GAAP financial results. These measurements provide supplemental information to assist management and investors in analyzing Silicon Labs’ financial position and results of operations. Silicon Labs has chosen to provide this information to investors to enable them to perform meaningful comparisons of past, present and future operating results and as a means to emphasize the results of core on-going operations.
Unaudited Reconciliation of GAAP to Non-GAAP Financial Measures
(In thousands, except per share data)
Three Months Ended
October 3, 2026
Non-GAAP Income Statement Items
GAAP
Measure
GAAP
Percent of
Revenue
Stock
Compensation
Expense
Intangible
Asset
Amortization
Merger-
Related Costs
Non-
GAAP
Measure
Non-GAAP
Percent of
Revenue
Revenues
$ 250,892
Gross profit
152,578
60.8 %
$ 459
$ —
$ —
$153,037
61.0 %
Research and development
93,174
37.1 %
11,996
2,295
3,623
75,260
30.0 %
Selling, general and administrative
51,453
20.5 %
10,594
—
3,281
37,578
15.0 %
Operating expenses
144,627
57.6 %
22,590
2,295
6,904
112,838
45.0 %
Operating income
7,951
3.2 %
23,049
2,295
6,904
40,199
16.0 %
Three Months Ended
October 3, 2026
Non-GAAP Earnings Per Share
GAAP
Measure
Stock
Compensation
Expense*
Intangible
Asset
Amortization*
Merger-
Related Costs*
Income
Tax
Adjustments**
Non-
GAAP
Measure
Net income (loss)
$ 8,851
$ 23,049
$ 2,295
$ 6,904
$ (5,710)
$ 35,389
Diluted shares outstanding
33,752
33,752
Diluted earnings per share
$ 0.26
$ 1.05
* Represents pre-tax amounts
** Represents the application of an 18% non-GAAP tax rate
Silicon Laboratories Inc.
Condensed Consolidated Balance Sheets
(In thousands, except per share data)
(Unaudited)
October 3,
2026
January 3,
2026
Assets
Current assets:
Cash and cash equivalents
$ 423,013
$ 364,222
Short-term investments
16,828
79,400
Accounts receivable, net
79,966
64,513
Inventories
133,391
95,566
Prepaid expenses and other current assets
71,421
70,316
Total current assets
724,619
674,017
Property and equipment, net
131,687
128,643
Goodwill
376,389
376,389
Other intangible assets, net
16,246
23,130
Other assets, net
87,213
67,138
Total assets
$ 1,336,154
$ 1,269,317
Liabilities and Stockholders’ Equity
Current liabilities:
Accounts payable
$ 68,860
$ 50,717
Deferred revenue and returns liability
9,804
5,359
Other current liabilities
78,841
87,711
Total current liabilities
157,505
143,787
Other non-current liabilities
53,267
31,112
Total liabilities
210,772
174,899
Commitments and contingencies
Stockholders’ equity:
Preferred stock – $0.0001 par value; 10,000 shares authorized; no shares issued
—
—
Common stock – $0.0001 par value; 250,000 shares authorized; 33,384 and 32,955
shares issued and outstanding at October 3, 2026 and January 3, 2026, respectively
3
3
Additional paid-in capital
206,203
157,402
Retained earnings
919,176
936,814
Accumulated other comprehensive income
—
199
Total stockholders’ equity
1,125,382
1,094,418
Total liabilities and stockholders’ equity
$ 1,336,154
$ 1,269,317
Silicon Laboratories Inc.
Condensed Consolidated Statements of Cash Flows
(In thousands)
(Unaudited)
Nine Months Ended
October 3,
2026
October 4,
2025
Operating Activities
Net loss
$ (17,638)
$ (62,223)
Adjustments to reconcile net loss to net cash provided by operating activities:
Depreciation of property and equipment
18,154
18,769
Amortization of other intangible assets
6,884
11,074
Stock-based compensation expense
69,754
59,645
Deferred income taxes
2,164
2,026
Changes in operating assets and liabilities:
Accounts receivable
(15,453)
(12,829)
Inventories
(37,828)
23,316
Prepaid expenses and other assets
(35,213)
9,080
Accounts payable
18,373
11,141
Other current liabilities and income taxes
3,271
29,901
Deferred revenue and returns liability
4,445
5,374
Other non-current liabilities
20,285
(7,916)
Net cash provided by operating activities
37,198
87,358
Investing Activities
Purchases of marketable securities
—
(34,790)
Sales of marketable securities
—
15,332
Maturities of marketable securities
62,309
22,598
Purchases of property and equipment
(28,472)
(19,942)
Proceeds from capital-related government incentives
8,705
—
Purchase of other investment
—
(4,000)
Net cash provided by (used in) investing activities
42,542
(20,802)
Financing Activities
Payment of taxes withheld for vested stock awards
(28,710)
(14,907)
Proceeds from the issuance of common stock
7,761
8,147
Net cash used in financing activities
(20,949)
(6,760)
Increase in cash and cash equivalents
58,791
59,796
Cash and cash equivalents at beginning of period
364,222
281,607
Cash and cash equivalents at end of period
$ 423,013
$ 341,403
View original content to download multimedia:https://www.prnewswire.com/news-releases/silicon-labs-reports-third-quarter-2026-results-302935539.html
SOURCE Silicon Labs
Technology
QuickLogic Reports Fiscal Third Quarter 2026 Financial Results
Published
9 minutes agoon
November 10, 2026By

SAN JOSE, Calif., Nov. 10, 2026 /PRNewswire/ — QuickLogic® Corporation (NASDAQ: QUIK) (“QuickLogic” or the “Company”), a developer of embedded FPGA (“eFPGA”) Hard IP, Strategic Radiation Hardened and Antifuse FPGAs, and ruggedized programmable logic solutions, today announced its financial results for the fiscal third quarter ended September 27, 2026.
Recent Highlights
Secured a six-figure eFPGA Hard IP design win for an automotive industrial SoC targeting battery management, precision motor control, and robotic applications on a 16nm process technologyExpanded our eFPGA IP portfolio with a new 12LP core featuring enhanced DSP capabilities, scalability beyond 250,000 LUTs, and optional configuration-bit health monitoring for improved reliability in mission-critical applicationsAppointed James Sullivan as Senior Vice President of Finance and Chief Financial Officer
“Our recent automotive and industrial design win is a strong validation of our eFPGA technology,” said Brian Faith, CEO of QuickLogic. “Combined with our latest eFPGA Hard IP advancements and continued progress on the U.S. strategic radiation-hardened FPGA program, we are building momentum across key areas of our business and anticipate a strong finish to the year.”
Fiscal Third Quarter 2026 Financial Results
Total revenue from continuing operations for the third quarter of fiscal 2026 was $5.1 million, an increase of 153.2% compared with the third quarter of 2025 and a decrease of 6.3% compared with the second quarter of 2026.
New product revenue from continuing operations was approximately $4.0 million for the third quarter of 2026, an increase of $3.1 million, or 324.4%, compared with the third quarter of 2025 and a decrease of $0.6 million, or 13.2%, compared with the second quarter of 2026.
Mature product revenue from continuing operations was $1.1 million for the third quarter of 2026, compared with $1.1 million in the third quarter of 2025 and $0.8 million in the second quarter of 2026.
Third quarter 2026 GAAP gross margin from continuing operations was 37.4%, compared with (23.3%) in the third quarter of 2025 and 43.9% in the second quarter of 2026.
Third quarter 2026 non-GAAP gross margin from continuing operations was 41.0%, compared with (11.9%) in the third quarter of 2025 and 46.8% in the second quarter of 2026.
Third quarter 2026 GAAP operating expenses from continuing operations were $4.0 million, compared with $3.5 million in the third quarter of 2025 and $4.1 million in the second quarter of 2026.
Third quarter 2026 non-GAAP operating expenses from continuing operations were $3.3 million, compared with $2.9 million in the third quarter of 2025 and $3.5 million in the second quarter of 2026.
Third quarter 2026 GAAP net loss was ($2.2 million), or ($0.12) per share, compared with a net loss of ($4.0 million), or ($0.24) per share, in the third quarter of 2025, and a net loss of ($0.9 million), or ($0.05) per share, in the second quarter of 2026.
Third quarter 2026 non-GAAP net loss was ($1.3 million), or ($0.07) per share, compared with a net loss of ($3.2 million), or ($0.19) per share, in the third quarter of 2025, and a net loss of ($1.1 million), or ($0.06) per share, in the second quarter of 2026.
Conference Call
QuickLogic will hold a conference call at 2:30 p.m. Pacific Time / 5:30 p.m. Eastern Time today, November 10, 2026, to discuss its current financial results. The conference call will be webcast on QuickLogic’s IR Site Events Page at https://ir.quicklogic.com/ir-calendar. To join the live conference, you may dial (877) 407-0792 and international participants should dial (201) 689-8263 by 2:20 p.m. Pacific Time. A recording of the call will be available approximately one hour after completion. To access the recording, please call (844) 512-2921 and reference the passcode 13763456.
The call recording, which can be accessed by phone, will be available through November 17, 2026, and the webcast will be available for 12 months on the Company’s website.
About QuickLogic
QuickLogic is a fabless semiconductor company specializing in eFPGA Hard IP, Strategic Radiation Hardened and Antifuse FPGAs, and ruggedized programmable logic solutions. QuickLogic’s unique approach combines cutting-edge technology with open-source tools to deliver highly customizable low-power solutions for aerospace and defense, industrial, computing, and consumer markets. For more information, visit www.quicklogic.com.
QuickLogic uses its website (www.quicklogic.com), its blog (https://www.quicklogic.com/blog/), and LinkedIn page (https://www.linkedin.com/company/13512/) as channels of distribution of information about its products, its planned financial and other announcements, its attendance at upcoming investor and industry conferences, and other matters. Such information may be deemed material information, and QuickLogic may use these channels to comply with its disclosure obligations under Regulation FD. Therefore, investors should monitor the Company’s website and its social media accounts, in addition to following the Company’s press releases, SEC filings, public conference calls, and webcasts.
Non-GAAP Financial Measures
QuickLogic reports financial information in accordance with United States Generally Accepted Accounting Principles (“GAAP”), but believes that non-GAAP financial measures are helpful in evaluating its operating results and comparing its performance to comparable companies. Accordingly, the Company excludes certain charges related to stock-based compensation, impairment charges, and restructuring costs, as well as significant non-recurring gains, in calculating non-GAAP (i) operating expenses, (ii) income (loss) from operations, (iii) net income (loss), (iv) net income (loss) per share, and (v) cost of revenue and gross margin percentage. The Company provides this non-GAAP information to enable investors to evaluate its operating results in a manner consistent with how the Company analyzes its operating results and to provide consistency and comparability with similar companies in the Company’s industry.
Management uses the non-GAAP measures, which exclude gains, losses, and other charges that are considered by management to be outside of the Company’s core operating results, internally to evaluate its operating performance against results in prior periods and its operating plans and forecasts. In addition, the non-GAAP measures are used to plan for the Company’s future periods and serve as a basis for the allocation of the Company’s resources, management of operations and the measurement of profit-dependent cash flows, and equity compensation paid to employees and executive officers.
Investors should note, however, that the non-GAAP financial measures used by QuickLogic may not be the same non-GAAP financial measures and may not be calculated in the same manner as that of other companies. QuickLogic does not, nor does it suggest that investors should, consider such non-GAAP financial measures alone or as a substitute for financial information prepared in accordance with GAAP. A reconciliation of GAAP financial measures to non-GAAP financial measures is included in the financial statements portion of this press release. Investors are encouraged to review the related GAAP financial measures and the reconciliation of non-GAAP financial measures with their most directly comparable GAAP financial measures.
Forward Looking Statements
This press release contains forward-looking statements within the meaning of the Private Securities Litigation Reform Act of 1995. These forward-looking statements include, without limitation, statements regarding the Company’s future profitability, revenue growth, and cash flows, expectations regarding its future business and statements regarding the timing, milestones, and payments related to its government contracts, statements regarding expected contracts and the expected magnitude of such contracts, and statements regarding expected adoption rates and/or orders by customers. Actual results may differ due to a variety of factors including: delays in the market acceptance of the Company’s new products; the ability to convert design opportunities into customer revenue; the ability to replace revenue from end-of-life products; the level and timing of customer design activity; the market acceptance of the Company’s customers’ products; the risk that orders may not result in future revenue; ability to introduce and produce new products based on advanced wafer technology on a timely basis; ability to adequately market the low power, competitive pricing, and short time-to-market of the Company’s new products; intense competition; ability to hire and retain qualified personnel; changes in product demand or supply; general economic conditions; political events, international trade disputes, natural disasters, and other business interruptions that could disrupt supply or delivery of, or demand for, the Company’s products; and changes in tax rates and exposure to additional tax liabilities. These and other potential factors and uncertainties that could cause actual results to differ materially from the results contemplated or implied are described in more detail in the Company’s public reports filed with the U.S. Securities and Exchange Commission (the “SEC”), including the risks discussed in the “Risk Factors” section in the Company’s Annual Reports on Form 10-K and Quarterly Reports on Form 10-Q, as well as disclosed in the Company’s prior press releases, which are available on the Company’s Investor Relations website at http://ir.quicklogic.com/ and on the SEC website at www.sec.gov/. In addition, please note that the date of this press release is November 10, 2026, and any forward-looking statements contained herein are based on management’s current expectations and assumptions that the Company believes to be reasonable as of this date. QuickLogic is not obliged to update these statements even as new information becomes available or other events occur in the future.
QuickLogic and logo are registered trademarks of QuickLogic. All other trademarks are the property of their respective holders and should be treated as such.
CODE: QUIK-E
–Tables Follow –
QUICKLOGIC CORPORATION
CONDENSED CONSOLIDATED STATEMENTS OF OPERATIONS
(in thousands, except per share amounts)
(Unaudited)
Three Months Ended
Nine Months Ended
September
27, 2026
September
28, 2025
June 28,
2026
September
27, 2026
September
28, 2025
Revenue
$
5,138
$
2,029
$
5,482
$
15,671
$
10,041
Cost of revenue
3,217
2,501
3,075
9,501
7,682
Gross profit (loss)
1,921
(472)
2,407
6,170
2,359
Operating expenses:
Research and development
1,491
1,398
1,556
4,559
3,859
Selling, general and administrative
2,512
2,057
2,552
7,501
6,555
Impairment charges
—
—
—
—
300
Restructuring costs
34
—
16
61
75
Total operating expenses
4,037
3,455
4,124
12,121
10,789
Operating income (loss)
(2,116)
(3,927)
(1,717)
(5,951)
(8,430)
Interest expense
(39)
(87)
(71)
(164)
(292)
Interest income and other income (expense), net
(16)
9
(41)
(90)
(28)
Gain on extinguishment of vendor payable
—
—
950
950
—
Income (loss) from continuing operations before
income taxes
(2,171)
(4,005)
(879)
(5,255)
(8,750)
(Benefit from) provision for income taxes
8
(1)
3
8
5
Net income (loss) from continuing operations
(2,179)
(4,004)
(882)
(5,263)
(8,755)
Net income (loss) from discontinued operations, net
of taxes and inclusive of $87 in restructuring
costs for the nine months ended September 28,
2025
(4)
(3)
(5)
(13)
(113)
Net income (loss)
$
(2,183)
$
(4,007)
$
(887)
$
(5,276)
$
(8,868)
Net income (loss) from continuing operations per
share:
Basic
$
(0.12)
$
(0.24)
$
(0.05)
$
(0.29)
$
(0.55)
Diluted
$
(0.12)
$
(0.24)
$
(0.05)
$
(0.29)
$
(0.55)
Net income (loss) per share:
Basic
$
(0.12)
$
(0.24)
$
(0.05)
$
(0.29)
$
(0.56)
Diluted
$
(0.12)
$
(0.24)
$
(0.05)
$
(0.29)
$
(0.56)
Weighted average shares outstanding:
Basic
18,419
16,516
18,110
17,999
15,957
Diluted
18,419
16,516
18,110
17,999
15,957
Note: Income taxes related to discontinued operations were immaterial in nature for the periods presented and as such, only net income (loss) from discontinued operations was reported herein.
QUICKLOGIC CORPORATION
CONDENSED CONSOLIDATED BALANCE SHEETS
(in thousands)
(Unaudited)
September 27,
2026
December 28,
2025
ASSETS
Current assets:
Cash and cash equivalents
$
19,199
$
18,840
Accounts receivable, net
1,030
2,809
Contract assets
335
217
Inventories
938
956
Prepaid expenses and other
2,308
1,399
Assets of business held for disposal, net
—
2
Total current assets
23,810
24,223
Property and equipment, net
16,197
18,233
Capitalized internal-use software, net
1,429
1,117
Right of use assets, net
226
464
Intangible assets, net
310
339
Inventories
—
187
Other assets
266
241
TOTAL ASSETS
$
42,238
$
44,804
LIABILITIES AND STOCKHOLDERS’ EQUITY
Current liabilities:
Revolving line of credit
$
5,000
$
15,000
Trade payables
2,235
2,251
Accrued liabilities
1,732
1,779
Deferred revenue
786
64
Notes payable, current
1,466
1,870
Lease liabilities, current
218
321
Total current liabilities
11,437
21,285
Long-term liabilities:
Lease liabilities
—
126
Notes payable
823
926
Total liabilities
12,260
22,337
Stockholders’ equity:
Preferred stock, $0.001 par value; 10,000 shares authorized; no shares issued and
outstanding
—
—
Common stock, $0.001 par value; 200,000 authorized; 18,754 and 17,290 shares issued
and outstanding as of September 27, 2026 and December 28, 2025, respectively
19
17
Additional paid-in capital
359,447
346,662
Accumulated deficit
(329,488)
(324,212)
Total stockholders’ equity
29,978
22,467
TOTAL LIABILITIES AND STOCKHOLDERS’ EQUITY
$
42,238
$
44,804
QUICKLOGIC CORPORATION
SUPPLEMENTAL RECONCILIATIONS OF GAAP AND NON-GAAP FINANCIAL MEASURES
(in thousands, except per share amounts and percentages)
(Unaudited)
Three Months Ended
Nine Months Ended
September
27, 2026
September
28, 2025
June 28,
2026
September
27, 2026
September
28, 2025
GAAP operating income (loss)
$
(2,116)
$
(3,927)
$
(1,717)
$
(5,951)
$
(8,430)
Adjustment for stock-based compensation within:
Cost of revenue
184
231
158
498
578
Research and development
134
96
139
481
443
Selling, general and administrative
572
501
457
1,523
1,586
Adjustment for impairment charges
—
—
—
—
300
Adjustment for restructuring costs
34
—
16
61
75
Non-GAAP operating income (loss)
$
(1,192)
$
(3,099)
$
(947)
$
(3,388)
$
(5,448)
GAAP net income (loss) from continuing
operations
$
(2,179)
$
(4,004)
$
(882)
$
(5,263)
$
(8,755)
Adjustment for stock-based compensation within:
Cost of revenue
184
231
158
498
578
Research and development
134
96
139
481
443
Selling, general and administrative
572
501
457
1,523
1,586
Adjustment for impairment charges
—
—
—
—
300
Adjustment for restructuring costs
34
—
16
61
75
Adjustment for significant non-recurring gain
—
—
(950)
(950)
—
Non-GAAP net income (loss) from continuing
operations
$
(1,255)
$
(3,176)
$
(1,062)
$
(3,650)
$
(5,773)
GAAP net income (loss) from discontinued
operations
$
(4)
$
(3)
$
(5)
$
(13)
$
(113)
Adjustment for stock-based compensation within:
Research and development
—
—
—
—
(32)
Adjustment for restructuring costs
—
—
—
—
87
Non-GAAP net income (loss) from discontinued
operations
$
(4)
$
(3)
$
(5)
$
(13)
$
(58)
Non-GAAP net income (loss)
$
(1,259)
$
(3,179)
$
(1,067)
$
(3,663)
$
(5,831)
GAAP net income (loss) from continuing
operations per share, basic
$
(0.12)
$
(0.24)
$
(0.05)
$
(0.29)
$
(0.55)
Adjustment for stock-based compensation
0.05
0.05
0.04
0.14
0.16
Adjustment for impairment charges
—
—
—
—
0.02
Adjustment for restructuring costs
—
—
—
—
0.01
Adjustment for significant non-recurring gain
—
—
(0.05)
(0.05)
—
Non-GAAP net income (loss) from continuing
operations per share, basic
$
(0.07)
$
(0.19)
$
(0.06)
$
(0.20)
$
(0.36)
GAAP net income (loss) from discontinued
operations per share, basic
$
—
$
—
$
—
$
—
$
(0.01)
Adjustment for stock-based compensation
—
—
—
—
—
Adjustment for restructuring costs
—
—
—
—
0.01
Non-GAAP net income (loss) from discontinued
operations per share, basic
$
—
$
—
$
—
$
—
$
—
Non-GAAP net income (loss) per share, basic
$
(0.07)
$
(0.19)
$
(0.06)
$
(0.20)
$
(0.36)
GAAP net income (loss) from continuing
operations per share, diluted
$
(0.12)
$
(0.24)
$
(0.05)
$
(0.29)
$
(0.55)
Adjustment for stock-based compensation
0.05
0.05
0.04
0.14
0.16
Adjustment for impairment charges
—
—
—
—
0.02
Adjustment for restructuring costs
—
—
—
—
0.01
Adjustment for significant non-recurring gain
—
—
(0.05)
(0.05)
—
Non-GAAP net income (loss) from continuing
operations per share, diluted
$
(0.07)
$
(0.19)
$
(0.06)
$
(0.20)
$
(0.36)
GAAP net income (loss) from discontinued
operations per share, diluted
$
—
$
—
$
—
$
—
$
(0.01)
Adjustment for stock-based compensation
—
—
—
—
—
Adjustment for restructuring costs
—
—
—
—
0.01
Non-GAAP net income (loss) from discontinued
operations per share, diluted
$
—
$
—
$
—
$
—
$
—
Non-GAAP net income (loss) per share, diluted
$
(0.07)
$
(0.19)
$
(0.06)
$
(0.20)
$
(0.36)
GAAP gross margin percentage from continuing
operations
37.4
%
(23.3)
%
43.9
%
39.4
%
23.5
%
Adjustment for stock-based compensation included
in cost of revenue
3.6
%
11.4
%
2.9
%
3.1
%
5.8
%
Non-GAAP gross margin percentage from
continuing operations
41.0
%
(11.9)
%
46.8
%
42.5
%
29.3
%
QUICKLOGIC CORPORATION
SUPPLEMENTAL DATA
(Unaudited)
Percentage of Revenue
Change in Revenue
Q3 2026
Q3 2025
Q2 2026
Q3 2026 to
Q3 2025
Q3 2026 to
Q2 2026
COMPOSITION OF REVENUE
Revenue by product: (1)
New products
79
%
47
%
85
%
324
%
(13)
%
Mature products
21
%
53
%
15
%
2
%
33
%
Revenue by geography:
Asia Pacific
9
%
47
%
8
%
(53)
%
1
%
North America
85
%
51
%
88
%
323
%
(9)
%
Europe
6
%
2
%
4
%
736
%
54
%
(1)
New products include all products manufactured on 180 nanometer or smaller semiconductor processes, and eFPGA IP and related professional services. Mature products include all products produced on semiconductor processes larger than 180 nanometer. Associated royalty revenues are included within their respective device’s classification. The Company notes it did not recognize revenue at the SensiML entity held for disposal during the periods presented herein.
View original content to download multimedia:https://www.prnewswire.com/news-releases/quicklogic-reports-fiscal-third-quarter-2026-financial-results-302935485.html
SOURCE QuickLogic Corporation
Technology
Resideo Announces Third Quarter 2026 Financial Results and Updates 2026 Outlook
Published
9 minutes agoon
November 10, 2026By

Total revenue of $727 million, up 3% year-over-year, and revenue excluding OEM Security up 6% year-over-yearGross margin of 40.4%, marking the 14th consecutive quarter of year-over-year gross margin expansionGAAP income from continuing operations, net of taxes, of $31 million, down 66% compared to $90 million in third quarter of 2025; Standalone Adjusted EBITDA (1)of $154 million, up 5% year-over-yearGAAP diluted EPS from continuing operations of $0.14, down 71% year-over-year; Standalone Adjusted diluted EPS (1)of $0.52, up 8% year-over-yearRepaid $1.1 billion of gross debt; total gross debt of $2.1 billion at end of third quarter
SCOTTSDALE, Ariz., Nov. 10, 2026 /PRNewswire/ — Resideo Technologies, Inc. (NYSE: REZI), a leading global developer and manufacturer of critical control and sensing solutions for residential markets, today announced financial results for the third fiscal quarter ended October 3, 2026.
Management Remarks
“Resideo delivered top and bottom line third quarter results that were near the high end of our outlook ranges in our first quarter following the separation of ADI, underscoring our team’s continued strong execution. We achieved 3% revenue growth year-over-year across all sales channels and 6% growth year-over-year excluding OEM Security, driven by customer demand for our differentiated, non-discretionary products. We also reduced our debt by $1.1 billion, using the $900 million dividend received from ADI and $200 million of cash on hand,” said Tom Surran, Resideo’s President and CEO.
“We remain focused on creating value for our customers with our differentiated products and services. That includes new AI-powered capabilities on our next-generation FORTIQ software platform, which delivers actionable intelligence that enhances customer productivity and optimizes the end-user’s experience. We are executing on our strategic priorities with discipline and consistency, creating positive momentum in a soft housing market and a dynamic macro environment.”
Third Quarter 2026 Financial Highlights
Total revenue of $727 million was up 3% compared to $703 million in the third quarter of 2025, and includes an unfavorable impact of approximately 50 basis points from foreign currency exchange. Total revenue was near the high-end of the provided outlook range for the third quarter of 2026.
Revenue excluding OEM Security of $694 million, was up 6% compared to $653 million in the third quarter of 2025, and grew year-over-year across all of our sales channels and product categories due to volume, driven by customer demand for our products, and pricing. OEM Security revenue of $33 million was down 34% compared to $50 million in the third quarter of 2025, and declined as expected due to reduced volumes from a large OEM Security customer.
Gross margin of 40.4%, marking the 14th consecutive quarter of year-over-year gross margin expansion. Gains from price increases, operational efficiencies, and tariff refunds were partially offset by unfavorable product sales mix and inflationary input costs.
Research and development expenses increased $4 million from the third quarter of 2025 driven by investments in new product launches to drive future growth. Selling, general and administrative expenses increased $24 million from the third quarter of 2025, driven primarily by $30 million of non-recurring business separation expenses associated with the ADI Spin-Off. Restructuring, impairment and extinguishment expenses increased $17 million from the third quarter of 2025 due to continued manufacturing operations optimization and higher debt extinguishment charges.
GAAP income from continuing operations, net of taxes, of $31 million was down 66% compared to $90 million in the third quarter 2025. Standalone Adjusted EBITDA(1) of $154 million was up 5% compared to $146 million in the third quarter of 2025, primarily due to higher gross profit dollars and controlled growth in operating expenses. Standalone Adjusted EBITDA was near the high-end of the provided outlook range for the third quarter of 2026.
Cash Flow and Liquidity
Net cash provided by operating activities of continuing operations was $33 million in the third quarter 2026 compared to net cash used by operating activities of continuing operations of $1.59 billion in the third quarter of 2025. The increase in cash provided by operations was primarily due to the $1.59 billion payment made in the third quarter of 2025 to Honeywell to terminate the Indemnification Agreement.
In connection with the ADI Spin-Off, Resideo received a $900 million cash dividend from ADI as partial consideration for the assets transferred in the ADI Spin-Off. We used this dividend, along with $200 million of cash on hand to repay $1.1 billion of gross debt during the third quarter. We also made a $20 million payment to ADI as part of the post-separation adjustment mechanism to true up cash. At October 3, 2026, Resideo had cash and cash equivalents of $229 million and total outstanding gross debt of $2.1 billion.
In connection with the completion of the ADI Spin-Off, Resideo’s outstanding Series A Cumulative Convertible Participating Preferred Stock (“Preferred Stock”) was reduced by 150,000 shares, leaving 350,000 shares outstanding, with a proportional adjustment to the conversion price and an ongoing smaller quarterly dividend payable on Resideo’s Preferred Stock.
ADI Spin-Off and Discontinued Operations
On August 3, 2026, Resideo completed the separation of its former ADI Global Distribution segment by distributing to Resideo common shareholders on a pro rata basis all of the issued and outstanding common stock of ADI Global Distribution Inc., the entity incorporated to hold the ADI business (the “ADI Spin-Off”). As a result of the ADI Spin-Off, we present the historical results of the ADI business as discontinued operations in our financial statements.
Outlook
The following table summarizes Resideo’s fourth quarter 2026 and updated full year 2026 outlook:
($ in millions, except per share data)
Q4 2026
2026
Revenue
$710 – $730
$2,927 – $2,947
Standalone Adjusted EBITDA (1)
$145 – $155
$614 – $624
Standalone Adjusted Earnings Per Share (1)
$0.42 – $0.48
$1.92 – $1.98
Full Year Cash Provided by Operating Activities
At least $165
Conference Call and Webcast Details
Resideo will hold a conference call with investors on November 10, 2026, at 5:00 p.m. ET. The webcast can be accessed at https://investor.resideo.com, where the webcast link and related materials will be posted before the call. A replay of the webcast will be available following the presentation.
About Resideo
Resideo is a global building technologies company that is a leading developer and manufacturer of critical control and sensing solutions for residential markets. The company serves professional installers and integrators across diverse product categories, such as heating, ventilation, and air conditioning controls, combustion, life safety, security, and water. Its comfort and protection solutions can be found in more than 150 million residential and commercial spaces globally, with tens of millions of new devices sold annually. More information about Resideo and its trusted brands, including BRK, First Alert, and Honeywell Home, is available at resideo.com.
(1)
This press release includes certain Non-GAAP financial measures, including Adjusted EBITDA, Adjusted Net Income, Adjusted Diluted EPS, and other supplemental financial measures we denote as “Standalone” measures, including Standalone Adjusted EBITDA, Standalone Adjusted Net Income and Standalone Adjusted Diluted EPS, which are presented as if the ADI Spin-Off had occurred and Resideo was operating as a separate, independent company for all periods presented. See the section herein titled “Use of Non-GAAP and Standalone Supplemental Financial Measures” for more information.
Contacts:
Investors:
Media:
Christopher T. Lee
Kevin Hunt
Global Head of Strategic Finance
Director, Corporate Communications
Forward-Looking Statements
This press release and the related conference call contain “forward-looking statements” within the meaning of the Private Securities Litigation Reform Act of 1995. All statements, other than statements of historical fact, that address activities, events or developments that we or our management intend, expect, project, believe or anticipate will or may occur in the future are forward-looking statements, including statements regarding our fourth quarter 2026 and full year 2026 outlook, our capital allocation and deleveraging plans, the expected benefits of the ADI Spin-Off, operational efficiency improvement, and the development, launch and adoption of new products and capabilities. Although we believe forward-looking statements are based upon reasonable assumptions, such statements involve known and unknown risks and uncertainties, which may cause the actual results or performance of Resideo Technologies, Inc. (“Resideo” or the “Company”) to differ materially from such forward-looking statements.
Such risks and uncertainties include, but are not limited to, our ability to achieve our outlook regarding the fourth quarter 2026 and full year 2026; the ability of Resideo to drive increased customer value and financial returns and enhance strategic and operational capabilities, including through our product offerings, services, ability to compete, and manage any expected OEM Security impacts; risks and uncertainties relating to tariffs that have been or may be imposed by the United States and other governments including the timing, amount and recoverability of tariff refunds or claims in relation to refunds; risks related to our ability to achieve some or all of the expected benefits of the ADI Spin-Off, our dependence on transition services, the commercial product purchase agreement and other arrangements with ADI, our dependence on a select group of large customers, and changes to our capital structure, leverage and liquidity resulting from the ADI Spin-Off; our ability to repay outstanding debt obligations on the timing we anticipate or at all; macroeconomic conditions, including housing market fluctuations, interest rates, inflation, repair and remodeling and construction activity, costs of raw materials and components, and fuel and shipping costs; our ability to implement pricing actions; seasonal fluctuations and weather conditions affecting demand for our products; ability to successfully execute restructuring and productivity initiatives; and the other risks described under the headings “Risk Factors” and “Cautionary Statement Concerning Forward-Looking Statements” in our Annual Report on Form 10-K for the year ended December 31, 2025, our subsequent Quarterly Reports on Form 10-Q, and other periodic filings we make from time to time with the Securities and Exchange Commission. Forward-looking statements are not guarantees of future performance, and actual results, developments, and business decisions may differ from those envisaged by our forward-looking statements.
Except as required by law, we undertake no obligation to update such statements to reflect events or circumstances arising after the date of this press release and we caution investors not to place undue reliance on any such forward-looking statements.
Use of Non-GAAP and Standalone Supplemental Financial Measures
This press release includes certain “Non-GAAP financial measures” as defined under the Securities Exchange Act of 1934 and in accordance with regulations issued thereunder, including Adjusted EBITDA, Adjusted Net Income, and Adjusted Diluted EPS, as well as other supplemental financial measures we denote as “Standalone” measures, including Standalone Adjusted EBITDA, Standalone Adjusted Net Income and Standalone Adjusted Diluted EPS, which are presented as if the ADI Spin-Off had occurred and Resideo was operating as a separate, independent company for all periods presented. Management believes the use of such Non-GAAP and supplemental financial measures assists investors and our management in understanding the ongoing operating performance of the Company by presenting financial results between periods on a more comparable basis. Such Non-GAAP and supplemental financial measures should not be construed as an alternative to reported results determined in accordance with U.S. GAAP. Readers should also consider the limitations associated with these Non-GAAP and supplemental financial measures, including the potential lack of comparability of these measures from one company to another.
We have included reconciliations of these Non-GAAP and supplemental financial measures to the most directly comparable financial measures calculated and provided in accordance with U.S. GAAP at the end of this release. A reconciliation of the Non-GAAP and supplemental financial measures included as part of the outlook provided herein is not included in this release due to the number of variables in the projected range as part of such outlook and because we are currently unable to quantify accurately without unreasonable efforts certain amounts that would be required to be included in the U.S. GAAP measure or the individual adjustments for such reconciliation, including the timing and amount of restructuring, impairment and extinguishment costs, business separation costs, litigation settlements, and other non-recurring items and the related tax effects. In addition, we believe such reconciliation would imply a degree of precision that would be confusing or misleading to investors. Amounts presented in this press release may not sum due to rounding.
CONDENSED CONSOLIDATED BALANCE SHEETS
(UNAUDITED)
(in millions, except par value)
October 3, 2026
December 31, 2025
ASSETS
Current assets:
Cash and cash equivalents
$ 229
$ 537
Accounts receivable, net
507
414
Inventory
393
318
Other current assets
110
116
Current assets of discontinued operations
—
1,973
Total current assets
1,239
3,358
Property, plant and equipment, net
336
340
Goodwill
2,026
2,036
Intangible assets, net
341
347
Other assets
198
257
Non-current assets of discontinued operations
—
2,095
Total assets
$ 4,140
$ 8,433
LIABILITIES AND STOCKHOLDERS’ EQUITY
Current liabilities:
Accounts payable
$ 491
$ 414
Accrued liabilities
379
430
Current liabilities of discontinued operations
—
911
Total current liabilities
870
1,755
Long-term debt
2,074
3,167
Non-current obligations payable under the Honeywell Tax Matters Agreement
—
88
Other long-term liabilities
249
257
Non-current liabilities of discontinued operations
—
249
Total liabilities
3,193
5,516
Stockholders’ equity:
Preferred stock, $0.001 par value: 100 shares authorized, 0.35 shares issued and
outstanding, and $350 liquidation preference at October 3, 2026 and 0.5 shares
issued and outstanding, and $500 liquidation preference at December 31, 2025
337
482
Common stock, $0.001 par value: 700 shares authorized, 161 and 152 shares issued
and outstanding at October 3, 2026, respectively, and 158 and 150 shares issued and
outstanding at December 31, 2025, respectively
—
—
Additional paid-in capital
2,352
2,391
Retained (deficit) earnings
(1,413)
345
Accumulated other comprehensive loss
(146)
(157)
Treasury stock at cost
(183)
(144)
Total stockholders’ equity
947
2,917
Total liabilities and stockholders’ equity
$ 4,140
$ 8,433
CONDENSED CONSOLIDATED STATEMENTS OF OPERATIONS
(UNAUDITED)
Three Months Ended
Nine Months Ended
(in millions, except per share data)
October 3,
2026
September 27,
2025
October 3,
2026
September 27,
2025
Revenue
$ 727
$ 703
$ 2,217
$ 2,108
Cost of goods sold
433
419
1,325
1,270
Gross profit
294
284
892
838
Operating expenses:
Research and development expenses
37
33
110
91
Selling, general and administrative expenses
159
135
445
403
Intangible asset amortization
6
7
19
21
Restructuring, impairment and extinguishment costs
20
3
43
4
Total operating expenses
222
178
617
519
Operating income
72
106
275
319
Indemnification Agreement expense (1)
—
—
—
972
Other expense (income), net (2)
3
6
(80)
23
Interest expense, net
31
30
97
81
Income (loss) from continuing operations before taxes
38
70
258
(757)
Provision (benefit) for income taxes
7
(20)
88
(22)
Income (loss) from continuing operations, net of taxes
31
90
170
(735)
Income (loss) from discontinued operations, net of taxes
(9)
66
(13)
72
Net income (loss)
22
156
157
(663)
Less: preferred stock dividends
7
9
24
26
Less: undistributed income allocated to preferred stockholders
2
16
15
—
Net income (loss) available to common stockholders
$ 13
$ 131
$ 118
$ (689)
Income (loss) from continuing operations, net of taxes, available to common
stockholders
$ 22
$ 75
$ 135
$ (753)
Income (loss) from discontinued operations, net of taxes, available to common
stockholders
(9)
56
(17)
64
Net income (loss) available to common stockholders
$ 13
$ 131
$ 118
$ (689)
Income (loss) from continuing operations, net of taxes
$ 31
$ 90
$ 170
$ (735)
Less: preferred stock dividends
6
6
18
18
Less: undistributed income allocated to preferred stockholders
3
9
17
—
Income (loss) from continuing operations, net of taxes, available to common
stockholders
$ 22
$ 75
$ 135
$ (753)
Income (loss) from discontinued operations, net of taxes
$ (9)
$ 66
$ (13)
$ 72
Less: preferred stock dividends
1
3
6
8
Less: undistributed (loss) income allocated to preferred stockholders
(1)
7
(2)
—
Income (loss) from discontinued operations, net of taxes, available to common
stockholders
$ (9)
$ 56
$ (17)
$ 64
Net income (loss) available to common stockholders
$ 13
$ 131
$ 118
$ (689)
Earnings (loss) per common share:
Basic earnings (loss) per share from continuing operations
$ 0.14
$ 0.50
$ 0.89
$ (5.05)
Basic earnings (loss) per share from discontinued operations
(0.06)
0.38
(0.11)
0.43
Basic earnings (loss) per share attributable to common shareholders
$ 0.08
$ 0.88
$ 0.78
$ (4.62)
Diluted earnings (loss) per share from continuing operations
$ 0.14
$ 0.49
$ 0.88
$ (5.05)
Diluted earnings (loss) per share from discontinued operations
(0.06)
0.36
(0.11)
0.43
Diluted earnings (loss) per share attributable to common shareholders
$ 0.08
$ 0.85
$ 0.77
$ (4.62)
Weighted average common shares outstanding:
Basic
152
149
151
149
Diluted
154
154
154
149
(1)
Represents the expense incurred pursuant to the Indemnification Agreement, which, prior to its termination, we paid our regularly scheduled payments of $70 million during 2025.
(2)
For the nine months ended October 3, 2026, Other expense (income), net, primarily represents the $77 million gain recognized pursuant to the termination of the Honeywell Tax Matters Agreement.
CONDENSED CONSOLIDATED STATEMENTS OF CASH FLOWS
(UNAUDITED)
Three Months Ended
Nine Months Ended
(in millions)
October 3,
2026
September 27,
2025
October 3,
2026
September 27,
2025
Cash Flows From Operating Activities:
Net income (loss)
$ 22
$ 156
$ 157
$ (663)
Income (loss) from discontinued operations, net of taxes
(9)
66
(13)
72
Income (loss) from continuing operations, net of taxes
31
90
170
(735)
Adjustments to reconcile net income (loss) from continuing operations to net
cash from operating activities:
Depreciation and amortization
21
21
64
60
Restructuring, impairment and extinguishment costs
20
3
43
4
Stock-based compensation expense
10
10
30
30
Deferred income taxes
—
—
44
(26)
Other, net
1
(11)
—
(2)
Changes in assets and liabilities:
Accounts receivable, net
(48)
(18)
(102)
(9)
Inventory
(59)
(7)
(80)
(9)
Other current assets
(3)
1
5
(14)
Accounts payable
71
(1)
75
(30)
Accrued liabilities
(4)
(99)
(53)
(9)
Non-current obligations payable under the Honeywell Tax Matters Agreement
—
—
(88)
—
Non-current obligations payable under the Indemnification Agreement
—
(1,625)
—
(723)
Other non-current, net
(7)
47
3
7
Net cash provided by (used in) continuing operations operating activities
33
(1,589)
111
(1,456)
Net cash (used in) provided by discontinued operations operating activities
(32)
18
(107)
20
Net cash provided by (used in) operating activities
1
(1,571)
4
(1,436)
Cash Flows From Investing Activities:
Capital expenditures
(22)
(13)
(62)
(43)
Other investing activities, net
—
—
10
—
Net cash used in continuing operations investing activities
(22)
(13)
(52)
(43)
Net cash used in discontinued operations investing activities
(5)
(15)
(30)
(36)
Net cash used in investing activities
(27)
(28)
(82)
(79)
Cash Flows From Financing Activities:
Proceeds from issuance of long-term debt
—
1,198
—
1,198
Repayments of long-term debt
(1,100)
—
(1,109)
(3)
Payments of debt facility issuance and modification costs
—
(1)
—
(23)
Acquisition of treasury stock to cover stock award tax withholding
(6)
(7)
(39)
—
Preferred stock dividend payments
(8)
(6)
(20)
(18)
Cash dividend received from ADI in connection with the ADI Spin-Off
900
—
900
—
Cash paid to ADI in connection with the ADI Spin-Off
(20)
—
(20)
—
Other financing activities, net
1
11
3
13
Net cash (used in) provided by continuing operations financing activities
(233)
1,195
(285)
1,167
Net cash used in discontinued operations financing activities
(454)
(3)
(60)
(8)
Net cash (used in) provided by financing activities
(687)
1,192
(345)
1,159
Effect of foreign exchange rate changes on cash, cash equivalents and restricted
cash
(6)
(1)
(9)
9
Net decrease in cash, cash equivalents and restricted cash
(719)
(408)
(432)
(347)
Cash, cash equivalents and restricted cash at beginning of period
949
754
662
693
Less: cash, cash equivalents and restricted cash of discontinued operations
—
93
—
93
Cash, cash equivalents and restricted cash of continuing operations at end of
period
$ 230
$ 253
$ 230
$ 253
NON-GAAP FINANCIAL MEASURES AND RECONCILIATIONS
ADJUSTED NET INCOME AND ADJUSTED DILUTED EARNINGS PER SHARE
(UNAUDITED)
Three Months Ended
Nine Months Ended
(in millions, except per share data)
October 3,
2026
September 27,
2025
October 3,
2026
September 27,
2025
GAAP Net income (loss) from continuing operations
$ 31
$ 90
$ 170
$ (735)
Less: preferred stock dividends
6
6
18
18
Less: undistributed income allocated to preferred stockholders
3
9
17
—
GAAP Net income (loss) from continuing operations available to
common stockholders
$ 22
$ 75
$ 135
$ (753)
Indemnification Agreement expense (1)
—
—
—
972
One-time tax impact of Indemnification Agreement
—
(34)
—
(78)
Termination of the Honeywell Tax Matters Agreement (2)
—
—
(33)
—
Intangible asset amortization
6
7
19
21
Business separation costs
30
—
30
—
Restructuring, impairment and extinguishment costs
20
3
43
4
Stock-based compensation expense
10
10
30
30
Litigation settlement
—
—
18
—
Undistributed income allocated to preferred stockholders
3
9
17
—
Other (3)
4
6
(1)
24
Tax effect of applicable non-GAAP adjustments (4)
(15)
(7)
(32)
(20)
Adjusted Net income
$ 80
$ 69
$ 226
$ 200
Non-recurring standalone adjustments, net of taxes (5)
—
5
5
14
Standalone Adjusted Net Income From Continuing Operations
$ 80
$ 74
$ 231
$ 214
Three Months Ended
Nine Months Ended
October 3,
2026
September 27,
2025
October 3,
2026
September 27,
2025
Net income (loss) from continuing operations available to common
shareholders per diluted common share
$ 0.14
$ 0.49
$ 0.88
$ (4.99)
Indemnification Agreement expense (1)
—
—
—
6.44
One-time tax impact of Indemnification Agreement
—
(0.22)
—
(0.52)
Termination of the Honeywell Tax Matters Agreement (2)
—
—
(0.21)
—
Intangible asset amortization
0.04
0.05
0.12
0.14
Business separation costs
0.19
—
0.19
—
Restructuring, impairment and extinguishment costs
0.13
0.02
0.28
0.03
Stock-based compensation expense
0.06
0.06
0.19
0.20
Litigation settlement
—
—
0.12
—
Undistributed income allocated to preferred stockholders
0.02
0.06
0.11
—
Other (3)
0.03
0.04
(0.01)
0.16
Tax effect of applicable non-GAAP adjustments (4)
(0.09)
(0.05)
(0.21)
(0.13)
Adjusted Diluted Earnings Per Share
$ 0.52
$ 0.45
$ 1.46
$ 1.33
Non-recurring standalone adjustments, net of taxes (5)
—
0.03
0.04
0.09
Standalone Adjusted Diluted Earnings Per Share
$ 0.52
$ 0.48
$ 1.50
$ 1.42
(1)
Refer to the Unaudited Consolidated Statements of Operations herein.
(2)
We recognized a gain of $77 million in Other income and derecognized $44 million of deferred tax assets that were no longer realizable to Income tax expense in connection with the termination of the Honeywell Tax Matters Agreement.
(3)
Other includes net periodic pension benefit costs, excluding service costs, foreign exchange transaction loss (income), gain on sale of assets and miscellaneous other non-recurring, non-operating income and loss.
(4)
We calculate the tax effect of relevant non-GAAP adjustments by applying a flat statutory tax rate of 25% for all non-deductible and taxable adjustments.
(5)
Reflects methodology differences between continuing operations basis of accounting and Standalone results (e.g., executive compensation for certain executives who transferred to ADI as part of the separation or retired from Resideo is wholly retained in continuing operations). Standalone results are intended to present historical results as if the ADI Spin-Off had occurred and Resideo was operating as a separate, independent company for all periods presented.
NON-GAAP FINANCIAL MEASURES AND RECONCILIATIONS
GAAP NET INCOME AND ADJUSTED EBITDA
(UNAUDITED)
Three Months Ended
Nine Months Ended
(in millions)
October 3,
2026
September 27,
2025
October 3,
2026
September 27,
2025
Revenue
$ 727
$ 703
$ 2,217
$ 2,108
GAAP Net income (loss) from continuing operations
$ 31
$ 90
$ 170
$ (735)
GAAP Net income (loss) from continuing operations as a
% of revenue
4.3 %
12.8 %
7.7 %
(34.9) %
Provision (benefit) for income taxes
7
(20)
88
(22)
GAAP Net income (loss) from continuing operations
before taxes
38
70
258
(757)
Indemnification Agreement expense (1)
—
—
—
972
Termination of Honeywell Tax Matters Agreement (2)
—
—
(77)
—
Interest expense, net
31
30
97
81
Depreciation and amortization
21
21
64
60
Business separation costs
30
—
30
—
Stock-based compensation expense
10
10
30
30
Restructuring, impairment and extinguishment costs
20
3
43
4
Litigation settlement
—
—
18
—
Other (3)
4
6
(1)
24
Adjusted EBITDA
$ 154
$ 140
$ 462
$ 414
Non-recurring standalone adjustments (4)
—
6
7
19
Standalone Adjusted EBITDA
$ 154
$ 146
$ 469
$ 433
Standalone Adjusted EBITDA as a % of revenue
21.2 %
20.8 %
21.2 %
20.5 %
(1)
Refer to the Unaudited Consolidated Statements of Operations herein.
(2)
We recognized a gain of $77 million in Other income and derecognized $44 million of deferred tax assets that were no longer realizable to Income tax expense in connection with the termination of the Honeywell Tax Matters Agreement.
(3)
Other includes net periodic pension benefit costs, excluding service costs, foreign exchange transaction loss (income), gain on sale of assets and miscellaneous other non-recurring, non-operating income and loss.
(4)
Reflects methodology differences between continuing operations basis of accounting and Standalone results (e.g., executive compensation for certain executives who transferred to ADI as part of the separation or retired from Resideo is wholly retained in continuing operations). Standalone results are intended to present historical results as if the ADI Spin-Off had occurred and Resideo was operating as a separate, independent company for all periods presented.
Unaudited Condensed Consolidated Statement of Operations
For the Three Months Ended July 4, 2026
(UNAUDITED)
For the Three Months Ended July 4, 2026
Resideo
ADI
Discontinued
Operations
Resideo
Continuing
Operations
(in millions)
Revenue
$ 1,981
$ 1,243
$ 738
Cost of goods sold
1,386
951
435
Gross profit
595
292
303
Operating expenses:
Research and development expenses
48
12
36
Selling, general and administrative expenses
332
196
136
Intangible asset amortization
31
25
6
Restructuring, impairment and extinguishment costs
22
5
17
Business separation costs
31
31
—
Total operating expenses
464
269
195
Income from operations
131
23
108
Other expense (income), net
(81)
2
(83)
Interest expense, net
46
13
33
Net income before taxes
166
8
158
Provision for income taxes
69
7
62
Net income
97
1
96
Less: preferred stock dividends
8
2
6
Less: undistributed income allocated to preferred
stockholders
10
—
10
Net income (loss) available to common stockholders
$ 79
$ (1)
$ 80
Unaudited Condensed Consolidated Statement of Operations
For the Three Months Ended April 4, 2026
(UNAUDITED)
For the Three Months Ended April 4, 2026
Resideo
ADI
Discontinued
Operations
Resideo
Continuing
Operations
(in millions)
Revenue
$ 1,912
$ 1,160
$ 752
Cost of goods sold
1,361
904
457
Gross profit
551
256
295
Operating expenses:
Research and development expenses
48
11
37
Selling, general and administrative expenses
340
190
150
Intangible asset amortization
31
24
7
Restructuring, impairment and extinguishment costs
6
—
6
Business separation costs
24
24
—
Total operating expenses
449
249
200
Income from operations
102
7
95
Interest expense, net
47
14
33
Net income (loss) before taxes
55
(7)
62
Provision (benefit) for income taxes
17
(2)
19
Net income (loss)
38
(5)
43
Less: preferred stock dividends
9
3
6
Less: undistributed income allocated to preferred
stockholders
3
(1)
4
Net income (loss) available to common stockholders
$ 26
$ (7)
$ 33
Unaudited Condensed Consolidated Statement of Operations
For the Three Months Ended December 31, 2025
(UNAUDITED)
For the Three Months Ended December 31, 2025
Resideo
ADI
Discontinued
Operations
Resideo
Continuing
Operations
(in millions)
Revenue
$ 1,895
$ 1,145
$ 750
Cost of goods sold
1,335
877
458
Gross profit
560
268
292
Operating expenses:
Research and development expenses
47
10
37
Selling, general and administrative expenses
321
183
138
Intangible asset amortization
31
25
6
Restructuring, impairment and extinguishment costs
7
3
4
Business separation costs
14
14
—
Total operating expenses
420
235
185
Income from operations
140
33
107
Other income, net
(65)
(2)
(63)
Interest expense, net
49
16
33
Net income before taxes
156
19
137
Provision (benefit) for income taxes
20
(22)
42
Net income
136
41
95
Less: preferred stock dividends
9
3
6
Less: undistributed income allocated to preferred
stockholders
14
4
10
Net income available to common stockholders
$ 113
$ 34
$ 79
Unaudited Condensed Consolidated Statement of Operations
For the Three Months Ended September 27, 2025
(UNAUDITED)
For the Three Months Ended September 27, 2025
Resideo
ADI
Discontinued
Operations
Resideo
Continuing
Operations
(in millions)
Revenue
$ 1,864
$ 1,161
$ 703
Cost of goods sold
1,308
889
419
Gross profit
556
272
284
Operating expenses:
Research and development expenses
44
11
33
Selling, general and administrative expenses
320
185
135
Intangible asset amortization
31
24
7
Restructuring, impairment and extinguishment costs
3
—
3
Business separation costs
4
4
—
Total operating expenses
402
224
178
Income from operations
154
48
106
Other expense, net
7
1
6
Interest expense, net
37
7
30
Net income before taxes
110
40
70
Provision (benefit) for income taxes
(46)
(26)
(20)
Net income
156
66
90
Less: preferred stock dividends
9
3
6
Less: undistributed income allocated to preferred
stockholders
16
7
9
Net income available to common stockholders
$ 131
$ 56
$ 75
Unaudited Condensed Consolidated Statement of Operations
For the Three Months Ended June 28, 2025
(UNAUDITED)
For the Three Months Ended June 28, 2025
Resideo
ADI
Discontinued
Operations
Resideo
Continuing
Operations
(in millions)
Revenue
$ 1,943
$ 1,233
$ 710
Cost of goods sold
1,374
949
425
Gross profit
569
284
285
Operating expenses:
Research and development expenses
41
9
32
Selling, general and administrative expenses
319
183
136
Intangible asset amortization
30
23
7
Restructuring, impairment and extinguishment costs
2
1
1
Total operating expenses
392
216
176
Income from operations
177
68
109
Indemnification Agreement expense
882
—
882
Other expense (income), net
9
(2)
11
Interest expense, net
24
(1)
25
Net income (loss) before taxes
(738)
71
(809)
Provision for income taxes
87
83
4
Net loss
(825)
(12)
(813)
Less: preferred stock dividends
8
2
6
Net loss available to common stockholders
$ (833)
$ (14)
$ (819)
Unaudited Condensed Consolidated Statement of Operations
For the Three Months Ended March 29, 2025
(UNAUDITED)
For the Three Months Ended March 29, 2025
Resideo
ADI
Discontinued
Operations
Resideo
Continuing
Operations
(in millions)
Revenue
$ 1,770
$ 1,075
$ 695
Cost of goods sold
1,259
833
426
Gross profit
511
242
269
Operating expenses:
Research and development expenses
35
9
26
Selling, general and administrative expenses
306
174
132
Intangible asset amortization
30
23
7
Restructuring, impairment and extinguishment costs
4
4
—
Total operating expenses
375
210
165
Income from operations
136
32
104
Indemnification Agreement expense
90
—
90
Other expense, net
6
—
6
Interest expense, net
25
(1)
26
Net income (loss) before taxes
15
33
(18)
Provision (benefit) for income taxes
9
15
(6)
Net income (loss)
6
18
(12)
Less: preferred stock dividends
9
3
6
Net income (loss) available to common stockholders
$ (3)
$ 15
$ (18)
NON-GAAP FINANCIAL MEASURES AND RECONCILIATIONS
ADJUSTED EBITDA
(UNAUDITED)
For the Three Months Ended
(in millions)
March 29, 2025
June 28, 2025
September 27, 2025
December 31, 2025
April 4, 2026
July 4, 2026
October 3, 2026
Net Income (loss) from continuing operations
$ (12)
$ (813)
$ 90
$ 95
$ 43
$ 96
$ 31
Provision (benefit) for income taxes
(6)
4
(20)
42
19
62
7
Interest expense, net
26
25
30
33
33
33
31
Depreciation and amortization
19
20
21
20
22
21
21
Stock-based compensation expense
11
9
10
10
10
10
10
Restructuring, impairment and extinguishment costs
—
1
3
4
6
17
20
Business separation costs
—
—
—
—
—
—
30
Litigation Settlement
—
—
—
—
18
—
—
Indemnification Agreement expense
90
882
—
—
—
—
—
Termination of Honeywell Tax Matters Agreement
—
—
—
—
—
(77)
—
Gain on sale of business
—
—
—
(52)
—
—
—
Other (1)
6
12
6
(10)
1
(6)
4
Adjusted EBITDA
$ 134
$ 140
$ 140
$ 142
$ 152
$ 156
$ 154
Non-recurring standalone adjustments (2)
5
8
6
6
6
1
—
Standalone Adjusted EBITDA
$ 139
$ 148
$ 146
$ 148
$ 158
$ 157
$ 154
(1)
Other includes net periodic pension benefit costs, excluding service costs, foreign exchange transaction loss (income), gain on sale of assets and miscellaneous other non-recurring, non-operating income and loss.
(2)
Reflects methodology differences between continuing operations basis of accounting and Standalone results (e.g., executive compensation for certain executives who transferred to ADI as part of the separation or retired from Resideo is wholly retained in continuing operations). Standalone results are intended to present historical results as if the ADI Spin-Off had occurred and Resideo was operating as a separate, independent company for all periods presented.
NON-GAAP FINANCIAL MEASURES AND RECONCILIATIONS
ADJUSTED NET INCOME AND ADJUSTED DILUTED EARNINGS PER SHARE
(UNAUDITED)
For the Three Months Ended
(in millions)
March 29, 2025
June 28, 2025
September 27, 2025
December 31, 2025
April 4, 2026
July 4, 2026
October 3, 2026
Net income (loss) from continuing operations available to
common stockholders
$ (18)
$ (819)
$ 75
$ 79
$ 33
$ 80
$ 22
Intangible asset amortization
7
7
7
6
7
6
6
Stock-based compensation expense
11
9
10
10
10
10
10
Restructuring, impairment and extinguishment costs
—
1
3
4
6
17
20
Business separation costs
—
—
—
—
—
—
30
Litigation Settlement
—
—
—
—
18
—
—
Indemnification Agreement expense
90
882
—
—
—
—
—
Tax impact of terminating the IRA
—
(44)
(34)
6
—
—
—
Termination of Honeywell Tax Matters Agreement
—
—
—
—
—
(77)
—
Tax impact of terminating the Honeywell Tax Matters Agreement
—
—
—
—
—
44
—
Gain on sale of business
—
—
—
(52)
—
—
—
Tax impact of sale of business
—
—
—
14
—
—
—
Undistributed income allocated to preferred stockholders
—
—
9
10
4
10
3
Other (1)
6
12
6
(10)
1
(6)
4
Tax effect of applicable non-GAAP adjustments
(6)
(7)
(7)
(3)
(11)
(7)
(15)
Adjusted Net Income
$ 90
$ 41
$ 69
$ 64
$ 68
$ 77
$ 80
Non-recurring standalone adjustments, net of taxes (2)
4
6
5
5
5
1
—
Standalone Adjusted Net Income
$ 94
$ 47
$ 74
$ 69
$ 73
$ 78
$ 80
Diluted shares (in millions)
148
151
154
155
155
154
154
Standalone Adjusted Diluted Earnings Per Share
$ 0.64
$ 0.31
$ 0.48
$ 0.45
$ 0.47
$ 0.51
$ 0.52
(1)
Other includes net periodic benefit costs, excluding service costs, foreign exchange transaction loss (income), gain on sale of assets and miscellaneous other non-recurring, non-operating income and loss.
(2)
Reflects methodology differences between continuing operations basis of accounting and Standalone results (e.g., executive compensation for certain executives who transferred to ADI as part of the separation or retired from Resideo is wholly retained in continuing operations). Standalone results are intended to present historical results as if the ADI Spin-Off had occurred and Resideo was operating as a separate, independent company for all periods presented.
View original content to download multimedia:https://www.prnewswire.com/news-releases/resideo-announces-third-quarter-2026-financial-results-and-updates-2026-outlook-302935565.html
SOURCE Resideo Technologies, Inc.


Silicon Labs Reports Third Quarter 2026 Results

QuickLogic Reports Fiscal Third Quarter 2026 Financial Results

Resideo Announces Third Quarter 2026 Financial Results and Updates 2026 Outlook

Send Rakhi to UK swiftly with UK Gifts Portal

Whiteboard Series with NEAR | Ep: 45 Joel Thorstensson from ceramic.network

Nullmax and Renesas Forge Strategic Partnership to Deliver Competitive ADAS Solutions for the Global Market

Why You Should Build on #NEAR – Co-founder Illia Polosukhin at CV Labs
Whiteboard Series with NEAR | Ep: 45 Joel Thorstensson from ceramic.network

NEAR End of Year Town Hall 2021: The Open Web World, MetaBUILD 2 Hackathon and 2021 recap
Trending
-

 Technology4 days ago
Diamond Foundry Announces First-Ever D200mm Single-Crystal Diamond
-

 Coin Market5 days ago
Crypto exchanges tout cold storage ratios after Binance attack
-
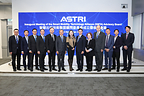
 Technology5 days ago
ASTRI Establishes Advisory Board for Smart Mobility Technology Alliance
-

 Technology5 days ago
2026 World Internet Conference Wuzhen Summit Opens
-

 Coin Market5 days ago
Bitcoin, Ether ETFs post $530M outflows as election gains evaporate
-

 Technology4 days ago
Home Companion Robot Mobo to Debut Globally and Open Pre-orders as AiMOGA Showcases Its Robot Family at the 2026 OMODA & JAECOO International User Summit
-
 Technology4 days ago
Datavault AI Founder Nathaniel Bradley Sues Board
-

 Coin Market4 days ago
Suspicious prediction market activity seen before election poll release: NYT