Third quarter guidance reflects continued momentum and Richards acquisition
GALWAY, Ireland, April 23, 2025 /PRNewswire/ — TE Connectivity plc (NYSE: TEL) today reported results for the fiscal second quarter ended Mar. 28, 2025.
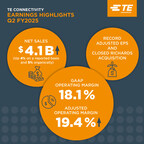
Second Quarter Highlights
Net sales were $4.1 billion, up 4% on a reported basis year over year and 5% organically driven by double digit growth in the Industrial segment.GAAP diluted earnings per share (EPS) from continuing operations was $0.04, which includes a one-time non-cash tax charge due to a change in tax law in the second quarter of 2025. Adjusted EPS was $2.10, a company record and up approximately 13% year over year.Orders were $4.25 billion, up 6% both year over year and sequentially.Operating margin was 18.1% and adjusted operating margin was 19.4%, driven by strong operational performance in both segments.Cash flow from operating activities during the first half of the fiscal year was $1.5 billion and free cash flow was approximately $1.1 billion.Returned approximately $1 billion to shareholders and announced a 9% dividend increase.Richards Manufacturing Co. acquisition completed in April to capitalize on strong growth opportunities in the North American utility market.Issued One Connected World corporate responsibility report, highlighted by an 80% reduction in Scope 1 & 2 greenhouse gas emissions during the past four years.
“Our teams delivered strong operational performance that led to record adjusted EPS and results that exceeded our guidance on both sales and earnings,” said TE Connectivity CEO Terrence Curtin. “Our Transportation segment continued to execute well, capitalizing on our leading position in Asia and maintaining strong margin performance. Our Industrial segment expanded its operating margin on sales growth of 17%, driven by broad business growth and ongoing momentum in AI, aerospace and energy applications.
“Due to our long-standing business strategy and investments to locate manufacturing facilities near customers, we expect to effectively navigate the current trade environment. Our ongoing momentum and ability to pull operational levers gives us confidence in our third quarter guidance for year-over-year improvement in sales and EPS. We are well positioned for the current uncertain macroeconomic environment and remain focused on innovating in long-term industrial technology growth trends and creating value for both our customers and owners.”
Third Quarter FY25 Outlook
For the third quarter of fiscal 2025, the company expects net sales of approximately $4.30 billion, up 8% year over year. GAAP EPS from continuing operations is expected to be approximately $2.02, up nearly 9% year over year, with adjusted EPS of approximately $2.06, up 8% year over year. Third quarter guidance includes the benefit from the Richards acquisition and tariff impact assumptions, as well as tax rate headwinds of $0.04 on a year over year basis and $0.06 sequentially.
Information about TE Connectivity’s use of non-GAAP financial measures is provided below. For reconciliations of these non-GAAP financial measures, see the attached tables.
Conference Call and Webcast
The company will hold a conference call for investors today beginning at 8:30 a.m. ET. The conference call may be accessed in the following ways:
At TE Connectivity’s website: investors.te.comBy telephone: For both “listen-only” participants and those participants who wish to take part in the question-and-answer portion of the call, the dial-in number in the United States is (800) 715-9871 and for international callers, the dial-in number is (646) 307-1963.A replay of the conference call will be available on TE Connectivity’s investor website at investors.te.com at 11:30 a.m. ET on April 23.
About TE Connectivity
TE Connectivity plc (NYSE: TEL) is a global industrial technology leader creating a safer, sustainable, productive, and connected future. Our broad range of connectivity and sensor solutions enable the distribution of power, signal and data to advance next-generation transportation, energy networks, automated factories, data centers, medical technology and more. With more than 85,000 employees, including 9,000 engineers, working alongside customers in approximately 130 countries, TE ensures that EVERY CONNECTION COUNTS. Learn more at www.te.com and on LinkedIn, Facebook, WeChat, Instagram and X (formerly Twitter).
Non-GAAP Financial Measures
We present non-GAAP performance and liquidity measures as we believe it is appropriate for investors to consider adjusted financial measures in addition to results in accordance with accounting principles generally accepted in the U.S. (“GAAP”). These non-GAAP financial measures provide supplemental information and should not be considered replacements for results in accordance with GAAP. Management uses non-GAAP financial measures internally for planning and forecasting purposes and in its decision-making processes related to the operations of our company. We believe these measures provide meaningful information to us and investors because they enhance the understanding of our operating performance, ability to generate cash, and the trends of our business. Additionally, we believe that investors benefit from having access to the same financial measures that management uses in evaluating our operations. The primary limitation of these measures is that they exclude the financial impact of items that would otherwise either increase or decrease our reported results. This limitation is best addressed by using these non-GAAP financial measures in combination with the most directly comparable GAAP financial measures in order to better understand the amounts, character, and impact of any increase or decrease in reported amounts. These non-GAAP financial measures may not be comparable to similarly-titled measures reported by other companies.
The following provides additional information regarding our non-GAAP financial measures:
Organic Net Sales Growth (Decline) – represents net sales growth (decline) (the most comparable GAAP financial measure) excluding the impact of foreign currency exchange rates, and acquisitions and divestitures that occurred in the preceding twelve months, if any. Organic Net Sales Growth (Decline) is a useful measure of our performance because it excludes items that are not completely under management’s control, such as the impact of changes in foreign currency exchange rates, and items that do not reflect the underlying growth of the company, such as acquisition and divestiture activity. This measure is a significant component in our incentive compensation plans.Adjusted Operating Income and Adjusted Operating Margin – represent operating income and operating margin, respectively, (the most comparable GAAP financial measures) before special items including restructuring and other charges, acquisition-related charges, impairment of goodwill, and other income or charges, if any. We utilize these adjusted measures in combination with operating income and operating margin to assess segment level operating performance and to provide insight to management in evaluating segment operating plan execution and market conditions. Adjusted Operating Income is a significant component in our incentive compensation plans.Adjusted Income Tax (Expense) Benefit and Adjusted Effective Tax Rate – represent income tax (expense) benefit and effective tax rate, respectively, (the most comparable GAAP financial measures) after adjusting for the tax effect of special items including restructuring and other charges, acquisition-related charges, impairment of goodwill, other income or charges, and certain significant tax items, if any.Adjusted Income from Continuing Operations – represents income from continuing operations (the most comparable GAAP financial measure) before special items including restructuring and other charges, acquisition-related charges, impairment of goodwill, other income or charges, and certain significant tax items, if any, and, if applicable, the related tax effects.Adjusted Earnings Per Share – represents diluted earnings (loss) per share from continuing operations (the most comparable GAAP financial measure) before special items including restructuring and other charges, acquisition-related charges, impairment of goodwill, other income or charges, and certain significant tax items, if any, and, if applicable, the related tax effects. This measure is a significant component in our incentive compensation plans.Free Cash Flow (FCF) – is a useful measure of our ability to generate cash. The difference between net cash provided by operating activities (the most comparable GAAP financial measure) and Free Cash Flow consists mainly of significant cash outflows and inflows that we believe are useful to identify. We believe Free Cash Flow provides useful information to investors as it provides insight into the primary cash flow metric used by management to monitor and evaluate cash flows generated from our operations. Free Cash Flow is defined as net cash provided by operating activities excluding voluntary pension contributions and the cash impact of special items, if any, minus net capital expenditures. Voluntary pension contributions are excluded from the GAAP financial measure because this activity is driven by economic financing decisions rather than operating activity. Certain special items, including cash paid (collected) pursuant to collateral requirements related to cross-currency swap contracts, are also excluded by management in evaluating Free Cash Flow. Net capital expenditures consist of capital expenditures less proceeds from the sale of property, plant, and equipment. These items are subtracted because they represent long-term commitments. In the calculation of Free Cash Flow, we subtract certain cash items that are ultimately within management’s and the Board of Directors’ discretion to direct and may imply that there is less or more cash available for our programs than the most comparable GAAP financial measure indicates. It should not be inferred that the entire Free Cash Flow amount is available for future discretionary expenditures, as our definition of Free Cash Flow does not consider certain non-discretionary expenditures, such as debt payments. In addition, we may have other discretionary expenditures, such as discretionary dividends, share repurchases, and business acquisitions, that are not considered in the calculation of Free Cash Flow.
Forward-Looking Statements
This release contains certain “forward-looking statements” within the meaning of the U.S. Private Securities Litigation Reform Act of 1995. These statements are based on management’s current expectations and are subject to risks, uncertainty and changes in circumstances, which may cause actual results, performance, financial condition or achievements to differ materially from anticipated results, performance, financial condition or achievements. All statements contained herein that are not clearly historical in nature are forward-looking and the words “anticipate,” “believe,” “expect,” “estimate,” “plan,” and similar expressions are generally intended to identify forward-looking statements. We have no intention and are under no obligation to update or alter (and expressly disclaim any such intention or obligation to do so) our forward-looking statements whether as a result of new information, future events or otherwise, except to the extent required by law. The forward-looking statements in this release include statements addressing our future financial condition and operating results. Examples of factors that could cause actual results to differ materially from those described in the forward-looking statements include, among others, the extent, severity and duration of business interruptions negatively affecting our business operations; business, economic, competitive and regulatory risks, such as conditions affecting demand for products in the automotive and other industries we serve; competition and pricing pressure; fluctuations in foreign currency exchange rates and commodity prices; natural disasters and political, economic and military instability in countries in which we operate, including continuing military conflict in certain parts of the world; developments in the credit markets; future goodwill impairment; compliance with current and future environmental and other laws and regulations; and the possible effects on us of changes in tax laws, tax treaties and other legislation. In addition, our change of incorporation from Switzerland to Ireland is subject to risks, such as the risk that the anticipated advantages might not materialize, as well as the risks that the price of our stock could decline and our position on stock exchanges and indices could change, and Irish corporate governance and regulatory schemes could prove different or more challenging than currently expected. More detailed information about these and other factors is set forth in TE Connectivity plc’s Annual Report on Form 10-K for the fiscal year ended Sept 27, 2024, as well as in our Quarterly Reports on Form 10-Q, Current Reports on Form 8-K and other reports filed by us with the U.S. Securities and Exchange Commission.
TE CONNECTIVITY PLC
CONSOLIDATED STATEMENTS OF OPERATIONS (UNAUDITED)
For the Quarters Ended
For the Six Months Ended
March 28,
March 29,
March 28,
March 29,
2025
2024
2025
2024
(in millions, except per share data)
Net sales
$
4,143
$
3,967
$
7,979
$
7,798
Cost of sales
2,684
2,604
5,160
5,111
Gross margin
1,459
1,363
2,819
2,687
Selling, general, and administrative expenses
454
444
881
868
Research, development, and engineering expenses
203
184
391
357
Acquisition and integration costs
9
3
14
11
Restructuring and other charges, net
45
40
95
61
Operating income
748
692
1,438
1,390
Interest income
22
19
45
41
Interest expense
(14)
(19)
(20)
(37)
Other expense, net
(1)
(5)
(2)
(8)
Income from continuing operations before income taxes
755
687
1,461
1,386
Income tax (expense) benefit
(742)
(146)
(920)
959
Income from continuing operations
13
541
541
2,345
Loss from discontinued operations, net of income taxes
—
—
—
(1)
Net income
$
13
$
541
$
541
$
2,344
Basic earnings per share:
Income from continuing operations
$
0.04
$
1.76
$
1.81
$
7.59
Net income
0.04
1.76
1.81
7.59
Diluted earnings per share:
Income from continuing operations
$
0.04
$
1.75
$
1.80
$
7.54
Net income
0.04
1.75
1.80
7.54
Weighted-average number of shares outstanding:
Basic
298
308
299
309
Diluted
300
310
301
311
TE CONNECTIVITY PLC
CONSOLIDATED BALANCE SHEETS (UNAUDITED)
March 28,
September 27,
2025
2024
(in millions, except share data)
Assets
Current assets:
Cash and cash equivalents
$
2,554
$
1,319
Accounts receivable, net of allowance for doubtful accounts of $36 and $32, respectively
3,193
3,055
Inventories
2,603
2,517
Prepaid expenses and other current assets
724
740
Total current assets
9,074
7,631
Property, plant, and equipment, net
3,925
3,903
Goodwill
5,900
5,801
Intangible assets, net
1,161
1,174
Deferred income taxes
2,741
3,497
Other assets
855
848
Total assets
$
23,656
$
22,854
Liabilities, redeemable noncontrolling interests, and shareholders’ equity
Current liabilities:
Short-term debt
$
2,351
$
871
Accounts payable
1,843
1,728
Accrued and other current liabilities
1,805
2,147
Total current liabilities
5,999
4,746
Long-term debt
3,263
3,332
Long-term pension and postretirement liabilities
786
810
Deferred income taxes
211
199
Income taxes
396
411
Other liabilities
784
870
Total liabilities
11,439
10,368
Commitments and contingencies
Redeemable noncontrolling interests
132
131
Shareholders’ equity:
Preferred shares, $1.00 par value, 2 shares authorized, none outstanding as of March 28, 2025
—
—
Ordinary class A shares, €1.00 par value, 25,000 shares authorized, none outstanding as of March 28, 2025
—
—
Ordinary shares, $0.01 par value, 1,500,000,000 shares authorized, 301,276,687 shares issued and
common shares, CHF 0.57 par value, 316,574,781 shares authorized and issued, respectively
3
139
Accumulated earnings
12,811
14,533
Ordinary shares and common shares held in treasury, at cost, 4,139,531 and 16,656,681 shares, respectively
(615)
(2,322)
Accumulated other comprehensive income (loss)
(114)
5
Total shareholders’ equity
12,085
12,355
Total liabilities, redeemable noncontrolling interests, and shareholders’ equity
$
23,656
$
22,854
TE CONNECTIVITY PLC
CONSOLIDATED STATEMENTS OF CASH FLOWS (UNAUDITED)
For the Quarters Ended
For the Six Months Ended
March 28,
March 29,
March 28,
March 29,
2025
2024
2025
2024
(in millions)
Cash flows from operating activities:
Net income
$
13
$
541
$
541
$
2,344
Loss from discontinued operations, net of income taxes
—
—
—
1
Income from continuing operations
13
541
541
2,345
Adjustments to reconcile income from continuing operations to net cash
provided by operating activities:
Depreciation and amortization
192
192
378
386
Deferred income taxes
603
5
701
(1,212)
Non-cash lease cost
35
33
69
67
Provision for losses on accounts receivable and inventories
2
13
43
55
Share-based compensation expense
34
35
69
69
Other
22
24
34
64
Changes in assets and liabilities, net of the effects of acquisitions and divestitures:
Accounts receivable, net
(317)
(55)
(171)
72
Inventories
(14)
41
(132)
(241)
Prepaid expenses and other current assets
72
47
140
(1)
Accounts payable
(4)
(73)
146
55
Accrued and other current liabilities
(3)
(48)
(298)
(287)
Income taxes
25
3
55
15
Other
(7)
(48)
(44)
42
Net cash provided by operating activities
653
710
1,531
1,429
Cash flows from investing activities:
Capital expenditures
(230)
(167)
(435)
(318)
Proceeds from sale of property, plant, and equipment
1
—
2
2
Acquisition of businesses, net of cash acquired
4
10
(321)
(339)
Proceeds from divestiture of business, net of cash retained by business sold
—
—
—
38
Other
1
(2)
(7)
(10)
Net cash used in investing activities
(224)
(159)
(761)
(627)
Cash flows from financing activities:
Net increase (decrease) in commercial paper
1,155
30
1,245
(39)
Proceeds from issuance of debt
773
—
773
—
Repayment of debt
(579)
—
(579)
(1)
Proceeds from exercise of share options
25
22
59
33
Repurchase of ordinary/common shares
(306)
(409)
(609)
(885)
Payment of ordinary/common share dividends to shareholders
(193)
(182)
(382)
(365)
Other
(6)
—
(33)
(27)
Net cash provided by (used in) financing activities
869
(539)
474
(1,284)
Effect of currency translation on cash
2
(6)
(9)
(3)
Net increase (decrease) in cash, cash equivalents, and restricted cash
1,300
6
1,235
(485)
Cash, cash equivalents, and restricted cash at beginning of period
1,254
1,170
1,319
1,661
Cash, cash equivalents, and restricted cash at end of period
$
2,554
$
1,176
$
2,554
$
1,176
Supplemental cash flow information:
Income taxes paid, net of refunds
$
115
$
138
$
164
$
238
TE CONNECTIVITY PLC
RECONCILIATION OF FREE CASH FLOW (UNAUDITED)
For the Quarters Ended
For the Six Months Ended
March 28,
March 29,
March 28,
March 29,
2025
2024
2025
2024
(in millions)
Net cash provided by operating activities
$
653
$
710
$
1,531
$
1,429
Capital expenditures, net
(229)
(167)
(433)
(316)
Free cash flow (1)
$
424
$
543
$
1,098
$
1,113
(1) Free cash flow is a non-GAAP financial measure. See description of non-GAAP financial measures.
TE CONNECTIVITY PLC
SEGMENT DATA (UNAUDITED)
For the Quarters Ended
For the Six Months Ended
March 28,
March 29,
March 28,
March 29,
2025
2024
2025
2024
($ in millions)
Net Sales
Net Sales
Net Sales
Net Sales
Transportation Solutions
$
2,314
$
2,407
$
4,557
$
4,800
Industrial Solutions
1,829
1,560
3,422
2,998
Total
$
4,143
$
3,967
$
7,979
$
7,798
Operating
Operating
Operating
Operating
Operating
Operating
Operating
Operating
Income
Margin
Income
Margin
Income
Margin
Income
Margin
Transportation Solutions
$
445
19.2
%
$
477
19.8
%
$
891
19.6
%
$
964
20.1
%
Industrial Solutions
303
16.6
215
13.8
547
16.0
426
14.2
Total
$
748
18.1
%
$
692
17.4
%
$
1,438
18.0
%
$
1,390
17.8
%
Adjusted
Adjusted
Adjusted
Adjusted
Adjusted
Adjusted
Adjusted
Adjusted
Operating
Operating
Operating
Operating
Operating
Operating
Operating
Operating
Income (1)
Margin (1)
Income (1)
Margin (1)
Income (1)
Margin (1)
Income (1)
Margin (1)
Transportation Solutions
$
478
20.7
%
$
496
20.6
%
$
956
21.0
%
$
1,000
20.8
%
Industrial Solutions
327
17.9
239
15.3
594
17.4
466
15.5
Total
$
805
19.4
%
$
735
18.5
%
$
1,550
19.4
%
$
1,466
18.8
%
(1) Adjusted operating income and adjusted operating margin are non-GAAP financial measures. See description of non-GAAP financial measures.
TE CONNECTIVITY PLC
RECONCILIATION OF NET SALES GROWTH (DECLINE) (UNAUDITED)
Change in Net Sales for the Quarter Ended March 28, 2025
versus Net Sales for the Quarter Ended March 29, 2024
Net Sales
Organic Net Sales
Growth (Decline)
Growth (Decline) (1)
Translation (2)
Acquisitions
($ in millions)
Transportation Solutions (3):
Automotive
$
(37)
(2.1)
%
$
6
0.4
%
$
(43)
$
—
Commercial transportation
(27)
(7.0)
(20)
(5.1)
(7)
—
Sensors
(29)
(11.6)
(25)
(9.6)
(4)
—
Total Transportation Solutions
(93)
(3.9)
(39)
(1.5)
(54)
—
Industrial Solutions (3):
Automation and connected living
12
2.4
8
1.5
(10)
14
Aerospace, defense, and marine
32
9.4
37
10.8
(5)
—
Digital data networks
209
76.6
213
78.0
(4)
—
Energy
45
19.2
18
7.6
(7)
34
Medical
(29)
(13.7)
(29)
(13.7)
—
—
Total Industrial Solutions
269
17.2
247
15.7
(26)
48
Total
$
176
4.4
%
$
208
5.3
%
$
(80)
$
48
Change in Net Sales for the Six Months Ended March 28, 2025
versus Net Sales for the Six Months Ended March 29, 2024
Net Sales
Organic Net Sales
Acquisitions/
Growth (Decline)
Growth (Decline) (1)
Translation (2)
(Divestiture)
($ in millions)
Transportation Solutions (3):
Automotive
$
(111)
(3.1)
%
$
(49)
(1.3)
%
$
(50)
$
(12)
Commercial transportation
(71)
(9.6)
(61)
(8.3)
(10)
—
Sensors
(61)
(12.4)
(55)
(11.1)
(6)
—
Total Transportation Solutions
(243)
(5.1)
(165)
(3.4)
(66)
(12)
Industrial Solutions (3):
Automation and connected living
27
2.8
(13)
(1.4)
(12)
52
Aerospace, defense, and marine
76
12.0
82
12.9
(6)
—
Digital data networks
343
62.1
347
62.8
(4)
—
Energy
56
12.8
32
7.2
(10)
34
Medical
(78)
(19.0)
(78)
(19.0)
—
—
Total Industrial Solutions
424
14.1
370
12.3
(32)
86
Total
$
181
2.3
%
$
205
2.7
%
$
(98)
$
74
(1) Organic net sales growth (decline) is a non-GAAP financial measure. See description of non-GAAP financial measures.
(2) Represents the change in net sales resulting from changes in foreign currency exchange rates.
(3) Industry end market information is presented consistently with our internal management reporting and may be periodically revised as management deems necessary.
TE CONNECTIVITY PLC
RECONCILIATION OF NON-GAAP FINANCIAL MEASURES TO GAAP FINANCIAL MEASURES
For the Quarter Ended March 28, 2025
(UNAUDITED)
Adjustments
Acquisition-
Restructuring
Related
and Other
Adjusted
U.S. GAAP
Charges (1)
Charges, Net (1)
Tax Items (2)
(Non-GAAP) (3)
($ in millions, except per share data)
Operating income:
Transportation Solutions
$
445
$
—
$
33
$
—
$
478
Industrial Solutions
303
12
12
—
327
Total
$
748
$
12
$
45
$
—
$
805
Operating margin
18.1
%
19.4
%
Income tax expense
$
(742)
$
(2)
$
(11)
$
574
$
(181)
Effective tax rate
98.3
%
22.3
%
Income from continuing operations
$
13
$
10
$
34
$
574
$
631
Diluted earnings per share from continuing operations
$
0.04
$
0.03
$
0.11
$
1.91
$
2.10
(1) The tax effect of each non-GAAP adjustment is calculated based on the jurisdictions in which the expense (income) is incurred and the tax laws in effect for each such jurisdiction.
(2) Represents income tax expense related to a net increase in the valuation allowance for certain deferred tax assets associated with a ten-year tax credit obtained by a Swiss subsidiary in fiscal 2024.
(3) See description of non-GAAP financial measures.
TE CONNECTIVITY PLC
RECONCILIATION OF NON-GAAP FINANCIAL MEASURES TO GAAP FINANCIAL MEASURES
For the Quarter Ended March 29, 2024
(UNAUDITED)
Adjustments
Acquisition-
Restructuring
Related
and Other
Adjusted
U.S. GAAP
Charges (1)
Charges, Net (1)
(Non-GAAP) (2)
($ in millions, except per share data)
Operating income:
Transportation Solutions
$
477
$
—
$
19
$
496
Industrial Solutions
215
3
21
239
Total
$
692
$
3
$
40
$
735
Operating margin
17.4
%
18.5
%
Income tax expense
$
(146)
$
(1)
$
(6)
$
(153)
Effective tax rate
21.3
%
21.0
%
Income from continuing operations
$
541
$
2
$
34
$
577
Diluted earnings per share from continuing operations
$
1.75
$
0.01
$
0.11
$
1.86
(1) The tax effect of each non-GAAP adjustment is calculated based on the jurisdictions in which the expense (income) is incurred and the tax laws in effect for each such jurisdiction.
(2) See description of non-GAAP financial measures.
TE CONNECTIVITY PLC
RECONCILIATION OF NON-GAAP FINANCIAL MEASURES TO GAAP FINANCIAL MEASURES
For the Six Months Ended March 28, 2025
(UNAUDITED)
Adjustments
Acquisition-
Restructuring
Related
and Other
Adjusted
U.S. GAAP
Charges (1)
Charges, Net (1)
Tax Items (2)
(Non-GAAP) (3)
($ in millions, except per share data)
Operating income:
Transportation Solutions
$
891
$
—
$
65
$
—
$
956
Industrial Solutions
547
17
30
—
594
Total
$
1,438
$
17
$
95
$
—
$
1,550
Operating margin
18.0
%
19.4
%
Income tax expense
$
(920)
$
(3)
$
(20)
$
587
$
(356)
Effective tax rate
63.0
%
22.6
%
Income from continuing operations
$
541
$
14
$
75
$
587
$
1,217
Diluted earnings per share from continuing operations
$
1.80
$
0.05
$
0.25
$
1.95
$
4.04
(1) The tax effect of each non-GAAP adjustment is calculated based on the jurisdictions in which the expense (income) is incurred and the tax laws in effect for each such jurisdiction.
(2) Includes income tax expense of $574 million related to a net increase in the valuation allowance for certain deferred tax assets associated with a ten-year tax credit obtained by a Swiss subsidiary in fiscal 2024 as well as income tax expense of $13 million related to the revaluation of deferred tax assets as a result of a decrease in the corporate tax rate in a non-U.S. jurisdiction.
(3) See description of non-GAAP financial measures.
TE CONNECTIVITY PLC
RECONCILIATION OF NON-GAAP FINANCIAL MEASURES TO GAAP FINANCIAL MEASURES
For the Six Months Ended March 29, 2024
(UNAUDITED)
Adjustments
Acquisition-
Restructuring
Related
and Other
Adjusted
U.S. GAAP
Charges (1)
Charges, Net (1)
Tax Items (2)
(Non-GAAP) (3)
($ in millions, except per share data)
Operating income:
Transportation Solutions
$
964
$
—
$
33
$
3
$
1,000
Industrial Solutions
426
11
28
1
466
Total
$
1,390
$
11
$
61
$
4
$
1,466
Operating margin
17.8
%
18.8
%
Income tax (expense) benefit
$
959
$
(2)
$
(11)
$
(1,254)
$
(308)
Effective tax rate
(69.2)
%
21.1
%
Income from continuing operations
$
2,345
$
9
$
50
$
(1,250)
$
1,154
Diluted earnings per share from continuing operations
$
7.54
$
0.03
$
0.16
$
(4.02)
$
3.71
(1) The tax effect of each non-GAAP adjustment is calculated based on the jurisdictions in which the expense (income) is incurred and the tax laws in effect for each such jurisdiction.
(2) Includes an $874 million net income tax benefit associated with a ten-year tax credit obtained by a Swiss subsidiary and a $262 million income tax benefit related to the revaluation of deferred tax assets as a result of a corporate tax rate increase in Switzerland. Also includes a $118 million income tax benefit associated with the tax impacts of a legal entity restructuring with related costs of $4 million recorded in selling, general, and administrative expenses for other non-income taxes.
(3) See description of non-GAAP financial measures.
TE CONNECTIVITY PLC
RECONCILIATION OF NON-GAAP FINANCIAL MEASURES TO GAAP FINANCIAL MEASURES
For the Quarter Ended June 28, 2024
(UNAUDITED)
Adjustments
Acquisition-
Restructuring
Related
and Other
Adjusted
U.S. GAAP
Charges (1)
Charges, Net (1)
(Non-GAAP) (2)
($ in millions, except per share data)
Operating income:
Transportation Solutions
$
506
$
—
$
(8)
$
498
Industrial Solutions
249
5
14
268
Total
$
755
$
5
$
6
$
766
Operating margin
19.0
%
19.3
%
Income tax expense
$
(181)
$
—
$
4
$
(177)
Effective tax rate
24.0
%
23.1
%
Income from continuing operations
$
573
$
5
$
10
$
588
Diluted earnings per share from continuing operations
$
1.86
$
0.02
$
0.03
$
1.91
(1) The tax effect of each non-GAAP adjustment is calculated based on the jurisdictions in which the expense (income) is incurred and the tax laws in effect for each such jurisdiction.
(2) See description of non-GAAP financial measures.
TE CONNECTIVITY PLC
RECONCILIATION OF NON-GAAP FINANCIAL MEASURES TO GAAP FINANCIAL MEASURES
For the Year Ended September 27, 2024
(UNAUDITED)
Adjustments
Acquisition-
Restructuring
Related
and Other
Adjusted
U.S. GAAP
Charges (1)
Charges, Net (1)
Tax Items (2)
(Non-GAAP) (3)
($ in millions, except per share data)
Operating income:
Transportation Solutions
$
1,880
$
—
$
67
$
3
$
1,950
Industrial Solutions
916
21
99
1
1,037
Total
$
2,796
$
21
$
166
$
4
$
2,987
Operating margin
17.6
%
18.9
%
Income tax (expense) benefit
$
397
$
(3)
$
(29)
$
(1,016)
$
(651)
Effective tax rate
(14.2)
%
21.8
%
Income from continuing operations
$
3,194
$
18
$
137
$
(1,012)
$
2,337
Diluted earnings per share from continuing operations
$
10.34
$
0.06
$
0.44
$
(3.28)
$
7.56
(1) The tax effect of each non-GAAP adjustment is calculated based on the jurisdictions in which the expense (income) is incurred and the tax laws in effect for each such jurisdiction.
(2) Includes a $636 million net income tax benefit associated with a $972 million ten-year tax credit obtained by a Swiss subsidiary reduced by a $336 million valuation allowance related to the amount of the tax credit not expected to be realized. Also includes a $262 million income tax benefit related to the revaluation of deferred tax assets as a result of a corporate tax rate increase in Switzerland and a $118 million income tax benefit associated with the tax impacts of a legal entity restructuring with related costs of $4 million recorded in selling, general, and administrative expenses for other non-income taxes.
(3) See description of non-GAAP financial measures.
TE CONNECTIVITY PLC
RECONCILIATION OF FORWARD-LOOKING NON-GAAP FINANCIAL MEASURES
TO FORWARD-LOOKING GAAP FINANCIAL MEASURES
As of April 23, 2025
(UNAUDITED)
Outlook for
Quarter Ending
June 27,
2025
Diluted earnings per share from continuing operations
$
2.02
Restructuring and other charges, net
0.02
Acquisition-related charges
0.02
Adjusted diluted earnings per share from continuing operations (1)
$
2.06
Net sales growth
8.1
%
(Acquisitions) divestitures, net
(3.0)
Organic net sales growth (1)
5.1
%
(1) See description of non-GAAP financial measures.
View original content to download multimedia:https://www.prnewswire.com/news-releases/te-connectivity-delivers-sales-and-eps-above-guidance-in-second-quarter-of-fiscal-year-2025-302435176.html
SOURCE TE Connectivity plc


 Technology5 days ago
 Technology5 days ago
 Technology5 days ago
 Technology4 days ago
 Coin Market4 days ago
 Coin Market4 days ago
 Technology4 days ago