
Technology
eBay Inc. Reports First Quarter 2026 Results

Published
6 months agoon
By

Revenue of $3.1 billion, up 19% on an as-reported basis and up 17% on an FX-Neutral basis Gross Merchandise Volume (“GMV”) of $22.2 billion, up 18% on an as-reported basis and up 14% on an FX-Neutral basisGAAP and Non-GAAP earnings per diluted share of $1.12 and $1.66, respectively, on a continuing operations basisGAAP and Non-GAAP operating margins of 19.8% and 29.4%, respectivelyReturned $639 million to stockholders in Q1, including $500 million of share repurchases and $139 million paid in cash dividends
SAN JOSE, Calif., April 29, 2026 /PRNewswire/ — eBay Inc. (Nasdaq: EBAY), a global commerce leader that connects millions of buyers and sellers around the world, today reported financial results for its first quarter ended March 31, 2026.
“eBay’s first quarter results marked a strong start to the year,” said Jamie Iannone, Chief Executive Officer at eBay. “We accelerated GMV growth and delivered performance ahead of expectations. Our Focus Categories, C2C and recommerce strategic priorities are driving broad-based momentum, and strengthening our position as the marketplace of choice for enthusiasts.”
“Our strong first quarter results, characterized by robust GMV and revenue growth, along with healthy earnings, reflect the powerful operating leverage inherent in our business,” said Peggy Alford, Chief Financial Officer at eBay. “We remain committed to disciplined execution of our strategic priorities while continuing to allocate capital thoughtfully to drive long-term value and significant returns for our shareholders.”
First Quarter 2026 Business Highlights
eBay announced a definitive agreement to acquire Depop, a leading consumer-to-consumer (“C2C”) fashion marketplace, from Etsy, which would deepen eBay’s reach with younger, fashion-forward consumers and expand its presence in one of the most dynamic areas of resale.The company expanded eBay Live, its interactive live-stream shopping experience, to France, Italy and Canada, growing seller reach and deepening buyer engagement.eBay launched “The 30/30 Collection” on eBay Live, a Pokémon Day auction that showcased 30 years of iconic cards and memorabilia from top sellers, boosting engagement in one of the marketplace’s most popular Focus Categories.Goldin, an eBay company, reached an all-time quarterly GMV record in the first quarter, facilitated by a record-breaking $16.5 million sale of a PSA 10 Pikachu Illustrator card.eBay hosted several Bay Area activations for football’s biggest game, including the immersive eBay End Zone pop-up, celebrity-driven eBay Live shopping events and a community watch party. The events showcased eBay’s unique inventory and relevance across collectibles, fashion and sports memorabilia.eBay’s AI-powered card scanning feature, which surfaces historical pricing and population data from a single photo, expanded to include the company’s top five collectible card game genres, and surpassed 30 million cumulative scans.eBay released “The NYC Edit,” an online style guide highlighting what New Yorkers are buying and selling on eBay. The curated storefronts allowed buyers to shop directly from influencers’ closets, and was accompanied by a three-day in-person resale experience held in April.The company collaborated with Vogue on the Vogue Vintage Market pop-ups in New York, London and Berlin, featuring a curated selection of premium vintage pieces handpicked from eBay by leading voices in fashion. Select items were auctioned via eBay Live where customers around the world could participate and bid in real time.eBay announced a new partnership with Meta for the Facebook affiliate program, allowing creators to feature eBay’s inventory directly within their content, and helping sellers reach new, engaged buyers through social commerce.eBay expanded its financial services offerings in the U.K. by partnering with Liberis to add Flexible Growth Financing to its Seller Capital program, and introduced Pay by Bank at checkout through a partnership with TrueLayer, enabling instant, secure payments.The company announced the appointment of Brian Sharples to its Board of Directors. Mr. Sharples serves as Board Chair of GoDaddy, Inc., and previously co-founded and served as CEO and Chairman of HomeAway, Inc.
Impact
eBay released its inaugural Climate Transition Plan, a company-wide roadmap to reach net-zero greenhouse gas emissions by 2045. The plan details how eBay is well-positioned to drive sustainable commerce at scale, and as a result, create enduring value for customers, communities and the planet.eBay for Charity enabled buyers and sellers to raise nearly $60 million worldwide in the first quarter.eBay received numerous awards, including recognition from Fortune as one of America’s Most Innovative Companies 2026, from Newsweek as one of America’s Greenest Companies 2026, and from TIME as one of America’s Most Iconic Companies 2026.
First Quarter 2026 Financial Highlights
Revenue was $3.1 billion, up 19% on an as-reported basis and up 17% on a foreign exchange (“FX”) neutral basis.GMV was $22.2 billion, up 18% on an as-reported basis and up 14% on an FX-Neutral basis.GAAP net income from continuing operations was $512 million, or $1.12 per diluted share.Non-GAAP net income from continuing operations was $760 million, or $1.66 per diluted share.GAAP and Non-GAAP operating margins were 19.8% and 29.4%, respectively.Generated $970 million of operating cash flow and $898 million of free cash flow from continuing operations.Returned $639 million to stockholders, including $500 million of share repurchases and $139 million paid in cash dividends.
(In millions, except per share data and percentages)
First Quarter
2026
2025
Change
eBay Inc.
Net revenues
$ 3,089
$ 2,585
$ 504
19 %
GAAP – Continuing Operations
Net income
$ 512
$ 501
$ 11
2 %
Earnings per diluted share
$ 1.12
$ 1.05
$ 0.07
7 %
Non-GAAP – Continuing Operations
Net income
$ 760
$ 654
$ 106
16 %
Earnings per diluted share
$ 1.66
$ 1.37
$ 0.29
21 %
Other Selected Financial and Operational Results
Advertising revenue – The company’s total advertising offerings generated $581 million of revenue in the first quarter of 2026, representing 2.6% of GMV. First-party advertising products on the eBay platform delivered $555 million of revenue in the first quarter of 2026, up 33% on an as-reported basis and up 28% on an FX-Neutral basis.Operating margin – GAAP operating margin decreased to 19.8% for the first quarter of 2026, compared to 23.6% for the same period last year. Non-GAAP operating margin decreased to 29.4% for the first quarter of 2026, compared to 29.6% for the same period last year.Income tax rate – The GAAP effective tax rate for continuing operations for the first quarter of 2026 was 17.1%, compared to 20.4% for the first quarter of 2025. The non-GAAP effective tax rate for continuing operations for the first quarter of 2026 was 17.5%(1).Cash flow – The company generated $970 million of operating cash flow and $898 million of free cash flow during the first quarter of 2026 from continuing operations.Capital returns – The company repurchased $500 million of its common stock, or approximately 6 million shares, in the first quarter of 2026. The company’s total repurchase authorization remaining as of March 31, 2026 was approximately $2.3 billion. The company also paid cash dividends of $139 million during the first quarter of 2026.Cash and cash equivalents and non-equity investments – The company’s cash and cash equivalents and non-equity investments portfolio totaled $5.1 billion as of March 31, 2026.
(1) We are using a non-GAAP effective tax rate of 17.5% in 2026 for evaluating our operating results, up from 16.5% in 2025. This rate could continue to change for various reasons including significant changes in our geographic earnings mix or fundamental tax law changes in major jurisdictions in which we operate.
Business Outlook
eBay is providing the following guidance for continuing operations for the second quarter 2026.
(In billions, except per share data and percentages)
Q2 2026 Guidance
Revenue
$2.97 – $3.03
FX-Neutral Y/Y Growth
8% – 10%
Gross Merchandise Volume
$21.3 – $21.7
FX-Neutral Y/Y Growth
8% – 10%
Diluted GAAP EPS
$1.09 – $1.14
Diluted Non-GAAP EPS
$1.46 – $1.51
Dividend Declaration
eBay’s Audit Committee declared a second quarter 2026 cash dividend of $0.31 per share of the company’s common stock. The dividend is payable on June 12, 2026 to stockholders of record as of May 29, 2026.
Definitive Agreement to Acquire Depop, Inc.
In February 2026, eBay Inc. and Etsy, Inc. announced that they entered into a definitive agreement for eBay to acquire Depop, Inc. for approximately $1.2 billion in cash, subject to certain purchase price adjustments. The pending acquisition is now expected to close by the end of the third quarter of 2026, subject to the satisfaction of certain closing conditions and receipt of required regulatory approvals. eBay and Etsy have received regulatory clearances in the United States and Germany, and reviews are in progress in other markets, including the United Kingdom and Australia.
Quarterly Conference Call and Webcast
eBay Inc. will host a conference call to discuss first quarter 2026 results at 2:30 p.m. Pacific Time today. A live webcast of the conference call, together with a slide presentation that includes supplemental financial information and reconciliations of certain non-GAAP measures to their nearest comparable GAAP measures, can be accessed through the company’s Investor Relations website at https://investors.ebayinc.com. In addition, an archive of the webcast will be accessible for at least three months through the same link.
eBay Inc. uses its Investor Relations website at https://investors.ebayinc.com and social media channels as a means of disclosing material non-public information and for complying with its disclosure obligations under Regulation FD. Accordingly, investors should monitor this website, in addition to following our press releases, Securities and Exchange Commission (SEC) filings, public conference calls and webcasts.
About eBay
eBay Inc. (Nasdaq: EBAY) is a global commerce leader that connects people and builds communities to create economic opportunity for all. Our technology empowers millions of buyers and sellers in more than 190 markets around the world, providing everyone the opportunity to grow and thrive. Founded in 1995 in San Jose, California, eBay is one of the world’s largest and most vibrant marketplaces for discovering great value and unique selection. In 2025, eBay enabled nearly $80 billion of gross merchandise volume. For more information about the company and its global portfolio of online brands, visit www.ebayinc.com.
Presentation
All growth rates represent year-over-year comparisons, except as otherwise noted. All amounts in tables are presented in U.S. dollars, rounded to the nearest million, except as otherwise noted. As a result, certain amounts may not sum or recalculate using the rounded dollar amounts provided. References to “revenue” refer to “net revenues” as reported in the company’s consolidated statement of income.
New Accounting Standard
In September 2025, the Financial Accounting Standards Board issued Accounting Standards Update (“ASU”) 2025-06, Intangibles—Goodwill and Other—Internal-Use Software (Subtopic 350-40): Accounting for and Disclosure of Software Costs. eBay adopted the standard effective January 1, 2026 using the full retrospective method, which required the restatement of each prior reporting period presented.
Non-GAAP Financial Measures
This press release includes the following financial measures defined as “non-GAAP financial measures” by the SEC: non-GAAP net income, non-GAAP earnings per diluted share, non-GAAP operating income and margin, non-GAAP effective tax rate, free cash flow and FX-Neutral basis. These non-GAAP financial measures are presented on a continuing operations basis. These measures may be different from non-GAAP financial measures used by other companies. The presentation of this financial information, which is not prepared under any comprehensive set of accounting rules or principles, is not intended to be considered in isolation of, or as a substitute for, the financial information prepared and presented in accordance with generally accepted accounting principles (“GAAP”). For a reconciliation of these non-GAAP financial measures, except for figures in this press release presented on an “FX-Neutral basis,” to the nearest comparable GAAP measures, see “Non-GAAP Measures of Financial Performance,” “Reconciliation of GAAP Operating Income to Non-GAAP Operating Income,” “Reconciliation of GAAP Net Income to Non-GAAP Net Income and GAAP Effective Tax Rate to Non-GAAP Effective Tax Rate” and “Reconciliation of Operating Cash Flow to Free Cash Flow” included in this press release. For figures in this press release reported “on an FX-Neutral basis,” we calculate the year-over-year impact of foreign currency movements using prior period foreign currency rates, excluding hedging activity, applied to current year transactional currency amounts.
Forward-Looking Statements
This press release contains forward-looking statements relating to, among other things, the future performance of eBay Inc. and its consolidated subsidiaries that are based on the company’s current expectations, forecasts and assumptions and involves risks and uncertainties. These statements include, but are not limited to, management’s vision for the future of eBay and our ability to accomplish our vision, expected financial results for the second quarter and full year 2026 and expected drivers thereof, the future growth in our business, and our ability to drive sustainable long-term growth and create lasting value for our stockholders, the impact of current and contemplated strategic initiatives and offerings, partnerships with and acquisitions of other companies, and new and updated product features or programs, including the initiatives, offerings, partnerships, acquisitions, features and programs discussed in our business highlights, the effects of foreign currency volatility and our ability to respond to such effects, operating efficiency and margins, and dividends and share repurchases.
Actual results could differ materially from those expressed or implied and reported results should not be considered as an indication of future performance. Factors that could cause or contribute to such differences include, but are not limited to: significant variation in our operating and financial results, including GMV and net revenues; our ability to compete in the markets in which we participate; our ability to generate revenue from our advertising products, including our Promoted Listings; our ability to generate consumer engagement and spending; our ability to keep pace with technological changes, including emerging AI technologies, and with changes in consumer demands and expectations; our ability to operate internationally and generate revenue from our international operations and our exposure to costs and risks in connection therewith; the impact of changes in global trade policies on our revenue, profit and ability to support cross-border trade; our ability to manage our buyer and seller trust protection programs; the risk of systems failures and business interruptions to our business; operation of and ongoing investment into our payments and financial services offerings; risk of fraud on our platforms; the impact of any cyberattacks or data security breaches; our ability to attract, retain and develop our senior managers and other key employees; our and our customers’ dependence on third-party providers, some of which are our competitors; the impact of our current, contemplated and future acquisitions, dispositions, joint ventures, strategic partnerships and strategic investments, including our expectations regarding the time to close, and our ability to close, and subsequently realize the projected benefits from, the pending Depop acquisition; the impact of extensive and increasing regulation and oversight that affect our business; the risk of liability for the actions of our customers, including products sold by sellers on our platforms; the impact of increasing levels of regulation in the areas of privacy, protection of user data and cybersecurity; the risks associated with third party allegations relating to intellectual property rights; current and potential litigation and regulatory and government inquiries, investigations and litigation involving us; the impact of evolving sales and other tax regimes in various jurisdictions; our ability to protect or enforce our intellectual property rights; risks and costs relating to stakeholder expectations around environmental, social and governance matters; potential exposure to claims and liabilities as a result of the distribution of PayPal; the risk of exposure to greater than anticipated tax liabilities; fluctuations in interest rates, and changes in regulatory guidance relating thereto; fluctuations in foreign currency exchange rates; our ability to generate sufficient cash flow to service our indebtedness and to comply with financial covenants in our outstanding debt instruments; and the risk that our stock repurchases may not be effected or may not achieve the desired objectives.
The forward-looking statements in this release do not include the potential impact of any acquisitions or divestitures that may be announced and/or completed after the date hereof.
More information about factors that could affect the company’s operating results is included under the captions “Risk Factors” and “Management’s Discussion and Analysis of Financial Condition and Results of Operations” in the company’s most recent Annual Report on Form 10-K and subsequent Quarterly Reports on Form 10-Q, copies of which may be obtained by visiting the company’s Investor Relations website at https://investors.ebayinc.com or the SEC’s website at www.sec.gov. Undue reliance should not be placed on the forward-looking statements in this press release, which are based on information available to the company on the date hereof. The company assumes no obligation to update such statements.
eBay Inc.
Unaudited Condensed Consolidated Balance Sheet
March 31,
2026
December 31,
2025
(In millions)
ASSETS
Current assets:
Cash and cash equivalents
$ 2,894
$ 1,867
Short-term investments
966
1,052
Customer accounts and funds receivable
1,490
1,280
Other current assets
909
887
Total current assets
6,259
5,086
Long-term investments
2,010
2,767
Property and equipment, net
1,198
1,165
Goodwill
4,463
4,467
Operating lease right-of-use assets
446
428
Deferred tax assets
2,949
2,959
Other assets
568
565
Total assets
$ 17,893
$ 17,437
LIABILITIES AND STOCKHOLDERS’ EQUITY
Current liabilities:
Short-term debt
$ 750
$ 750
Accounts payable
311
242
Customer accounts and funds payable
1,491
1,280
Accrued expenses and other current liabilities
2,457
2,257
Income taxes payable
125
108
Total current liabilities
5,134
4,637
Operating lease liabilities
332
315
Deferred tax liabilities
1,438
1,431
Long-term debt
5,994
5,996
Other liabilities
583
575
Total liabilities
13,481
12,954
Total stockholders’ equity
4,412
4,483
Total liabilities and stockholders’ equity
$ 17,893
$ 17,437
eBay Inc.
Unaudited Condensed Consolidated Statement of Income
Three Months Ended
March 31,
2026
2025
(In millions, except per share
amounts)
Net revenues
$ 3,089
$ 2,585
Cost of net revenues (1)
802
697
Gross profit
2,287
1,888
Operating expenses:
Sales and marketing (1)
673
536
Product development (1)
450
393
General and administrative (1)
410
261
Transaction losses
138
81
Amortization of acquired intangible assets
5
6
Total operating expenses
1,676
1,277
Income from operations
611
611
Interest and other:
Gain (loss) on equity investments and warrants, net
2
(2)
Interest expense
(61)
(61)
Interest income and other, net
66
81
Income from continuing operations before income taxes
618
629
Income tax provision
(106)
(128)
Income from continuing operations
512
501
Loss from discontinued operations, net of income taxes
—
(2)
Net income
$ 512
$ 499
Income per share – basic:
Continuing operations
$ 1.14
$ 1.07
Discontinued operations
—
—
Net income per share – basic
$ 1.14
$ 1.07
Income per share – diluted:
Continuing operations
$ 1.12
$ 1.05
Discontinued operations
—
—
Net income per share – diluted
$ 1.12
$ 1.05
Weighted average shares:
Basic
448
467
Diluted
457
475
(1) Includes stock-based compensation as follows:
Cost of net revenues
$ 11
$ 9
Sales and marketing
47
20
Product development
76
69
General and administrative
22
38
$ 156
$ 136
eBay Inc.
Unaudited Condensed Consolidated Statement of Cash Flows
Three Months Ended
March 31,
2026
2025
(In millions)
Cash flows from operating activities:
Net income
$ 512
$ 499
Loss from discontinued operations, net of income taxes
—
2
Adjustments:
Transaction losses
138
81
Depreciation and amortization
93
52
Stock-based compensation
156
136
Loss (gain) on investments and other, net
(31)
2
Deferred income taxes
21
30
Change in fair value of warrants
9
—
Changes in assets and liabilities, net of acquisition effects
72
(47)
Net cash provided by continuing operating activities
970
755
Net cash used in discontinued operating activities
(1)
—
Net cash provided by operating activities
969
755
Cash flows from investing activities:
Purchases of property and equipment
(72)
(111)
Purchases of investments
(364)
(3,043)
Maturities of investments
352
4,587
Sales of investments
684
—
Shareholder distributions from equity investments
194
—
Acquisitions and other
(11)
(89)
Net cash provided by investing activities
783
1,344
Cash flows from financing activities:
Proceeds from issuance of common stock
2
—
Repurchases of common stock
(486)
(615)
Payments for taxes related to net share settlements of restricted stock units and awards
(106)
(69)
Payments for dividends
(139)
(134)
Repayment of senior notes
—
(800)
Proceeds from issuance of commercial paper
—
568
Repayment of commercial paper
—
(441)
Net funds receivable and payable activity
168
243
Net cash used in financing activities
(561)
(1,248)
Effect of exchange rate changes on cash, cash equivalents and restricted cash
(12)
19
Net increase in cash, cash equivalents and restricted cash
1,179
870
Cash, cash equivalents and restricted cash at beginning of period
3,055
3,286
Cash, cash equivalents and restricted cash at end of period
$ 4,234
$ 4,156
eBay Inc.
Unaudited Summary of Consolidated Net Revenues
Three Months Ended
March 31,
2026
December 31,
2025
September 30,
2025
June 30,
2025
March 31,
2025
(In millions, except percentages)
Total net revenues (1)(2)
$ 3,089
$ 2,965
$ 2,820
$ 2,730
$ 2,585
Current quarter vs prior year quarter
19 %
15 %
9 %
6 %
1 %
Percent from international
44 %
46 %
48 %
49 %
48 %
(1) Hedge gain/(loss)
$ (13)
$ (19)
$ (24)
$ (6)
$ 8
(2) Foreign currency impact
$ 78
$ 16
$ 20
$ 32
$ (21)
eBay Inc.
Unaudited Supplemental Operating Data
Three Months Ended
March 31,
2026
December 31,
2025
September 30,
2025
June 30,
2025
March 31,
2025
(In millions, except percentages)
Active Buyers (1)
136
135
134
134
134
Current quarter vs prior year quarter
1 %
1 %
1 %
1 %
1 %
Active Buyers excluding Tise (2)
135
134
Gross Merchandise Volume (3)
U.S.
$ 11,503
$ 10,721
$ 9,872
$ 9,428
$ 9,066
Current quarter vs prior year quarter
27 %
19 %
13 %
7 %
1 %
International
$ 10,694
$ 10,516
$ 10,233
$ 10,086
$ 9,687
Current quarter vs prior year quarter
10 %
2 %
7 %
5 %
0 %
Total Gross Merchandise Volume
$ 22,197
$ 21,237
$ 20,105
$ 19,514
$ 18,753
Current quarter vs prior year quarter
18 %
10 %
10 %
6 %
1 %
(1)
Active Buyers consist of all buyers who paid for a transaction on our Marketplace platforms within the previous 12-month period. Buyers may register more than once, and as a result, may have more than one account.
(2)
On October 1, 2025, we completed the acquisition of Tise AS.
(3)
Gross Merchandise Volume consists of the total value of all paid transactions between users on our Marketplace platforms during the applicable period inclusive of shipping fees and taxes, without adjustment for returns or cancellations.
eBay Inc.
Business Outlook
The guidance figures provided below and elsewhere in this press release are forward-looking statements, reflect a number of estimates, assumptions and other uncertainties, and are approximate in nature because the company’s future performance is difficult to predict. Such guidance is based on information available on the date of this press release, and the company assumes no obligation to update it.
The company’s future performance involves risks and uncertainties, and the company’s actual results could differ materially from the information below and elsewhere in this press release. Some of the factors that could affect the company’s operating results are set forth under the caption “Forward-Looking Statements” above in this press release. More information about factors that could affect the company’s operating results is included under the captions “Risk Factors” and “Management’s Discussion and Analysis of Financial Condition and Results of Operations” in the company’s most recent Annual Report on Form 10-K and subsequent Quarterly Reports on Form 10-Q, copies of which may be obtained by visiting eBay’s investor relations website at https://investors.ebayinc.com or the SEC’s website at www.sec.gov.
eBay Inc.
Three Months Ending
June 30, 2026
(In billions, except per share amounts)
GAAP
Non-GAAP (a)
Net revenues
$2.97 – $3.03
$2.97 – $3.03
Diluted EPS from continuing operations
$1.09 – $1.14
$1.46 – $1.51
Gross Merchandise Volume
$21.3 – $21.7
(a) Estimated non-GAAP amounts above for the three months ending June 30, 2026 reflect adjustments that exclude the estimated amortization of acquired intangible assets of approximately $12 million, estimated stock-based compensation expense and associated employer payroll tax expense of approximately $168-$178 million, and estimated adjustment between our GAAP and non-GAAP tax expense of approximately $(10)-$(20) million. The estimated GAAP diluted EPS above does not assume any gains or losses on our remaining equity investments.
eBay Inc.
Non-GAAP Measures of Financial Performance
To supplement the company’s condensed consolidated financial statements presented in accordance with generally accepted accounting principles, or GAAP, the company uses non-GAAP measures of certain components of financial performance. These non-GAAP measures include non-GAAP net income, non-GAAP earnings per diluted share, non-GAAP operating income and margin, non-GAAP effective tax rate, free cash flow and figures in this press release presented on an “FX-Neutral basis.” These non-GAAP financial measures are presented on a continuing operations basis.
These non-GAAP measures are not in accordance with, or an alternative to, measures prepared in accordance with GAAP and may be different from non-GAAP measures used by other companies. In addition, these non-GAAP measures are not based on any comprehensive set of accounting rules or principles. Non-GAAP measures have limitations in that they do not reflect all of the amounts associated with the company’s results of operations as determined in accordance with GAAP. These measures should only be used to evaluate the company’s results of operations in conjunction with the corresponding GAAP measures.
Reconciliation to the nearest GAAP measure of all non-GAAP measures included in this press release, except for figures in this press release presented on an “FX-Neutral basis,” can be found in the tables included in this press release. For figures in this press release reported on an “FX-Neutral basis,” the company calculates the year-over-year impact of foreign currency movements using prior period foreign currency rates, excluding hedging activity, applied to current year transactional currency amounts.
These non-GAAP measures are provided to enhance investors’ overall understanding of the company’s current financial performance and its prospects for the future. Specifically, the company believes the non-GAAP measures provide useful information to both management and investors by excluding certain expenses, gains and losses, or net purchases of property and equipment, as the case may be, that may not be indicative of its core operating results and business outlook. In addition, because the company has historically reported certain non-GAAP results to investors, the company believes that the inclusion of non-GAAP measures provides consistency in the company’s financial reporting.
For its internal budgeting process, and as discussed further below, the company’s management uses financial measures that do not include stock-based compensation expense, employer payroll taxes on stock-based compensation, amortization or impairment of acquired intangible assets, impairment of goodwill, amortization of deferred tax assets associated with the realignment of its legal structure and related foreign exchange effects, significant gains or losses from the disposal/acquisition of a business, certain gains and losses on investments including changes in fair value, changes in foreign currency exchange rates and the impact of any related foreign exchange derivative instruments, gains or losses associated with a warrant agreement that the company entered into with Adyen, restructuring-related charges and the income taxes associated with the foregoing. In addition to the corresponding GAAP measures, the company’s management also uses the foregoing non-GAAP measures in reviewing the financial results of the company.
The company excludes the following items from non-GAAP net income, non-GAAP earnings per diluted share, non-GAAP operating income and margin and non-GAAP effective tax rate:
Stock-based compensation expense and related employer payroll taxes. This expense consists of expenses for stock options, restricted stock and employee stock purchases. The company excludes stock-based compensation expense from its non-GAAP measures primarily because they are non-cash expenses that management does not believe are reflective of ongoing operating results. The related employer payroll taxes are dependent on the company’s stock price and the vesting of restricted stock by employees and the timing and size of stock option exercises, over which management has limited to no control, and as such management does not believe it correlates to the company’s operation of the business.
Amortization or impairment of acquired intangible assets, impairment of goodwill, certain amortization of deferred tax assets and related foreign exchange effects, significant gains or losses and transaction expenses from the acquisition or disposal of a business and certain gains or losses on investments. The company incurs amortization or impairment of acquired intangible assets and goodwill in connection with acquisitions and may incur significant gains or losses from the acquisition or disposal of a business and therefore excludes these amounts from its non-GAAP measures. The company also excludes certain gains and losses on investments. The company excludes the non-cash amortization of deferred tax assets associated with the realignment of its legal structure, which is not reduced by the effects of the Tax Cuts and Jobs Act, and related foreign exchange effects. The company excludes these items because management does not believe they correlate to the ongoing operating results of the company’s business.
Restructuring. These charges consist of expenses for employee severance and other exit and disposal costs. The company excludes significant restructuring charges primarily because management does not believe they are reflective of ongoing operating results.
Other certain significant gains, losses, or charges that are not indicative of the company’s core operating results. These are significant gains, losses, or charges during a period that are the result of isolated events or transactions which have not occurred frequently in the past and are not expected to occur regularly or be repeated in the future. The company excludes these amounts from its results primarily because management does not believe they are indicative of its current or ongoing operating results. These amounts include changes in fair value and the related change in foreign currency exchange rates of equity securities with readily determinable fair values, globally.
Change in fair market value of warrants. These are gains or losses associated with warrant agreements entered into with vendors, which are attributable to changes in fair value during the period.
Income tax effects and adjustments. We are using a non-GAAP tax rate of 17.5% for evaluating our operating results, up from 16.5% in 2025. This rate could change for various reasons including significant changes in our geographic earnings mix or fundamental tax law changes in major jurisdictions in which we operate.
In addition to the non-GAAP measures discussed above, the company also uses free cash flow. Free cash flow represents operating cash flows less purchases of property and equipment. The company considers free cash flow to be a liquidity measure that provides useful information to management and investors about the amount of cash generated by the business after the purchases of property, buildings, and equipment, which can then be used to, among other things, invest in the company’s business, make strategic acquisitions, repurchase stock and pay dividends. A limitation of the utility of free cash flow as a measure of financial performance is that it does not represent the total increase or decrease in the company’s cash balance for the period and does not exclude certain non-discretionary expenditures, such as mandatory debt service requirements.
eBay Inc.
Reconciliation of GAAP Operating Income to Non-GAAP Operating Income
Three Months Ended
March 31,
2026
2025
(In millions, except
percentages)
GAAP operating income
$ 611
$ 611
Stock-based compensation expense and related employer payroll taxes
167
144
Amortization of acquired intangible assets within cost of net revenues and operating expenses
12
12
Restructuring and executive bonuses
104
—
Other general and administrative expenses
13
—
Total non-GAAP operating income adjustments
296
156
Non-GAAP operating income
$ 907
$ 767
GAAP operating margin
19.8 %
23.6 %
Non-GAAP operating margin
29.4 %
29.6 %
Presented on a continuing operations basis
Reconciliation of GAAP Net Income to Non-GAAP Net Income and
GAAP Effective Tax Rate to Non-GAAP Effective Tax Rate
Three Months Ended
March 31,
2026
2025
(In millions, except per share
amounts and percentages)
GAAP income from continuing operations before income taxes
$ 618
$ 629
GAAP provision for income taxes
(106)
(128)
GAAP net income from continuing operations
$ 512
$ 501
Non-GAAP adjustments to net income from continuing operations:
Non-GAAP operating income from continuing operations adjustments (see table above)
$ 296
$ 156
Change in fair value of other equity investments
(1)
(3)
Change in fair value of warrants
9
—
Income tax effects and adjustments
(56)
—
Non-GAAP net income from continuing operations
$ 760
$ 654
Diluted net income from continuing operations per share:
GAAP
$ 1.12
$ 1.05
Non-GAAP
$ 1.66
$ 1.37
Shares used in GAAP diluted net income per share calculation
457
475
Shares used in non-GAAP diluted net income per share calculation
457
475
GAAP effective tax rate – Continuing operations
17.1 %
20.4 %
Income tax effects and adjustments to net income from continuing operations
0.4 %
(3.9) %
Non-GAAP effective tax rate – Continuing operations
17.5 %
16.5 %
Presented on a continuing operations basis
Reconciliation of Operating Cash Flow to Free Cash Flow
Three Months Ended
March 31,
2026
2025
(In millions)
Net cash provided by continuing operating activities
$ 970
$ 755
Less: Purchases of property and equipment
(72)
(111)
Free cash flow
$ 898
$ 644
Presented on a continuing operations basis
View original content to download multimedia:https://www.prnewswire.com/news-releases/ebay-inc-reports-first-quarter-2026-results-302757831.html
SOURCE eBay Inc.

You may like
Technology
LEO Satellite Market worth $43.37 billion by 2031 – Exclusive Report by MarketsandMarkets™
Published
49 minutes agoon
October 30, 2026By

DELRAY BEACH, Fla., Oct. 30, 2026 /PRNewswire/ — According to MarketsandMarkets™, the LEO satellites market is estimated at USD 12.82 billion in 2026 and is projected to reach USD 43.37 billion by 2031 at a CAGR of 27.6% during the forecast period.
Browse 300 market data Tables and 100 Figures spread through 350 Pages and in-depth TOC on ‘LEO Satellite Market – Global Forecast to 2031’
LEO Satellite Market Size & Forecast:
Market Size Available for Years: 2021–20312026 Market Size: USD 12.82 billion2031 Projected Market Size: USD 43.37 billionCAGR (2026–2031): 27.6%
LEO Satellite Market Trends & Insights:
The LEO satellites market is growing as satellite networks expand for communication, Earth observation, navigation, and defense applications. Developments in small satellite platforms, software-defined payloads, optical communication, and onboard data processing are helping operators improve coverage, reduce latency, and support a wider range of missions in low Earth orbit.By satellite mass, Small satellites are the fastest-growing segment due to the increasing deployment of LEO constellations for broadband communication, Earth observation, and defense applications. Their lower development and launch costs, shorter manufacturing cycles, and ability to be deployed in large constellations are supporting adoption among commercial operators, government agencies, and defense organizations.By application, Navigation satellites are the fastest-growing segment due to the rising demand for more accurate positioning, navigation, and timing services across transportation, defense, aviation, maritime, and autonomous systems. Increasing deployment of LEO-based navigation and PNT augmentation systems, along with the need for lower latency, stronger signal availability, and greater resilience than traditional navigation architectures, is supporting segmental growth.By customer type, Defense is the fastest-growing segment due to the increasing use of LEO satellites for secure communications, ISR, navigation support, and persistent monitoring. Rising defense investment in resilient space architectures, proliferated LEO constellations, and low-latency satellite networks is supporting adoption across military forces and defense agencies.By region, the Middle East is the fastest-growing region in the LEO satellites market, driven by rising investment in satellite communications, Earth observation, defense surveillance, and national space programs. Growing demand for secure connectivity across remote areas, expanding defense and border-monitoring requirements, and new satellite initiatives in countries such as the UAE and Saudi Arabia are supporting regional market growth due to increasing investment in drone detection across military bases, airports, borders, and critical infrastructure. Growing concerns around unauthorized drone activity and continued deployment of radar, RF, EO/IR, and multi-sensor systems are supporting regional growth.
Download PDF Brochure: https://www.marketsandmarkets.com/pdfdownloadNew.asp?id=252330251
LEO satellite operators are creating sustained demand through frequent replenishment and replacement of spacecraft. Satellites in low Earth orbit usually have shorter operating lives than larger satellites in higher orbits. Constellations therefore require regular launches to replace aging satellites, to maintain coverage and introduce upgraded payloads. Operators can also refresh technology faster as communication, processing and sensing requirements change. Planned deorbiting and debris mitigation requirements further increase the need for replacement satellites over time. This creates recurring demand for satellite platforms, propulsion systems, power systems, antennas and payloads. Large constellations also support repeat production, which allows manufacturers to maintain continuous assembly lines and improve production efficiency globally.
By customer type, the commercial segment is estimated to hold the second-largest market share in 2026.
The segment is supported by the growing deployment of LEO constellations for broadband, Earth observation, direct-to-device connectivity and data services. Commercial operators are benefiting from the scalable networks that allow capacity to be added as demand grows. Moreover, they also use standardized satellite buses and high-rate production to reduce costs and shorten deployment timelines. Large programs such as SpaceX Starlink and Amazon Project Kuiper are increasing satellite volumes and replacement demand. Earth observation companies are also deploying smaller satellites with shorter refresh cycles. These factors are supporting steady commercial demand across LEO satellite platforms, payloads, and related subsystems.
By frequency band, laser/optical band is expected to be the fastest-growing segment between 2026 and 2031.
The segment is expected to grow rapidly as LEO operators increase the use of optical inter-satellite links for high-capacity data transfer. Laser links allow satellites to exchange data directly in space without routing every transmission through ground stations. This reduces latency and improves network resilience. Optical links also avoid congestion in traditional RF spectrum and support higher data rates. Large constellations are increasingly adopting this architecture to move traffic across the network more efficiently. For instance, SpaceX Starlink is launching newer satellites using laser crosslinks for satellite-to-satellite communication.
Inquiry Before Buying: https://www.marketsandmarkets.com/Enquiry_Before_BuyingNew.asp?id=252330251
Europe is projected to be the largest LEO satellites industry during the forecast period.
Europe is expected to hold the largest market share due to strong government support, established satellite manufacturing capabilities, as well as growing sovereign connectivity programs. The region has a well-developed space ecosystem which is led by companies like Airbus, Thales Alenia Space, OHB, and Eutelsat OneWeb. Programs such as IRIS² are supporting the development of resilient satellite connectivity across the region. Europe also benefits from strong participation in ESA programs and a mature network of satellite subsystem suppliers. These factors are supporting sustained demand for LEO satellite platforms, payloads, and related subsystems.
Key Players in LEO satellites companies such as SpaceX (US), L3Harris Technologies (US), Lockheed Martin (US), Northrop Grumman (US), and Airbus Defence and Space (Netherlands).
Get 10% Free Customization on this Report: https://www.marketsandmarkets.com/requestCustomizationNew.asp?id=252330251
Browse Adjacent Market: Aerospace and Defence Market Research Reports &Consulting
See More Latest Aerospace and Defence Reports:
Solar Powered Drone Market Size, Share and Trends by Energy Architecture (Fully Solar-Electric UAV, Solar-Assisted Battery UAV), Drone Type (Small, Medium, Large), Operating Altitude, Application, and Region – Global Forecast to 2035
Space Cybersecurity Market Size, Share and Trends by Offering (Solutions (Network, Endpoint, Cloud, Application Security), Services), Platform (Satellites, Launch Vehicles, Ground Stations & Gateways), End User, Application, and Region – Global Forecast to 2031
About MarketsandMarkets™
MarketsandMarkets™ has been recognized as one of America’s Best Management Consulting Firms by Forbes, as per their recent report.
MarketsandMarkets™ is a blue ocean alternative in growth consulting and program management, leveraging a man-machine offering to drive supernormal growth for progressive organizations in the B2B space. With the widest lens on emerging technologies, we are proficient in co-creating supernormal growth for clients across the globe.
Today, 80% of Fortune 2000 companies rely on MarketsandMarkets, and 90 of the top 100 companies in each sector trust us to accelerate their revenue growth. With a global clientele of over 13,000 organizations, we help businesses thrive in a disruptive ecosystem.
The B2B economy is witnessing the emergence of $25 trillion in new revenue streams that are replacing existing ones within this decade. We work with clients on growth programs, helping them monetize this $25 trillion opportunity through our service lines – TAM Expansion, Go-to-Market (GTM) Strategy to Execution, Market Share Gain, Account Enablement, and Thought Leadership Marketing.
Built on the ‘GIVE Growth’ principle, we collaborate with several Forbes Global 2000 B2B companies to keep them future-ready. Our insights and strategies are powered by industry experts, cutting-edge AI, and our Market Intelligence Cloud, KnowledgeStore™, which integrates research and provides ecosystem-wide visibility into revenue shifts.
MarketsandMarkets™ SalesPlay is an AI-driven Revenue Intelligence Co-Pilot designed to help revenue teams prioritize the right accounts, identify critical changes early, and surface opportunities ahead of demand, so pipeline builds naturally and deals close with greater consistency.
To find out more, visit www.MarketsandMarkets™.com or follow us on Twitter, LinkedIn and Facebook.
Contact:
Mr. Rohan Salgarkar
MarketsandMarkets™ INC.
1615 South Congress Ave.
Suite 103, Delray Beach, FL 33445
USA: +1-888-600-6441
Email: sales@marketsandmarkets.com
Visit Our Website: https://www.marketsandmarkets.com/
Research Insight: https://www.marketsandmarkets.com/ResearchInsight/leo-satellite-market.asp
Content Source: https://www.marketsandmarkets.com/PressReleases/leo-satellite.asp
View original content to download multimedia:https://www.prnewswire.com/news-releases/leo-satellite-market-worth-43-37-billion-by-2031—exclusive-report-by-marketsandmarkets-302924720.html
SOURCE MarketsandMarkets
Technology
General Dynamics Reports Third-Quarter 2026 Financial Results
Published
49 minutes agoon
October 30, 2026By
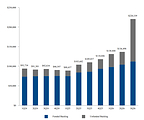
Revenue $14.6 billion, up 12.9% versus prior yearDiluted EPS $4.49, up 15.7% versus prior year$1.7 billion cash from operating activities, 139% of net earnings6.8-to-1 book-to-bill, $220 billion backlog
RESTON, Va., Oct. 30, 2026 /PRNewswire/ — General Dynamics (NYSE: GD) today reported third-quarter 2026 operating earnings of $1.5 billion, and $4.49 per diluted share (EPS), on revenue of $14.6 billion. Compared with the year-ago quarter, revenue increased 12.9%, operating earnings increased 14.7%, and diluted EPS increased 15.7%. Operating margin of 10.5% was a 20-basis-point expansion from the year-ago quarter.
“Our business had exceptional third quarter results, with revenue growth across all four segments, robust bookings and solid operational performance,” said Phebe Novakovic, chairman and chief executive officer. “With the consistent growth in our backlog and our significant investment in our businesses over the last decade, we are poised to drive continued performance in the years to come.”
Cash and Capital Deployment
Cash provided by operating activities in the quarter totaled $1.7 billion, or 139% of net earnings. During the quarter, the company paid $429 million in dividends, invested $481 million in capital expenditures, and reduced total debt by $500 million. The company ended the quarter with $7 billion in total debt and $4.4 billion in cash and equivalents on hand.
Orders and Backlog
Orders received in the quarter totaled $93.8 billion in the defense segments, driven by large orders in the Marine Systems segment for Virginia- and Columbia-class submarines, and $5 billion in the Aerospace segment, for a total of $98.8 billion. Book-to-bill ratio, defined as orders divided by revenue, was 8.5-to-1 for the quarter for the defense segments, 1.4-to-1 for the Aerospace segment, and 6.8-to-1 on a company-wide basis.
Backlog at the end of the quarter was $220.3 billion. Estimated potential contract value, representing management’s estimate of additional value in unfunded indefinite delivery, indefinite quantity (IDIQ) contracts and unexercised options, was $50.4 billion. Total estimated contract value, the sum of backlog plus estimated potential contract value, was $270.7 billion.
About General Dynamics
Headquartered in Reston, Virginia, General Dynamics is a global aerospace and defense company that offers a broad portfolio of products and services in business aviation; ship construction and repair; land combat vehicles, weapon systems and munitions; and technology products and services. General Dynamics employs more than 120,000 people worldwide and generated $52.6 billion in revenue in 2025. More information is available at www.gd.com.
WEBCAST INFORMATION: General Dynamics’ financial results conference call will be held on Friday, October 30, 2026, at 9:00 a.m. EDT. A link to the live webcast will be available at www.gd.com and will be available for replay following the call. Corresponding presentation slides will be available for download prior to the call.
This press release may contain forward-looking statements (FLS), including statements about the company’s future operational and financial performance, which are based on management’s expectations, estimates, projections and assumptions. Words such as “expects,” “anticipates,” “plans,” “believes,” “forecasts,” “scheduled,” “outlook,” “estimates,” “should” and variations of these words and similar expressions are intended to identify FLS. In making FLS, we rely on assumptions and analyses based on our experience and perception of historical trends; current conditions and expected future developments; and other factors, estimates and judgments we consider reasonable and appropriate based on information available to us at the time. FLS are made pursuant to the safe harbor provisions of the Private Securities Litigation Reform Act of 1995, as amended. FLS are not guarantees of future performance and involve factors, risks and uncertainties that are difficult to predict. Actual future results and trends may differ materially from what is forecast in the FLS. All FLS speak only as of the date they were made. We do not undertake any obligation to update or publicly release revisions to FLS to reflect events, circumstances or changes in expectations after the date of this press release. Additional information regarding these factors is contained in the company’s filings with the SEC, and these factors may be revised or supplemented in future SEC filings. In addition, this press release may contain some financial measures not prepared in accordance with U.S. generally accepted accounting principles (GAAP). While we believe these non-GAAP metrics provide useful information for investors, there are limitations associated with their use, and our calculations of these metrics may not be comparable to similarly titled measures of other companies. Non-GAAP metrics should not be considered in isolation from, or as a substitute for, GAAP measures. Reconciliations to comparable GAAP measures and other information relating to our non-GAAP measures are included in other filings with the SEC, which are available at investorrelations.gd.com.
EXHIBIT A
CONSOLIDATED STATEMENT OF EARNINGS – (UNAUDITED)
DOLLARS IN MILLIONS, EXCEPT PER SHARE AMOUNTS
Three Months Ended
Variance
October 4, 2026
September 28, 2025
$
%
Revenue
$ 14,566
$ 12,907
$ 1,659
12.9 %
Operating costs and expenses
(13,039)
(11,576)
(1,463)
Operating earnings
1,527
1,331
196
14.7 %
Other, net
4
15
(11)
Interest, net
(45)
(74)
29
Earnings before income tax
1,486
1,272
214
16.8 %
Provision for income tax, net
(257)
(213)
(44)
Net earnings
$ 1,229
$ 1,059
$ 170
16.1 %
Earnings per share—basic
$ 4.55
$ 3.93
$ 0.62
15.8 %
Basic weighted average shares outstanding
270.2
269.2
Earnings per share—diluted
$ 4.49
$ 3.88
$ 0.61
15.7 %
Diluted weighted average shares outstanding
273.8
272.6
EXHIBIT B
CONSOLIDATED STATEMENT OF EARNINGS – (UNAUDITED)
DOLLARS IN MILLIONS, EXCEPT PER SHARE AMOUNTS
Nine Months Ended
Variance
October 4, 2026
September 28, 2025
$
%
Revenue
$ 42,141
$ 38,171
$ 3,970
10.4 %
Operating costs and expenses
(37,734)
(34,267)
(3,467)
Operating earnings
4,407
3,904
503
12.9 %
Other, net
18
51
(33)
Interest, net
(163)
(251)
88
Earnings before income tax
4,262
3,704
558
15.1 %
Provision for income tax, net
(748)
(637)
(111)
Net earnings
$ 3,514
$ 3,067
$ 447
14.6 %
Earnings per share—basic
$ 13.01
$ 11.41
$ 1.60
14.0 %
Basic weighted average shares outstanding
270.2
268.8
Earnings per share—diluted
$ 12.83
$ 11.29
$ 1.54
13.6 %
Diluted weighted average shares outstanding
273.8
271.8
EXHIBIT C
REVENUE AND OPERATING EARNINGS BY SEGMENT – (UNAUDITED)
DOLLARS IN MILLIONS
Three Months Ended
Variance
October 4, 2026
September 28, 2025
$
%
Revenue:
Aerospace
$ 3,536
$ 3,234
$ 302
9.3 %
Marine Systems
4,960
4,096
864
21.1 %
Combat Systems
2,386
2,252
134
6.0 %
Technologies
3,684
3,325
359
10.8 %
Total
$ 14,566
$ 12,907
$ 1,659
12.9 %
Operating earnings:
Aerospace
$ 513
$ 430
$ 83
19.3 %
Marine Systems
391
291
100
34.4 %
Combat Systems
330
335
(5)
(1.5) %
Technologies
346
327
19
5.8 %
Corporate
(53)
(52)
(1)
(1.9) %
Total
$ 1,527
$ 1,331
$ 196
14.7 %
Operating margin:
Aerospace
14.5 %
13.3 %
Marine Systems
7.9 %
7.1 %
Combat Systems
13.8 %
14.9 %
Technologies
9.4 %
9.8 %
Total
10.5 %
10.3 %
EXHIBIT D
REVENUE AND OPERATING EARNINGS BY SEGMENT – (UNAUDITED)
DOLLARS IN MILLIONS
Nine Months Ended
Variance
October 4, 2026
September 28, 2025
$
%
Revenue:
Aerospace
$ 10,340
$ 9,322
$ 1,018
10.9 %
Marine Systems
13,963
11,905
2,058
17.3 %
Combat Systems
6,959
6,711
248
3.7 %
Technologies
10,879
10,233
646
6.3 %
Total
$ 42,141
$ 38,171
$ 3,970
10.4 %
Operating earnings:
Aerospace
$ 1,516
$ 1,265
$ 251
19.8 %
Marine Systems
1,049
832
217
26.1 %
Combat Systems
958
950
8
0.8 %
Technologies
1,024
987
37
3.7 %
Corporate
(140)
(130)
(10)
(7.7) %
Total
$ 4,407
$ 3,904
$ 503
12.9 %
Operating margin:
Aerospace
14.7 %
13.6 %
Marine Systems
7.5 %
7.0 %
Combat Systems
13.8 %
14.2 %
Technologies
9.4 %
9.6 %
Total
10.5 %
10.2 %
EXHIBIT E
CONSOLIDATED BALANCE SHEET
DOLLARS IN MILLIONS
(Unaudited)
October 4, 2026
December 31, 2025
ASSETS
Current assets:
Cash and equivalents
$ 4,388
$ 2,333
Accounts receivable
2,529
2,406
Unbilled receivables
8,906
8,380
Inventories
9,124
9,232
Other current assets
1,926
1,897
Total current assets
26,873
24,248
Noncurrent assets:
Property, plant and equipment, net
7,853
7,525
Intangible assets, net
1,231
1,375
Goodwill
20,849
21,009
Other assets
3,399
3,092
Total noncurrent assets
33,332
33,001
Total assets
$ 60,205
$ 57,249
LIABILITIES AND SHAREHOLDERS’ EQUITY
Current liabilities:
Short-term debt and current portion of long-term debt
$ 756
$ 1,006
Accounts payable
3,166
2,678
Customer advances and deposits
11,083
9,824
Other current liabilities
3,821
3,288
Total current liabilities
18,826
16,796
Noncurrent liabilities:
Long-term debt
6,260
7,007
Other liabilities
7,827
7,824
Total noncurrent liabilities
14,087
14,831
Shareholders’ equity:
Common stock
482
482
Surplus
4,646
4,403
Retained earnings
46,299
44,080
Treasury stock
(23,403)
(22,860)
Accumulated other comprehensive loss
(732)
(483)
Total shareholders’ equity
27,292
25,622
Total liabilities and shareholders’ equity
$ 60,205
$ 57,249
EXHIBIT F
CONSOLIDATED STATEMENT OF CASH FLOWS – (UNAUDITED)
DOLLARS IN MILLIONS
Nine Months Ended
October 4, 2026
September 28, 2025
Cash flows from operating activities—continuing operations:
Net earnings
$ 3,514
$ 3,067
Adjustments to reconcile net earnings to net cash from operating activities:
Depreciation of property, plant and equipment
525
490
Amortization of intangible and finance lease right-of-use assets
173
182
Equity-based compensation expense
169
146
Deferred income tax provision
335
151
(Increase) decrease in assets, net of effects of business acquisitions:
Accounts receivable
(123)
(314)
Unbilled receivables
(480)
(415)
Inventories
108
(131)
Increase (decrease) in liabilities, net of effects of business acquisitions:
Accounts payable
488
119
Customer advances and deposits
1,232
45
Other, net
(196)
219
Net cash provided by operating activities
5,745
3,559
Cash flows from investing activities:
Capital expenditures
(918)
(552)
Other, net
18
130
Net cash used by investing activities
(900)
(422)
Cash flows from financing activities:
Dividends paid
(1,263)
(1,188)
Repayment of fixed-rate notes
(1,000)
(1,500)
Purchases of common stock
(604)
(600)
Proceeds from fixed-rate notes
—
747
Other, net
87
235
Net cash used by financing activities
(2,780)
(2,306)
Net cash used by discontinued operations
(10)
(8)
Net increase in cash and equivalents
2,055
823
Cash and equivalents at beginning of period
2,333
1,697
Cash and equivalents at end of period
$ 4,388
$ 2,520
EXHIBIT G
ADDITIONAL FINANCIAL INFORMATION – (UNAUDITED)
DOLLARS IN MILLIONS, EXCEPT PER SHARE AMOUNTS
Non-GAAP Financial Measures:
Third Quarter
Nine Months
2026
2025
2026
2025
Free cash flow:
Net cash provided by operating activities
$ 1,710
$ 2,109
$ 5,745
$ 3,559
Capital expenditures
(481)
(212)
(918)
(552)
Free cash flow (a)
$ 1,229
$ 1,897
$ 4,827
$ 3,007
October 4, 2026
December 31, 2025
Net debt:
Total debt
$ 7,016
$ 8,013
Less cash and equivalents
4,388
2,333
Net debt (b)
$ 2,628
$ 5,680
Supplemental Aerospace Data:
Third Quarter
Nine Months
2026
2025
2026
2025
Gulfstream Aircraft Deliveries (units):
Large-cabin aircraft
35
33
101
95
Mid-cabin aircraft
5
6
18
18
Total
40
39
119
113
Aerospace Book-to-Bill:
Orders (c)
$ 4,970
$ 4,053
$ 14,091
$ 10,417
Revenue
3,536
3,234
10,340
9,322
Book-to-Bill Ratio
1.4x
1.3x
1.4x
1.1x
(a)
We define free cash flow as net cash from operating activities less capital expenditures. We believe free cash flow is a useful measure
for investors because it portrays our ability to generate cash from our businesses for purposes such as repaying debt, funding business
acquisitions, paying dividends and repurchasing our common stock to cover dilution. We use free cash flow to assess the quality of our
earnings and as a key performance measure in evaluating management.
(b)
We define net debt as short- and long-term debt (total debt) less cash and equivalents. We believe net debt is a useful measure for
investors because it reflects the borrowings that support our operations and capital deployment strategy. We use net debt as an
important indicator of liquidity and financial position.
(c)
Excludes customer defaults, liquidated damages, cancellations, foreign exchange fluctuations and other backlog adjustments.
EXHIBIT H
BACKLOG – (UNAUDITED)
DOLLARS IN MILLIONS
Funded
Unfunded
Total
Backlog
Estimated
Potential
Contract Value*
Total
Estimated
Contract Value
Third Quarter 2026:
Aerospace
$ 24,460
$ 925
$ 25,385
$ 1,374
$ 26,759
Marine Systems
47,289
99,576
146,865
7,644
154,509
Combat Systems
26,983
1,701
28,684
9,588
38,272
Technologies
13,064
6,341
19,405
31,724
51,129
Total
$ 111,796
$ 108,543
$ 220,339
$ 50,330
$ 270,669
Second Quarter 2026:
Aerospace
$ 22,992
$ 985
$ 23,977
$ 1,170
$ 25,147
Marine Systems
42,356
22,826
65,182
7,442
72,624
Combat Systems
27,507
1,843
29,350
10,847
40,197
Technologies
11,256
6,733
17,989
30,945
48,934
Total
$ 104,111
$ 32,387
$ 136,498
$ 50,404
$ 186,902
Third Quarter 2025:
Aerospace
$ 19,476
$ 1,131
$ 20,607
$ 1,147
$ 21,754
Marine Systems
38,757
14,854
53,611
14,839
68,450
Combat Systems
17,232
1,470
18,702
9,553
28,255
Technologies
10,269
6,668
16,937
32,341
49,278
Total
$ 85,734
$ 24,123
$ 109,857
$ 57,880
$ 167,737
*
The estimated potential contract value includes work awarded on unfunded indefinite delivery, indefinite quantity (IDIQ) contracts and
unexercised options associated with existing firm contracts, including options and other agreements with existing customers to purchase
new aircraft and aircraft services. We recognize options in backlog when the customer exercises the option and establishes a firm order.
For IDIQ contracts, we evaluate the amount of funding we expect to receive and include this amount in our estimated potential contract
value. The actual amount of funding received in the future may be higher or lower than our estimate of potential contract value.
EXHIBIT H-1
BACKLOG – (UNAUDITED)
DOLLARS IN MILLIONS
https://mmx.prnewswire.com/media/MS2023592/ExhibitH1.jpg?id=OA3047375
View original content to download multimedia:https://www.prnewswire.com/news-releases/general-dynamics-reports-third-quarter-2026-financial-results-302924010.html
SOURCE General Dynamics
Technology
Delta Electronics Hosts Inaugural Future Industry Summit in Singapore and Inks Collaboration with the College of Design and Engineering at NUS to Advance Sustainable Data Center Innovation
Published
49 minutes agoon
October 30, 2026By

SINGAPORE, Oct. 30, 2026 /PRNewswire/ — Today, Delta Electronics, a global leader in power management and smart green solutions, hosted the annual Delta SEAO Future Industry Summit 2026 for the first time in Singapore, after seven consecutive editions in Thailand. Held under the theme “Advancing Regional Infrastructure for AI and Energy Transformation Evolution”, the Summit brought together over 200 prominent government officials, industry executives, academics, and media stakeholders to discuss solutions that accelerate the adoption of sustainable digital and energy infrastructure. This is aimed at supporting AI-driven growth across the Southeast Asia and Oceania (SEAO) region. At the Summit, Delta also deepened its collaboration with National University of Singapore (NUS) College of Design and Engineering (CDE) by joining the Sustainable Tropical Data Center Testbed (STDCT) Phase 2.0 Consortium to foster sustainable AI data center innovation.
Shan-Shan Guo, Delta’s Chief Brand Officer, said, “The energy transition is essential to addressing climate change. The rise of electrification and AI infrastructure is making the need for resilient, energy-efficient power infrastructure increasingly urgent. Since its founding 55 years ago, Delta has been committed to driving sustainability through innovation and energy conservation. We are honored to share at the Delta SEAO Future Industry Summit some of Delta’s key sustainability endeavors, including the acceleration of the energy transition with our microgrid solutions, helping customers move toward net zero carbon emissions with our ESG consulting services, and our coral restoration journey in Singapore and other regions. Together with our customers and partners, we are building a smarter, greener tomorrow.”
“Southeast Asia’s infrastructure needs are evolving rapidly as AI and electrification reshape the region. With its long-term development in power and thermal management, Delta brings deep expertise across power, cooling, automation and energy management,” said Jason Yuan, President of Delta Electronics Southeast Asia & Oceania. “Our strength lies in bringing these capabilities together to help build future-ready infrastructure that is reliable, scalable, efficient and adaptable to the region’s needs. That is the conversation we want to advance by bringing our annual SEAO Summit to Singapore.”
The program included executive keynotes and two panel discussions focused on energy infrastructure readiness for the region’s data centers and the role of industrial and building automation in sustainable manufacturing. The Singapore edition builds on Delta’s growing engagement across Southeast Asia, following the opening of its new Johor Bahru office and the Solutions Day forum in Kuala Lumpur in July. Together, these initiatives reflect Delta’s continued investment in the region and its focus on supporting the infrastructure demands created by AI, electrification and industrial transformation.
The Summit arrives as Southeast Asia’s data center power demand grows faster than any other region in the world. According to an IDC study commissioned by Delta (*), surveyed Southeast Asian operators reported 26-50% year-on-year growth in power demand, against 11-20% in the United States and Europe. 60% here are also already deploying, planning, or evaluating direct liquid cooling, the highest adoption rate of the three regions surveyed. The same study found that 24-26% of Southeast Asian operators cite cluster around power, grid, cooling capacity and equipment lead-time risks as their single biggest constraint on scaling.
Singapore is also investing in the infrastructure and research capabilities needed to support the next generation of data centers. The country is developing new approaches to tropical data center design and testing, including through the STDCT, hosted at the NUS CDE.
Collaboration with NUS to Advance Sustainable Data Center Innovation
Against this backdrop, Delta formalized today, at the Delta SEAO Future Industry Summit 2026, its deepening collaboration with NUS CDE through its participation in the Sustainable Tropical Data Centre Testbed Phase 2.0 (STDCT 2.0) Consortium. As part of the collaboration, Delta will provide NUS CDE with an AI Containerized Data Center and related equipment, to support research and testing of data center technologies suited to tropical conditions. The collaboration brings together Delta’s expertise in power, cooling, and data center infrastructure with NUS CDE’s research capabilities in tropical data center design and testing.
“AI is fundamentally changing the design envelope for data centers, with much higher power densities and thermal loads placing new demands on power, cooling and infrastructure efficiency,” said Professor Lee Poh Seng, Programme Director of STDCT 2.0 and Head of the Department of Mechanical Engineering at NUS CDE. “STDCT 2.0 is designed to bridge the gap between innovation and real-world deployment by providing a live environment in which next-generation technologies can be integrated, tested and validated under tropical operating conditions. Delta brings deep capabilities across power electronics, thermal management and data center infrastructure, and this collaboration will enable us to explore these technologies at system level and demonstrate measurable improvements in energy efficiency, water efficiency, reliability and climate resilience. Our goal is to generate solutions and evidence that can accelerate the deployment of more sustainable AI infrastructure in Singapore and across the wider region.”
As AI and electrification reshape infrastructure needs across Southeast Asia, the Delta SEAO Future Industry Summit 2026, held at Pan Pacific Orchard, brings these stakeholders together to fulfil the region’s infrastructure needs.
ABOUT DELTA ELECTRONICS INT’L (Singapore)
The company is a wholly owned subsidiary of Delta Electronics, Inc.
ABOUT DELTA
Delta, founded in 1971, and listed on the Taiwan Stock Exchange (code:2308), is a global leader in switching power supplies and thermal management products with a thriving portfolio of IoT-based smart energy-saving systems and solutions in the fields of industrial automation, building automation, telecom power, data center infrastructure, EV charging, renewable energy, energy storage and display, to nurture the development of smart manufacturing and sustainable cities. As a world-class corporate citizen guided by its mission statement, “To provide innovative, clean and energy-efficient solutions for a better tomorrow,” Delta leverages its core competence in high-efficiency power electronics and its ESG-embedded business model to address key environmental issues, such as climate change. Delta serves customers through its sales offices, R&D centers and manufacturing facilities spread over close to 200 locations across 5 continents.
Throughout its history, Delta has received various global awards and recognition for its business achievements, innovative technologies and dedication to ESG. Since 2011, Delta has been listed on the Dow Jones Best-in-Class World Index (formerly the DJSI World Index of Dow Jones Sustainability™ Indices) for 15 consecutive years. Delta has also won CDP with double A List for 4 times for its substantial contribution to climate change and water security issues and has been named Supplier Engagement Leader for its continuous development of a sustainable value chain for 8 consecutive years.
For detailed information about Delta, please visit: www.deltaww.com
About the Sustainable Tropical Data Centre Testbed (STDCT 2.0)
The Sustainable Tropical Data Centre Testbed (STDCT) is a joint research initiative led by the National University of Singapore (NUS) and hosted by its College of Design and Engineering, in collaboration with leading industry partners.
STDCT 2.0 focuses on developing energy-efficient data centre designs that can operate reliably in tropical climates. The programme serves as a live testbed to evaluate, validate, and deploy sustainable innovations that reduce energy and water consumption while supporting dense, AI-driven operations.
For more information, visit https://cde.nus.edu.sg/stdct/
*IDC InfoBrief, sponsored by Delta, Powering AI Growth: From Grid Constraints to Rack Readiness, #AP242570-IB, September 2026
View original content to download multimedia:https://www.prnewswire.com/apac/news-releases/delta-electronics-hosts-inaugural-future-industry-summit-in-singapore-and-inks-collaboration-with-the-college-of-design-and-engineering-at-nus-to-advance-sustainable-data-center-innovation-302924812.html
SOURCE Delta Electronics


LEO Satellite Market worth $43.37 billion by 2031 – Exclusive Report by MarketsandMarkets™

General Dynamics Reports Third-Quarter 2026 Financial Results

Delta Electronics Hosts Inaugural Future Industry Summit in Singapore and Inks Collaboration with the College of Design and Engineering at NUS to Advance Sustainable Data Center Innovation

Send Rakhi to UK swiftly with UK Gifts Portal

Whiteboard Series with NEAR | Ep: 45 Joel Thorstensson from ceramic.network

Nullmax and Renesas Forge Strategic Partnership to Deliver Competitive ADAS Solutions for the Global Market

Why You Should Build on #NEAR – Co-founder Illia Polosukhin at CV Labs
Whiteboard Series with NEAR | Ep: 45 Joel Thorstensson from ceramic.network

NEAR End of Year Town Hall 2021: The Open Web World, MetaBUILD 2 Hackathon and 2021 recap
Trending
-

 Near Videos4 days ago
NEAR is building a universal liquidity layer.
-

 Technology4 days ago
Tin Men Capital leads US$7.4M Series A for Vision AI startup Ailytics to expand across APAC, US and Gulf
-

 Technology4 days ago
TrueLoyal® Appoints Erica Thompson as Head of Loyalty
-

 Technology4 days ago
OASE+ and Elsevier Agree Next-Phase Read and Publish Agreement to Expand Open Access Publishing in Japan
-

 Coin Market3 days ago
Bitcoin ETFs claw back $110M after $774M exit
-

 Technology3 days ago
SPS Releases New Report on Turning Workplace Data and AI into a Competitive Advantage
-

 Technology4 days ago
FFR to Hold Listing Ceremony and Investor Day on October 26; FFAI Announces Rescheduling of YT Jia’s Investor Weekly Report to October 26
-
 Technology4 days ago
uSMART and PIVOT Fintech Introduce GlobalSave Portfolios Balanced Strategy on FollowSmart