
Technology
OUTFRONT Media Reports First Quarter 2026 Results

Published
6 months agoon
By

Revenues of $429.6 million
Operating income of $55.9 million
Net income attributable to OUTFRONT Media Inc. of $19.1 million
Adjusted OIBDA of $100.4 million
AFFO attributable to OUTFRONT Media Inc. of $61.0 million
Quarterly dividend of $0.30 per share, payable June 30, 2026
NEW YORK, May 7, 2026 /PRNewswire/ — OUTFRONT Media Inc. (NYSE: OUT) today reported results for the quarter ended March 31, 2026.
“Our first quarter results demonstrate our continued strong performance, with revenue, OIBDA, and AFFO all exceeding our guidance,” said Nick Brien, Chief Executive Officer of OUTFRONT Media. “Importantly, this exceptional performance was driven by strong results across our entire business, with billboard and transit both contributing to this success.”
Three Months Ended
March 31,
$ in Millions, except per share amounts
2026
2025
Revenues
$429.6
$390.7
Operating income
55.9
13.9
Adjusted OIBDA
100.4
64.2
Net income (loss) before allocation to redeemable and non-redeemable
noncontrolling interests
19.3
(20.7)
Net income (loss)1
19.1
(20.6)
Net income (loss) per share1,2,3
$0.11
($0.14)
Funds From Operations (FFO)1
63.5
26.5
Adjusted FFO (AFFO)1
61.0
27.1
Shares outstanding3
177.1
166.4
Notes: See exhibits for reconciliations of non-GAAP financial measures; 1) References to “Net income (loss)”, “FFO” and “AFFO” mean “Net income (loss) attributable to OUTFRONT Media Inc.”, “FFO attributable to OUTFRONT Media Inc.” and “AFFO attributable to OUTFRONT Media Inc.,” respectively; 2) References to “per share” mean per common share for diluted earnings per weighted average share; 3) Diluted weighted average shares outstanding.
First Quarter 2026 Results
Consolidated Results
Reported revenues of $429.6 million increased $38.9 million, or 10.0%, for the first quarter of 2026 as compared to the same prior-year period.
Total operating expenses of $227.5 million increased $6.2 million, or 2.8%, compared to the same prior-year period, due primarily to higher variable billboard property lease expenses, higher transit franchise costs, including higher guaranteed minimum annual payments to the New York Metropolitan Transportation Authority (the “MTA”) due to inflation, higher production expenses, and higher maintenance and utilities costs, partially offset by the impact of lost billboards in the period.
Selling, General and Administrative expenses (“SG&A”) of $107.3 million decreased $7.4 million, or 6.5%, compared to the same prior-year period, due primarily to lower compensation-related expenses, including severance and salaries, and lower credit card usage by customers, partially offset by higher professional fees, including software and technology expenses, a higher allowance for bad debt and higher client entertainment expenses.
Adjusted OIBDA of $100.4 million increased $36.2 million, or 56.4%, compared to the same prior-year period.
Segment Results
Billboard
Reported billboard segment revenues of $332.9 million increased $22.2 million, or 7.1%, compared to the same prior-year period, due primarily to higher proceeds from condemnations and an increase in average revenue per display (yield), including the impact of programmatic platforms on digital billboard revenues, partially offset by lost billboards in the period.
Operating expenses increased $3.5 million, or 2.4%, due primarily to higher variable billboard property lease costs, higher maintenance and utilities, higher site-related costs, and higher compensation-related expenses, partially offset by the impact of lost billboards in the period.
SG&A expenses increased $1.3 million, or 1.9%, due primarily to higher professional fees, including software and technology expenses, and a higher allowance for bad debt, partially offset by lower credit card usage by customers and lower compensation-related expenses.
Adjusted OIBDA of $116.4 million increased $17.4 million, or 17.6%, compared to the same prior-year period.
Transit
Reported transit segment revenues of $95.0 million increased $17.3 million, or 22.3%, compared to the same prior-year period, due primarily to an increase in average revenue per display (yield), partially offset by the impact of new and lost transit franchise contracts.
Operating expenses increased $3.0 million, or 4.0%, due primarily to higher guaranteed minimum annual payments to the MTA due to inflation, higher display production costs, and higher posting and rotation costs.
SG&A expenses increased $1.5 million, or 8.7%, due primarily to higher compensation-related expenses, including severance and commissions, higher professional fees, including higher software and technology expenses, partially offset by lower credit card usage by customers.
Adjusted OIBDA loss decreased $12.8 million, or 90.1%, compared to the same prior-year period.
Other
Reported revenues decreased $0.6 million, or 26.1%, operating expenses decreased $0.3 million, or 16.7%, and Adjusted OIBDA decreased $0.3 million, or 60.0%, compared to the same prior-year period, due primarily to a decrease in third-party digital equipment sales.
Corporate
Corporate expenses, excluding stock-based compensation, decreased $6.3 million, or 29.9%, compared to the same prior-year period to $14.8 million, due primarily to lower compensation-related expenses, including severance, and lower professional fees, including fees related to a management consulting project.
Interest Expense
Net interest expense in the first quarter of 2026 was $36.0 million, including amortization of deferred financing costs of $1.4 million, as compared to $36.0 million, including amortization of deferred financing costs of $1.5 million, in the same prior-year period. The weighted average cost of debt was 5.3% as of March 31, 2026 and 5.4% as of March 31, 2025.
Income Taxes
The provision for income taxes decreased $0.1 million, or 20.0%, in the first quarter of 2026 compared to the same prior-year period. Cash paid for income taxes in the three months ended March 31, 2026 was $0.4 million.
Net Income Attributable to OUTFRONT Media Inc.
Net income attributable to OUTFRONT Media Inc. was $19.1 million in the first quarter of 2026 compared to a Net loss attributable to OUTFRONT Media Inc. of $20.6 million in the same prior-year period. Diluted weighted average shares outstanding were 177.1 million for the first quarter of 2026 compared to 166.4 million for the same prior-year period. Net income per common share for diluted earnings per weighted average share was $0.11 in the first quarter of 2026 compared to a Net loss per common share for diluted earnings per weighted average share of $0.14 in the same prior-year period.
FFO
FFO attributable to OUTFRONT Media Inc. was $63.5 million in the first quarter of 2026, an increase of $37.0 million, or 139.6%, from the same prior-year period, driven primarily by higher Adjusted OIBDA.
AFFO
Starting at the end of 2025, we modified our calculation of AFFO to include amortization of direct lease acquisition costs instead of cash paid for direct lease acquisition costs, as management believes that this calculation of AFFO is a more appropriate measure of performance period-over-period and consistent with how we calculate FFO. Accordingly, relevant prior periods have been recast to conform to this presentation.
AFFO attributable to OUTFRONT Media Inc. was $61.0 million in the first quarter of 2026, an increase of $33.9 million, or 125.1%, from the same prior-year period, due primarily to higher Adjusted OIBDA and a higher non-cash effect of straight-line rent, partially offset by lower equity earnings.
Cash Flow & Capital Expenditures
Net cash flow provided by operating activities of $75.3 million for the three months ended March 31, 2026, increased $41.7 million, or 124.1%, compared to $33.6 million in the same prior-year period, due primarily to higher net income, as adjusted for non-cash items, the timing of accounts receivables and a decrease in accounts payable and accrued expenses, partially offset by a decrease in deferred revenues. Total capital expenditures increased $6.9 million, or 40.1%, to $24.1 million for the three months ended March 31, 2026, compared to the same prior-year period, due primarily to increased growth in digital displays, increased maintenance spending for billboard display upgrades and increased spending for safety-related projects.
Dividends
In the three months ended March 31, 2026, we paid cash dividends of $53.4 million on our common stock and vested restricted share units granted to employees. We announced on May 7, 2026, that our board of directors has approved a quarterly cash dividend on our common stock of $0.30 per share payable on June 30, 2026, to stockholders of record at the close of business on June 5, 2026.
Balance Sheet and Liquidity
As of March 31, 2026, our liquidity position included unrestricted cash of $67.2 million and $494.9 million of availability under our $500.0 million revolving credit facility, net of $5.1 million of issued letters of credit against the letter of credit facility sublimit under the revolving credit facility, and $150.0 million of additional availability under our accounts receivable securitization facility. During the three months ended March 31, 2026, no shares of our common stock were sold under our at-the-market equity offering program, of which $232.5 million remains available. Total indebtedness as of March 31, 2026 was $2.6 billion, excluding $14.8 million of deferred financing costs, and includes a $500.0 million term loan, $450.0 million of senior secured notes and $1.7 billion of senior unsecured notes.
Conference Call
We will host a conference call to discuss the results on May 7, 2026, at 4:30 p.m. Eastern Time. The conference call numbers are 833-461-5787 (U.S. callers) and 585-542-9983 (International callers) and the passcode for both is 404991578. Live and replay versions of the conference call will be webcast in the Investor Relations section of our website, www.outfront.com.
Supplemental Materials
In addition to this press release, we have provided a supplemental investor presentation which can be viewed on our website, www.outfront.com.
About OUTFRONT Media Inc.
OUTFRONT is one of the largest and most trusted out-of-home media companies in the U.S., helping brands connect with audiences in the moments and environments that matter most. As OUTFRONT evolves, it’s defining a new era of in-real-life (IRL) marketing, turning public spaces into platforms for creativity, connection, and cultural relevance. With a nationwide footprint across billboards, digital displays, transit systems, and other out-of-home formats, OUTFRONT turns creative into powerful real-world experiences. Its in-house agency, OUTFRONT STUDIOS, and award-winning innovation team, XLabs, deliver standout storytelling, supported by advanced technology and data tools that can drive measurable impact.
Contacts:
Investors
Media
Stephan Bisson
Courtney Richards
Investor Relations
Events & Communications
(212) 297-6573
(646) 876-9404
stephan.bisson@outfront.com
courtney.richards@outfront.com
Non-GAAP Financial Measures
In addition to the results prepared in accordance with generally accepted accounting principles in the United States (“GAAP”) provided throughout this document, this document and the accompanying tables include non-GAAP financial measures as described below. We calculate and define “Adjusted OIBDA” as operating income (loss) before depreciation, amortization, net (gain) loss on dispositions and stock-based compensation. We calculate Adjusted OIBDA margin by dividing Adjusted OIBDA by total revenues. Adjusted OIBDA and Adjusted OIBDA margin are among the primary measures we use for managing our business, evaluating our operating performance and planning and forecasting future periods, as each is an important indicator of our operational strength and business performance. Our management believes users of our financial data are best served if the information that is made available to them allows them to align their analysis and evaluation of our operating results along the same lines that our management uses in managing, planning and executing our business strategy. Our management also believes that the presentations of Adjusted OIBDA and Adjusted OIBDA margin, as supplemental measures, are useful in evaluating our business because eliminating certain non-comparable items highlight operational trends in our business that may not otherwise be apparent when relying solely on GAAP financial measures. It is management’s opinion that these supplemental measures provide users of our financial data with an important perspective on our operating performance and also make it easier for users of our financial data to compare our results with other companies that have different financing and capital structures or tax rates. When used herein, references to “FFO” and “AFFO” mean “FFO attributable to OUTFRONT Media Inc.” and “AFFO attributable to OUTFRONT Media Inc.,” respectively. We calculate FFO in accordance with the definition established by the National Association of Real Estate Investment Trusts (“NAREIT”). FFO reflects net income (loss) attributable to OUTFRONT Media Inc. adjusted to exclude gains and losses from the sale of real estate assets, depreciation and amortization of real estate assets, amortization of direct lease acquisition costs and the same adjustments for our equity-based investments and redeemable and non-redeemable noncontrolling interests, as well as the related income tax effect of adjustments, as applicable. We calculate AFFO as FFO adjusted to include amortization of direct lease acquisition costs as such costs are generally amortized over a period ranging from four weeks to one year and therefore are incurred on a regular basis. AFFO also includes cash paid for maintenance capital expenditures since these are routine uses of cash that are necessary for our operations. In addition, AFFO excludes certain non-cash items, including non-real estate depreciation and amortization, stock-based compensation expense, accretion expense, the non-cash effect of straight-line rent, amortization of deferred financing costs and the same adjustments for our redeemable and non-redeemable noncontrolling interests, along with the non-cash portion of income taxes, and the related income tax effect of adjustments, as applicable. We use FFO and AFFO measures for managing our business and for planning and forecasting future periods, and each is an important indicator of our operational strength and business performance, especially compared to other real estate investment trusts (“REITs”). Our management believes users of our financial data are best served if the information that is made available to them allows them to align their analysis and evaluation of our operating results along the same lines that our management uses in managing, planning and executing our business strategy. Our management also believes that the presentations of FFO and AFFO, as supplemental measures, are useful in evaluating our business because adjusting results to reflect items that have more bearing on the operating performance of REITs highlight trends in our business that may not otherwise be apparent when relying solely on GAAP financial measures. It is management’s opinion that these supplemental measures provide users of our financial data with an important perspective on our operating performance and also make it easier to compare our results to other companies in our industry, as well as to REITs. Since Adjusted OIBDA, Adjusted OIBDA margin, FFO and AFFO are not measures calculated in accordance with GAAP, they should not be considered in isolation of, or as a substitute for, operating income (loss) and net income (loss) attributable to OUTFRONT Media Inc., the most directly comparable GAAP financial measures, as indicators of operating performance. These measures, as we calculate them, may not be comparable to similarly titled measures employed by other companies. In addition, these measures do not necessarily represent funds available for discretionary use and are not necessarily a measure of our ability to fund our cash needs.
Please see Exhibits 4-5 of this release for a reconciliation of the above non-GAAP financial measures to the most directly comparable GAAP financial measures.
Cautionary Statement Regarding Forward-Looking Statements
We have made statements in this document that are forward-looking statements within the meaning of the federal securities laws, including the Private Securities Litigation Reform Act of 1995. You can identify forward-looking statements by the use of forward-looking terminology such as “believes,” “expects,” “could,” “would,” “may,” “might,” “will,” “should,” “seeks,” “likely,” “intends,” “plans,” “projects,” “predicts,” “estimates,” “forecast” or “anticipates” or the negative of these words and phrases or similar words or phrases that are predictions of or indicate future events or trends and that do not relate solely to historical matters. You can also identify forward-looking statements by discussions of strategy, plans or intentions related to our capital resources, portfolio performance and results of operations. Forward-looking statements involve numerous risks and uncertainties and you should not rely on them as predictions of future events. Forward-looking statements depend on assumptions, data or methods that may be incorrect or imprecise and may not be able to be realized. We do not guarantee that the transactions and events described will happen as described (or that they will happen at all). The following factors, among others, could cause actual results and future events to differ materially from those set forth or contemplated in the forward-looking statements: declines in advertising and general economic conditions; competition; government regulation; our ability to operate our digital display platform; losses and costs resulting from recalls and product liability, warranty and intellectual property claims; our ability to obtain and renew key municipal contracts on favorable terms; taxes, fees and registration requirements; decreased government compensation for the removal of lawful billboards; content-based restrictions on outdoor advertising; seasonal variations; acquisitions and other strategic transactions that we may pursue could have a negative effect on our results of operations; dependence on our management team and other key employees; experiencing a cybersecurity incident; changes in regulations and consumer concerns regarding privacy, information security and data, or any failure or perceived failure to comply with these regulations or our internal policies; asset impairment charges for our long-lived assets and goodwill; environmental, health and safety laws and regulations; expectations relating to environmental, social and governance considerations; our substantial indebtedness; restrictions in the agreements governing our indebtedness; incurrence of additional debt; interest rate risk exposure from our variable-rate indebtedness; our ability to generate cash to service our indebtedness; cash available for distributions; hedging transactions; the ability of our board of directors to cause us to issue additional shares of stock without common stockholder approval; certain provisions of Maryland law may limit the ability of a third party to acquire control of us; our rights and the rights of our stockholders to take action against our directors and officers are limited; our failure to remain qualified to be taxed as a REIT; REIT distribution requirements; availability of external sources of capital; we may face other tax liabilities even if we remain qualified to be taxed as a REIT; complying with REIT requirements may cause us to liquidate investments or forgo otherwise attractive investments or business opportunities; our ability to contribute certain contracts to a taxable REIT subsidiary (“TRS”); our planned use of TRSs may cause us to fail to remain qualified to be taxed as a REIT; REIT ownership limits; complying with REIT requirements may limit our ability to hedge effectively; the ability of our board of directors to revoke our REIT election at any time without stockholder approval; the Internal Revenue Service may deem the gains from sales of our outdoor advertising assets to be subject to a 100% prohibited transaction tax; establishing operating partnerships as part of our REIT structure; and other factors described in our filings with the Securities and Exchange Commission (the “SEC”), including but not limited to the section entitled “Risk Factors” in our Annual Report on Form 10-K for the year ended December 31, 2025, filed with the SEC on February 26, 2026. All forward-looking statements in this document apply as of the date of this document or as of the date they were made and, except as required by applicable law, we disclaim any obligation to publicly update or revise any forward-looking statement to reflect changes in underlying assumptions or factors, of new information, data or methods, future events or other changes.
EXHIBITS
Exhibit 1: CONSOLIDATED STATEMENTS OF OPERATIONS
(Unaudited) See Notes on Page 14
Three Months Ended
March 31,
(in millions, except per share amounts)
2026
2025
Revenues
$ 429.6
$ 390.7
Expenses:
Operating
227.5
221.3
Selling, general and administrative
107.3
114.7
Net loss on dispositions
1.0
0.1
Depreciation
20.7
23.6
Amortization
17.2
17.1
Total expenses
373.7
376.8
Operating income
55.9
13.9
Interest expense, net
(36.0)
(36.0)
Income (loss) before provision for income taxes and equity in earnings of investee
companies
19.9
(22.1)
Provision for income taxes
(0.4)
(0.5)
Equity in earnings of investee companies, net of tax
(0.2)
1.9
Net income (loss) before allocation to redeemable and non-redeemable noncontrolling
interests
19.3
(20.7)
Net income (loss) attributable to redeemable and non-redeemable noncontrolling interests
0.2
(0.1)
Net income (loss) attributable to OUTFRONT Media Inc.
$ 19.1
$ (20.6)
Net income (loss) per common share:
Basic
$ 0.11
$ (0.14)
Diluted
$ 0.11
$ (0.14)
Weighted average shares outstanding:
Basic
175.5
166.4
Diluted
177.1
166.4
Exhibit 2: CONSOLIDATED STATEMENTS OF FINANCIAL POSITION
(Unaudited) See Notes on Page 14
As of
(in millions)
March 31,
2026
December 31,
2025
Assets:
Current assets:
Cash and cash equivalents
$ 67.2
$ 99.9
Receivables, less allowance ($25.0 in 2026 and $23.2 in 2025)
294.3
365.7
Prepaid lease and franchise costs
2.6
5.1
Prepaid MTA equipment deployment costs
0.2
—
Other prepaid expenses
25.6
21.9
Other current assets
11.6
11.1
Total current assets
401.5
503.7
Property and equipment, net
644.3
643.8
Goodwill
2,006.4
2,006.4
Intangible assets
603.6
612.0
Operating lease assets
1,553.8
1,521.5
Other assets
28.5
24.2
Total assets
$ 5,238.1
$ 5,311.6
Liabilities:
Current liabilities:
Accounts payable
$ 33.3
$ 50.2
Accrued compensation
42.4
72.3
Accrued interest
23.4
35.1
Accrued lease and franchise costs
62.7
72.2
Other accrued expenses
63.2
55.5
Deferred revenues
60.1
57.7
Short-term operating lease liabilities
179.5
172.9
Other current liabilities
27.6
29.4
Total current liabilities
492.2
545.3
Long-term debt, net
2,584.5
2,583.4
Asset retirement obligation
34.1
34.0
Operating lease liabilities
1,398.9
1,374.7
Other liabilities
39.2
40.3
Total liabilities
4,548.9
4,577.7
Commitments and contingencies
Redeemable noncontrolling interests
25.8
22.0
Stockholders’ equity:
Common stock (2026 – 450.0 shares authorized, and 176.1 shares issued and
outstanding; 2025 – 450.0 shares authorized, and 175.2 issued and outstanding)
1.8
1.8
Additional paid-in capital
2,604.6
2,619.3
Distribution in excess of earnings
(1,944.6)
(1,910.8)
Accumulated other comprehensive loss
0.1
0.1
Total stockholders’ equity
661.9
710.4
Noncontrolling interests
1.5
1.5
Total liabilities and equity
$ 5,238.1
$ 5,311.6
Exhibit 3: CONSOLIDATED STATEMENTS OF CASH FLOWS
(Unaudited) See Notes on Page 14
Three Months Ended
March 31,
(in millions)
2026
2025
Operating activities:
Net income (loss) attributable to OUTFRONT Media Inc.
$ 19.1
$ (20.6)
Adjustments to reconcile net income (loss) to net cash flow provided by operating activities:
Net income (loss) attributable to redeemable and non-redeemable noncontrolling interests
0.2
(0.1)
Depreciation and amortization
37.9
40.7
Stock-based compensation
5.6
9.5
Provision for doubtful accounts
2.2
1.5
Accretion expense
0.7
0.7
Net loss on dispositions
1.0
0.1
Equity in earnings of investee companies, net of tax
0.2
(1.9)
Distributions from investee companies
0.3
0.3
Amortization of deferred financing costs and debt discount and premium
1.4
1.5
Change in assets and liabilities, net of investing and financing activities:
Decrease in receivables
69.2
45.3
Increase in prepaid MTA equipment deployment costs
(0.2)
—
(Increase) decrease in prepaid expenses and other current assets
(3.5)
0.8
Decrease in accounts payable and accrued expenses
(57.1)
(67.8)
Increase in operating lease assets and liabilities
0.5
2.1
Increase in deferred revenues
2.4
16.7
Increase (decrease) in income taxes
—
0.5
Other, net
(4.6)
4.3
Net cash flow provided by operating activities
75.3
33.6
Investing activities:
Capital expenditures
(24.1)
(17.2)
Acquisitions
(8.1)
(5.7)
MTA franchise rights
(1.8)
(4.0)
Net proceeds from dispositions
—
0.7
Investment in investee companies
(4.0)
—
Return of investments in investee companies
—
1.5
Net cash flow used for investing activities
(38.0)
(24.7)
Financing activities:
Proceeds from borrowings under short-term debt facilities
—
50.0
Repayments of borrowings under short-term debt facilities
—
(10.0)
Taxes withheld for stock-based compensation
(16.6)
(12.3)
Dividends
(53.4)
(53.0)
Net cash flow used for financing activities
(70.0)
(25.3)
Exhibit 3: CONSOLIDATED STATEMENTS OF CASH FLOWS (Continued)
(Unaudited) See Notes on Page 14
Three Months Ended
March 31,
(in millions)
2026
2025
Net decrease in cash and cash equivalents
(32.7)
(16.4)
Cash and cash equivalents at beginning of period
99.9
46.9
Cash and cash equivalents at end of period
$ 67.2
$ 30.5
Supplemental disclosure of cash flow information:
Cash paid for income taxes
$ 0.4
$ —
Cash paid for interest
47.1
46.2
Non-cash investing and financing activities:
Accrued purchases of property and equipment
3.3
13.4
Accrued MTA franchise rights
1.9
1.6
Taxes withheld for stock-based compensation
2.8
2.6
Exhibit 4: SUPPLEMENTAL DISCLOSURES REGARDING NON-GAAP FINANCIAL INFORMATION
(Unaudited) See Notes on Page 14
Three Months Ended March 31, 2026
(in millions, except percentages)
Billboard
Transit
Other
Corporate
Consolidated
Revenues
$ 332.9
$ 95.0
$ 1.7
$ —
$ 429.6
Operating income (loss)
$ 82.5
$ (6.4)
$ 0.2
$ (20.4)
$ 55.9
Net loss on dispositions
0.9
0.1
—
—
1.0
Depreciation
18.1
2.6
—
—
20.7
Amortization
14.9
2.3
—
—
17.2
Stock-based compensation
—
—
—
5.6
5.6
Adjusted OIBDA
$ 116.4
$ (1.4)
$ 0.2
$ (14.8)
$ 100.4
Adjusted OIBDA margin
35.0 %
(1.5) %
11.8 %
*
23.4 %
Three Months Ended March 31, 2025
(in millions, except percentages)
Billboard
Transit
Other
Corporate
Consolidated
Revenues
$ 310.7
$ 77.7
$ 2.3
$ —
$ 390.7
Operating income (loss)
$ 61.0
$ (17.0)
$ 0.5
$ (30.6)
$ 13.9
Net (gain) loss on dispositions
0.7
(0.6)
—
—
0.1
Depreciation
21.6
2.0
—
—
23.6
Amortization
15.7
1.4
—
—
17.1
Stock-based compensation
—
—
—
9.5
9.5
Adjusted OIBDA
$ 99.0
$ (14.2)
$ 0.5
$ (21.1)
$ 64.2
Adjusted OIBDA margin
31.9 %
(18.3) %
21.7 %
*
16.4 %
Exhibit 5: SUPPLEMENTAL DISCLOSURES REGARDING NON-GAAP FINANCIAL MEASURES
(Unaudited) See Notes on Page 14
Three Months Ended
March 31,
(in millions)
2026
2025
Net income (loss) attributable to OUTFRONT Media Inc.
$ 19.1
$ (20.6)
Depreciation of billboard advertising structures
16.2
18.8
Amortization of real estate-related intangible assets
14.3
15.1
Amortization of direct lease acquisition costs
13.0
13.2
Net loss on disposition of real estate assets
1.0
0.1
Adjustment related to redeemable and non-redeemable noncontrolling interests
(0.1)
(0.1)
FFO attributable to OUTFRONT Media Inc.
$ 63.5
$ 26.5
Non-cash portion of income taxes
—
0.5
Cash paid for direct lease acquisition costs
(13.0)
(13.2)
Maintenance capital expenditures
(7.0)
(6.3)
Other depreciation
4.5
4.8
Other amortization
2.9
2.0
Stock-based compensation
5.6
9.5
Non-cash effect of straight-line rent
2.4
1.1
Accretion expense
0.7
0.7
Amortization of deferred financing costs
1.4
1.5
AFFO attributable to OUTFRONT Media Inc.(a)
$ 61.0
$ 27.1
Exhibit 6: SUPPLEMENTAL DISCLOSURES REGARDING NON-GAAP FINANCIAL MEASURES
(Unaudited) See Notes on Page 14
Three Months Ended
March 31,
(in millions)
2026
2025
Adjusted OIBDA
$ 100.4
$ 64.2
Interest expense, net, less amortization of deferred financing costs
(34.6)
(34.5)
Cash paid for income taxes
(0.4)
—
Maintenance capital expenditures
(7.0)
(6.3)
Equity in earnings of investee companies, net of tax
(0.2)
1.9
Non-cash effect of straight-line rent
2.4
1.1
Accretion expense
0.7
0.7
Adjustment related to redeemable and non-redeemable noncontrolling interests
(0.3)
—
AFFO attributable to OUTFRONT Media Inc.(a)
$ 61.0
$ 27.1
Exhibit 7: OPERATING EXPENSES
(Unaudited) See Notes on Page 14
Three Months Ended
March 31,
%
(in millions, except percentages)
2026
2025
Change
Operating expenses:
Billboard property lease
$ 111.3
$ 109.2
1.9 %
Transit franchise
59.7
58.0
2.9
Posting, maintenance and other
56.5
54.1
4.4
Total operating expenses
$ 227.5
$ 221.3
2.8
Exhibit 8: EXPENSES BY SEGMENT
(Unaudited) See Notes on Page 14
Three Months Ended
March 31,
%
(in millions, except percentages)
2026
2025
Change
Billboard:
Billboard property lease
$ 111.3
$ 109.2
1.9 %
Billboard posting, maintenance and other
37.1
35.7
3.9
Billboard operating expenses
$ 148.4
$ 144.9
2.4
Billboard SG&A expenses
$ 68.1
$ 66.8
1.9
Transit:
Transit franchise
$ 59.7
$ 58.0
2.9
Transit posting, maintenance and other
17.9
16.6
7.8
Transit operating expenses
$ 77.6
$ 74.6
4.0
Transit SG&A expenses
$ 18.8
$ 17.3
8.7
NOTES TO EXHIBITS
PRIOR PERIOD PRESENTATION CONFORMS TO CURRENT REPORTING CLASSIFICATIONS.
(a)
Starting at the end of 2025, we modified our calculation of AFFO to include amortization of direct lease acquisition costs instead of the cash paid for direct lease acquisition costs, as management believes that this calculation of AFFO is a more appropriate measure of performance period-over-period and consistent with how we calculate FFO. Accordingly, relevant prior periods have been recast to conform to this presentation.
* Calculation not meaningful.
View original content to download multimedia:https://www.prnewswire.com/news-releases/outfront-media-reports-first-quarter-2026-results-302766116.html
SOURCE OUTFRONT Media Inc.

You may like
Technology
Anrok launches MCP server, putting your tax data inside the AI tools your team already uses
Published
4 minutes agoon
October 21, 2026By
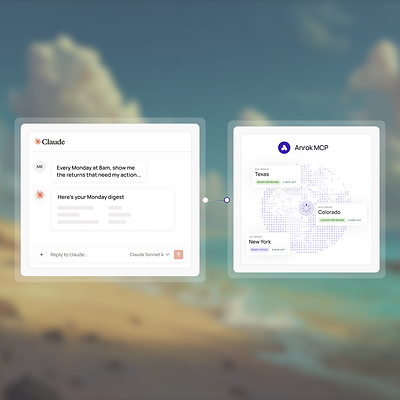
Ask in plain language, get an answer that spans your billing system and Anrok, and act on it without opening a dashboard.
SAN FRANCISCO, Oct. 21, 2026 /PRNewswire/ — Anrok, the AI-native tax infrastructure for global commerce, today launched the Anrok MCP. It is a direct connection between your Anrok account and the AI assistants your team already works in, including Claude, ChatGPT, Cursor, and VS Code. Your team can read transactions, filings, exposure, customers, exemption certificates, and products, then act on what it finds without leaving the conversation.
Finance teams adopted AI assistants faster than their finance systems. A controller can ask an assistant to draft a memo or model a scenario. But to answer, “did we collect the right tax in July?” they close the assistant, open a dashboard, run an export, and build a spreadsheet. Anrok believes your tax data shouldn’t stay behind a login.
Anrok MCP puts tax data in the same thread as everything else your assistant can reach, including your billing system, your inbox, and your spreadsheets.
“Finance teams are increasingly doing their work directly with AI agents and their tax data should be in there with them,” said Brad Silicani, CEO at Anrok. “Ask it to reconcile your billing system and Anrok, and you get the reconciliation in minutes for your close. The AI does the thinking, and Anrok MCP exposes the tools. It’s the same platform either way, and it’s accurate underneath.”
What your team can do
Anrok MCP includes 30+ tools across transactions, filings, exposure, customers, exemption certificates, and products. Your team can:
Reconcile Anrok against your billing system and find the gap before you remit.Pull a revenue or transaction answer without building a report.Review a filing before Anrok submits it and avoid the amended return.Debug a single transaction without opening a support ticket.Get a recommended tax category for a new SKU, then map it so it never falls through again.Catch exemption certificates before they lapse.
The MCP also writes. It can create a product, create a customer, create or update a transaction, and upload a certificate. Every write shows what moved, so you can check it.
One platform behind one connection
Anrok MCP is part of Headless Tax, the way into Anrok’s platform through the Anrok APIs and MCP. Behind it, one platform runs all five tax jobs: monitor and manage, register, calculate, file and remit, and reconcile and audit. That includes reconciliation, which no other tax platform has built in. One source of truth means one connection reaches your transactions, filings, exposure, customers, and certificates. The same intelligence powers Anrok across the dashboard, the API, and your agents.
“Anrok’s MCP cut our monthly Stripe-to-Anrok reconciliation from 4 hours to 30 minutes.” —Christie Perez, Indirect Tax Manager at Webflow
Availability
Anrok MCP is available now to Anrok customers. Connect from your AI tool’s connector settings, approve the scopes, and start asking. Documentation is at https://apidocs.anrok.com/mcp/.
About Anrok
Anrok is the AI-native tax infrastructure for global commerce. More than 5,500 users run sales tax and VAT/GST compliance on Anrok across 150+ countries, with more than $100B in processed volume. One platform runs all five compliance jobs, monitoring, registration, calculation, filing and remittance, and reconciliation, which no other tax platform has built in. Teams reach it however they work, in the product with Anrok Atlas, through the Anrok APIs, or by handing the job to an agent. The result is every tax dollar owed, collected, so tax becomes a pass-through instead of an expense.
Media contact
Emilie Murphy
emilie.murphy@anrok.com
View original content to download multimedia:https://www.prnewswire.com/news-releases/anrok-launches-mcp-server-putting-your-tax-data-inside-the-ai-tools-your-team-already-uses-302915878.html
SOURCE Anrok
Technology
Alternative Data Market to Reach USD 40.35 Billion by 2035 as AI Developers and Corporations Expand Data Buying, Credence Research Finds
Published
4 minutes agoon
October 21, 2026By

LONDON, Oct. 21, 2026 /PRNewswire/ — Credence Research Inc. has added a new global Alternative Data Market study to its market intelligence portfolio, examining the competitive, technological and regulatory factors shaping demand through 2035.
The global alternative data market was valued at USD 6.32 billion in 2025 and is projected to increase to USD 7.56 billion in 2026 before reaching USD 40.35 billion by 2035, according to Credence Research. The forecast represents a 20.37% compound annual growth rate from 2025 to 2035. All market sizes, segment shares and regional shares are Credence Research estimates.
Key Takeaways
Credence Research estimates 2025 revenue of USD 6.32 billion and a 2035 market value of USD 40.35 billion, equivalent to 20.37% annualized growth over 10 years.North America represented 57.3% of modeled global value in 2025.Card and receipt transactions led the data type category with a 22.4% share.Hedge funds accounted for 24.6% of the end user category.Web-scraped data is forecast to grow at 24.00% annually, while Technology and AI developers is projected at 28.50%.The analysis distinguishes market revenue from adjacent products and services to avoid treating unrelated spending as part of the addressable market.
Scope & Segmentation – Alternative Data Market
The study measures licensed nontraditional datasets used for investment research, commercial intelligence and AI applications, including card and receipt panels, web traffic, app use, web-scraped information, geolocation, satellite data and sentiment feeds. Conventional market prices, ratings, cloud storage and consulting fees are excluded. Revenue is allocated to the buyer geography and is expressed in current U.S. dollars. The report evaluates the commercial drivers, market restraints, supplier positions and technology transitions affecting this defined market.
By data type: Card and receipt transactions; Web traffic and app usage; Web-scraped data; Geolocation and foot traffic; Satellite and weather data; Social and sentiment data; Other ESG, employment and B2B data.By end user: Hedge funds; Asset managers and investment institutions; Retail and consumer companies; Technology and AI developers; Other corporates and public sector.By region: North America; Europe; Asia Pacific; Latin America; Middle East and Africa.
Explore the full report: https://www.credenceresearch.com/report/alternative-data-market
Why This Report Matters
Defines the revenue boundary around purchased information rather than bundling unrelated analytics software and financial reference data.Compares investment-firm demand with newer corporate and AI developer use cases, including the privacy and licensing requirements that shape adoption.Provides a framework for evaluating vendor quality, consent, geographic coverage and data reliability before buyers commit to long-term contracts.
Market Overview
Alternative data vendors increasingly sell the same underlying information to different buyer groups. Quantitative funds use transaction, web and location panels to estimate business performance before quarterly filings. Retailers apply those signals to site selection and competitor analysis, while AI developers license web and app information for model training and retrieval workflows.
The forecast reflects a modeled change in buyer adoption, supplier economics and product mix rather than a guarantee of future transactions. Credence Research evaluates these mechanisms alongside recent regulatory and corporate developments. Decision-makers should distinguish disclosed company announcements from estimates of total market revenue.
Market Insights
Base year: 2025; forecast horizon: 2035; modeled CAGR: 20.37%.Largest modeled geography: North America (57.3% of 2025 value).Leading categories: Card and receipt transactions (22.4%) and Hedge funds (24.6%).Fast-growth categories: Web-scraped data (24.00% CAGR) and Technology and AI developers (28.50% CAGR).Geographic and segment shares are proprietary Credence Research model outputs, not audited vendor market-share disclosures.
Key Attributes
Attribute
Details
Historical period
2018–2025, as listed in the report
Base year
2025
Forecast period
2025–2035
Market size, 2025
USD 6.32 billion
Estimated market size, 2026
USD 7.56 billion
Market size forecast, 2035
USD 40.35 billion
Revenue CAGR, 2025–2035
20.37 %
Coverage
Global
Segments covered
Data type; End user
Geographies
North America; Europe; Asia Pacific; Latin America; Middle East and Africa
Market Segmentation Analysis
By data type
Card and receipt transaction panels led data types with 22.4% of 2025 spending because they can help estimate consumer revenue before corporate reporting. Web-scraped information is the fastest-growing data type in the model, supported by price monitoring, job-posting analysis and licensed AI data feeds.
By end user
Hedge funds accounted for 24.6% of 2025 end-user spending. Technology and AI developers have the faster modeled growth rate as demand expands from trading signals into model training, retrieval systems and agent-ready data services.
Card and receipt transactions held 22.4% of the data type segment in 2025, while Hedge funds led the end user split at 24.6%. Credence Research forecasts faster growth for Web-scraped data (24.00% a year) and Technology and AI developers (28.50% a year). These figures represent market estimates and are not company-reported results.
Market Drivers and Opportunities
Faster commercial signals
Card-spending, store-visit and app-usage panels can reveal operating trends before financial results are released. Funds buy such feeds to build forecasts, while retailers use them to compare competitors and local markets. Data coverage, representativeness and historical consistency determine whether these signals justify recurring subscription fees.
AI training and agent-ready feeds
Model developers are seeking licensed and documented sources of web, app and commerce data. Vendors that deliver clean feeds through APIs and data marketplaces can reach customers outside the hedge fund sector. Contracts for model training also require clear rights to collect, transform and reuse source information.
Distribution through existing research platforms
Financial-information terminals and cloud marketplaces reduce the engineering work required to test a new dataset. Bloomberg’s 2025 integration of Similarweb traffic data is one example of this route to market. Distribution can broaden adoption, although vendors may surrender part of the economics to aggregators.
Regional Analysis
Credence Research estimates the following shares of global 2025 revenue: North America 57.3%; Europe 22.1%; Asia Pacific 14.6%; Latin America 3.1%; Middle East and Africa 2.9%. These allocations sum to 100% and reflect buyer location rather than the location of manufacturing or company headquarters.
North America led the market in 2025, supported by its established buyer base, supplier relationships and industry infrastructure. Europe and Asia Pacific are also material demand centers, although the competitive mix and procurement requirements vary by country. The smaller regions may record high percentage growth from a limited starting base, and such rates should not be mistaken for leadership in absolute spending.
North America benefits from a dense concentration of quantitative funds, financial data platforms and AI developers. European buyers must navigate stringent personal-data rules, which increases demand for licensed and aggregated feeds. Asia Pacific adds demand from financial centers and domestic digital platforms but faces varying localization requirements.
Market Challenges
Sensitive geolocation and transaction data create privacy, consent and national-security concerns. U.S. enforcement actions and cross-border data restrictions make diligence a core purchase requirement. Panel drift, incomplete histories and nonrepresentative samples can undermine the value of apparently timely signals; a faster feed is not necessarily a better forecast.
Buyers should also evaluate the total cost of adoption, interoperability with existing systems, vendor continuity and country-specific compliance obligations. Those factors can lengthen purchasing decisions even where the long-term growth thesis remains intact. The study distinguishes these commercial constraints from the market forecast itself.
Future Outlook
North America holds the largest modeled share because it hosts many hedge funds, data vendors and AI companies. Asia Pacific has the fastest forecast regional growth as investment institutions and local digital platforms expand. The strongest opportunities lie in licensed, traceable and AI-ready datasets that meet regulatory and quality standards.
Through 2035, suppliers that convert product capabilities into repeatable deployments, transparent pricing and reliable support should be better positioned than firms relying only on early demonstrations. Credence Research expects growth to vary across customer types and geographies rather than advance evenly each year.
Competitive Landscape
The market includes established multinational suppliers and specialized technology or service providers. Competition centers on product performance, customer relationships, integration capabilities, delivery reliability and the ability to meet sector-specific standards. The companies listed below participate in different parts of the value chain; their inclusion does not imply identical offerings or a verified ranking by market share.
Competitive analysis should distinguish vendors that directly sell the products or services in the defined scope from adjacent technology providers and end users. Credence Research uses supplier disclosures and industry evidence to assess participation. Comparable revenue for the narrow market definition is rarely disclosed, so this release does not assign unsupported individual company shares.
Key Players
BloombergS&P Global Market IntelligenceLSEGFactSetMoody’sSimilarwebPlacer.aiPlanet LabsYipitDataConsumer EdgeM ScienceThinknum
Recent Developments
June 2025: Bloomberg made Similarweb web-traffic analytics available through the Bloomberg Terminal ALTD function alongside other alternative datasets.
January 2025: The U.S. Federal Trade Commission finalized its order restricting Gravy Analytics and Venntel from selling sensitive location data.
Report Coverage
The full study covers market size and forecast, competitive conditions, value-chain structure, product and application segmentation, regional demand, market drivers, restraints, opportunities and regulatory developments. It provides a 2025 baseline and 2035 outlook and identifies areas where supplier disclosures support, but do not independently establish, Credence Research market estimates.
Explore the full report: https://www.credenceresearch.com/report/alternative-data-market
Chapter 1 Market Segmentation
Chapter 2 Introduction
Chapter 3 Executive Summary
Chapter 4 Global Alternative Data Market Trends and Developments
Chapter 5 Global Alternative Data Market Production, Supply and Demand Analysis
Chapter 6 Global Alternative Data Market Pricing Analysis
Chapter 7 Global Alternative Data Market Dynamics
Chapter 8 Global Alternative Data Value Chain Analysis
Chapter 9 Global Alternative Data Market Regulations and Policies
Chapter 10 Global Alternative Data Market Hotspots and Opportunities
Chapter 11 Global Alternative Data Market Outlook, 2025-2035
Chapter 12 Global Alternative Data Market Segmentation and Outlook
Chapter 13 Global Alternative Data End-Use and Application Market Outlook
Chapter 14 Global Alternative Data Geographic Market Outlook, 2025-2035
Chapter 15 Global Alternative Data Technology, Innovation and Sustainability Outlook
Chapter 16 Global Alternative Data Market Key Strategic Imperatives
Chapter 17 Competition Outlook
Chapter 18 Company Profiles
Chapter 19 Disclaimer
Related Reports
Insurtech MarketBlockchain in Media and Entertainment MarketDigital Logistics MarketArtificial Intelligence in Automotive MarketAI-Based 3D Vision System Market
About Us
Credence Research Inc. is a global market intelligence and consulting firm founded in 2015. It delivers market insights, quantitative analysis and strategic guidance to business leaders, investors, governments and nonprofit organizations. The company helps clients evaluate market opportunities, understand competitive dynamics and make informed strategic decisions.
Credence Research produces industry studies covering market size, forecasts, growth drivers, market trends and competitive landscapes. Its services also include customized research, commercial due diligence and go-to-market advisory. Findings draw on primary and secondary research, expert input and analytical modeling.
Contact Us
Credence Research Inc.
Tower C-1105, S 25, Akash Tower
Vishal Nagar, Pimple Nilakh, Haveli
Pune – 411027, India
USA: +1-888-600-6441
Email: sales@credenceresearch.com
Website: www.credenceresearch.com
View original content to download multimedia:https://www.prnewswire.co.uk/news-releases/alternative-data-market-to-reach-usd-40-35-billion-by-2035-as-ai-developers-and-corporations-expand-data-buying-credence-research-finds-302915881.html
Technology
TECHNATION Appoints New Board Leadership and Welcomes Industry Leaders to National Board
Published
4 minutes agoon
October 21, 2026By

TORONTO, Oct. 21, 2026 /CNW/ — TECHNATION, Canada’s national technology industry association, is pleased to announce the appointment of Sylvie Ouellette as Chair and Colin McIsaac as Vice Chair of its National Board of Directors.
Sylvie Ouellette is President and Co-Founder of Versatil BPI Inc., a Canadian-owned, women-led technology SME based in the National Capital Region, specializing in data, artificial intelligence, and security intelligence. She has more than 30 years of industry experience, including senior executive roles at Electronic Data Systems and Hewlett-Packard. As Chair, she brings both multinational leadership, including representing TECHNATION at the last two G7/TECH7 summits, and firsthand experience building a Canadian technology company.
Colin McIsaac is the Vice-President, North America Commercial Sales at Lenovo, responsible for strategy and performance across the NA VLB Segment and Canada’s Public Sector business. A prominent voice on the North America Senior Leadership Team, he oversees sales, operations, culture, and P&L execution to ensure Lenovo consistently delivers industry‑leading value for customers. Under his leadership, the team brings Lenovo’s complete portfolio of hardware, software, and services to market, fueling growth through innovation, customer partnership, and operational excellence.
Sylvie and Colin have been active members of TECHNATION’s Board of Directors for several years, serving on the Executive Committee and Governance Committee, respectively.
“We are pleased to welcome Sylvie as Chair and Colin as Vice Chair to TECHNATION’s National Board of Directors,” said Kevin d’Entremont, President and CEO of TECHNATION. “As seasoned members of our National Board, they have been engaged in shaping the focus of TECHNATION in supporting the full technology ecosystem in Canada. Their combined expertise, leadership, and commitment to advancing Canada’s technology ecosystem will be invaluable as we continue to advance the priorities that matter most to the sector and to Canada’s digital future.”
In addition to these appointments, TECHNATION is pleased to welcome four industry leaders to its Board of Directors:
Heather Black, Regional Vice-President, Canadian Public Sector Leader, Palo AltoPeter Kelcey, General Manager, Customer Success Lead, Microsoft CanadaErin O’Halloran, Vice President & General Manager, Oracle Health CanadaRaj Thuppal, Chief Digital Officer – Public Sector, ServiceNow Canada
These appointments come at a pivotal moment for Canada, as governments and businesses accelerate the adoption of digital technologies that are transforming how the economy operates and grows.
“I am honoured by the trust my fellow Board members have placed in me to lead TECHNATION at such a defining moment for Canada,” said Ouellette. “As technology reshapes our economy, national security, and global competitiveness, we must strengthen Canada’s capacity to innovate, advance responsible AI, and ensure Canadian businesses across the full ecosystem help shape our digital future. I look forward to working with our members and government partners to turn collaboration into action that delivers meaningful value for Canadians.”
Together, these appointments strengthen TECHNATION’s commitment to bring industry expertise to inform public policy, champion member priorities, and advance initiatives that support Canada’s digital and economic growth. Their leadership will help drive key priorities including digital transformation, procurement reform, workforce development, and Canada’s long-term competitiveness.
TECHNATION also extends its sincere thanks to outgoing Board Chair, Lloyd Switzer, retired Chief Procurement Officer at TELUS, for his leadership and dedication to the board. “Lloyd has been an invaluable leader at TECHNATION, guiding the association through a period of executive transition, while bringing a strong industry perspective through his role as Chief Procurement Officer at TELUS,” said d’Entremont. “While his retirement marks the end of an exceptional chapter, he has ensured a smooth transition and a bright future for our association and Canada’s tech sector.”
TECHNATION’s National Board is comprised of senior executives from across Canada’s technology landscape, representing both Canadian tech firms and global enterprises with significant operations and investments in Canada. A full list of TECHNATION’s National Board of Directors can be found at www.technationcanada.ca.
About TECHNATION
TECHNATION is Canada’s authoritative technology industry association, representing the full spectrum of Canada’s tech ecosystem, from agile innovators to domestic and global tech companies. Trusted by both industry and government, TECHNATION is the neutral connector, convener and catalyst powering a digital future and positioning Canada as a global tech leader. Together with our members, we shape tech policy and insights, deliver forums to drive public-private collaboration, foster inclusive workforce development, and support global expansion. Learn more at www.technationcanada.ca.
SOURCE TECHNATION Canada


Anrok launches MCP server, putting your tax data inside the AI tools your team already uses

Alternative Data Market to Reach USD 40.35 Billion by 2035 as AI Developers and Corporations Expand Data Buying, Credence Research Finds

TECHNATION Appoints New Board Leadership and Welcomes Industry Leaders to National Board

Send Rakhi to UK swiftly with UK Gifts Portal

Whiteboard Series with NEAR | Ep: 45 Joel Thorstensson from ceramic.network

Nullmax and Renesas Forge Strategic Partnership to Deliver Competitive ADAS Solutions for the Global Market

Why You Should Build on #NEAR – Co-founder Illia Polosukhin at CV Labs
Whiteboard Series with NEAR | Ep: 45 Joel Thorstensson from ceramic.network

NEAR End of Year Town Hall 2021: The Open Web World, MetaBUILD 2 Hackathon and 2021 recap
Trending
-

 Technology4 days ago
Highland and Bath Counties, Virginia Go Live on a Shared Caliber Hosted CAD Environment
-
 Technology4 days ago
JinkoSolar Unveils Tiger Neo 5.0 All-Black Residential Solar Module with 25.52% Efficiency
-

 Near Videos5 days ago
What if you could build a skyscraper with one prompt?
-

 Technology4 days ago
Bioethanol from human hair – Indian start-up’s solution to rising prices of grains and sugar
-

 Technology3 days ago
GMIF2026: AI Inference Powers the “Token Factory” and Drives System-Level Rethinking of Memory & Storage
-
 Technology3 days ago
Linktel Technologies Highlights Breakthrough 1.6T LPO Performance & Strong Market Pull at OCP 2026
-
 Technology3 days ago
Truecaller announces preliminary numbers for the third quarter 2026
-

 Coin Market2 days ago
World Liberty’s USD1 stablecoin sheds $400M in market cap in two weeks