Connect with us

Technology

Consumer Finance Market to Surpass $14 Trillion by 2031, with Asia-Pacific Holding a 43.3% Market Share in 2025, Says Mordor Intelligence

Published

on

HYDERABAD, India, July 21, 2026 /PRNewswire/ — According to Mordor Intelligence, the consumer finance market size is projected to increase from USD 9.87 trillion in 2025 to USD 10.44 trillion in 2026, reaching USD 14.08 trillion by 2031 at a 6.17% CAGR during the forecast period (2026-2031). Market expansion is being driven by the growing use of digital lending platforms, consent-based financial data, and government initiatives that improve access to formal credit. While established banks continue to dominate strong funding capabilities and robust risk management, fintech companies are gaining traction by offering faster approvals and embedded lending solutions. Despite ongoing challenges from higher funding costs and unsecured loan delinquencies, the market outlook remains positive, supported by improving digital credit ecosystems and resilient lending practices. 

Consumer Finance Market Growth Drivers 

Consent-Based Financial Data Enhances Credit Assessment 

The adoption of consent-based financial data is helping lenders make more accurate credit decisions by providing deeper insights into borrowers’ income, spending patterns, and repayment behavior. This is particularly beneficial for self-employed individuals, gig workers, and customers with limited credit histories, who are often difficult to evaluate using traditional credit scores alone. Improved data quality enables lenders to strengthen risk assessment, offer more suitable loan pricing, and expand access to credit without compromising underwriting standards. As open banking frameworks continue to evolve, they are expected to support more inclusive and efficient lending across the consumer finance industry. 

Embedded Lending Strengthens Consumer Credit Adoption 

Embedding financing options directly into the shopping experience is making consumer credit more accessible and convenient. By offering loans or installment payments at checkout, lenders can reach customers when purchase intent is strongest, increasing credit adoption while helping merchants improve sales conversions. This approach also reduces friction in the borrowing process through faster approvals and seamless integration with digital payment platforms. As embedded finance continues to expand, it is expected to play a larger role in driving consumer finance market growth by improving both customer experience and credit accessibility. 

Jayveer V, Senior Research Manager, Mordor Intelligence says, “Reliable decisions in consumer finance require research that reflects measurable market developments rather than assumptions. Mordor Intelligence combines structured primary research with rigorous validation and consistent analytical frameworks, giving executives a dependable basis for evaluating market trends and long-term business opportunities.” 

Global Consumer Finance Market Share by Region  

North America continues to hold a significant share of the consumer finance market, supported by high credit usage and the growing adoption of digital lending solutions. Lenders are increasingly using alternative data to expand credit access for near-prime and underserved borrowers while improving loan approval efficiency. Across the region, financial institutions are also refining pricing strategies and product offerings to address varying borrower risk profiles, supporting steady market development. 

Asia-Pacific remains the largest regional market for consumer finance, driven by its broad customer base and expanding access to formal credit. While lending conditions have become more selective in some major economies, strong retail borrowing demand and the rapid growth of digital lenders continue to support market expansion. Rising financial inclusion, increasing smartphone adoption, and growing consumer spending across emerging economies are expected to sustain the region’s long-term growth. 

The Middle East and Africa is expected to record the fastest growth in the consumer finance market, supported by rising digital lending adoption and expanding access to formal financial services. Fintech innovation, supportive regulatory initiatives, and increasing use of installment-based credit are accelerating market development across the region. Meanwhile, South America continues to strengthen its position through growing digital banking adoption and ongoing investments in consumer lending platforms. 

Major Segments Highlighted in the Consumer Finance Market Report 

By Product Type  

Revolving Credit  
– Credit Cards 
– Overdrafts/Credit Lines  Unsecured Non-Revolving Credit  
– Personal Loans 
– Education/Student Loans 
– Medical/Healthcare Loans 
– Other Unsecured Consumer Loans  Secured Non-Real Estate Credit  
– Auto/Vehicle Finance Loans 
– Other Secured Consumer Loans (e.g., Consumer Durables, Equipment)  

By Lender  

Banks  Non-Bank Financial Companies (NBFCs)  Fintechs and Digital Lenders (including Marketplace and Embedded Finance Platforms)  Other (Credit Unions, Cooperatives) 

By Distribution Channel  

Digital Direct  Branch/In-Person  Broker/AgentEmbedded Finance/Point-of-Sale

By Term Length  

Short-Term (Up to 2 years)  Medium-Term (2–5 years)  Long-Term (More than 5 years) 

By Loan Purpose  

Debt Consolidation/Refinancing  Vehicle Purchase/Auto-related  Education  Medical/Healthcare Expenses  TravelConsumer Durables  Other Personal/Household Purposes

By Geography  

North America 
 – United States 
– Canada
– Mexico  South America
– Brazil 
 – Argentina
– Rest of South America  Europe 
– United Kingdom 
– Germany 
– France 
– Italy 
– Spain 
– Rest of Europe  Asia-Pacific 
– China 
– Japan 
– India 
– South Korea 
– Australia 
– Indonesia 
– Thailand 
– Malaysia 
– Singapore 
– Vietnam 
– Rest of Asia-Pacific  Middle East and Africa 
–  Saudi Arabia 
–  United Arab Emirates 
– Turkey 
– South Africa 
– Egypt 
– Rest of Middle East and Africa 

Overview – Consumer Finance Industry    

Study Period   

2020-2031 

Market Size in 2026 

USD 10.44 Trillion 

Market Size Forecast 2031 

USD 14.08 Trillion 

Industry Expansion 

Growing at a CAGR of 6.17% during 2026-2031 

Fastest Growing Market for 2026-2031 

Middle East and Africa projected to record the fastest growth rate 

Segments Covered 

By Product Type, By Lender, By Distribution Channel, By Term Length, By Loan Purpose and By Geography 

Regions Covered 

North America, Europe, Asia-Pacific, South America, and Middle East and Africa 

Customization Scope 

Choose tailored purchase options designed to align precisely with your research requirements. 

Consumer Finance Companies: Covers Global and Market Overview, Key Business Segments, Financial Highlights (where available), Strategic Initiatives, Market Position, Product Portfolio, and Recent Developments. 

JPMorgan Chase and Co.  Bank of America Corporation  Citigroup Inc.  Wells Fargo and CompanyAmerican Express Company  Capital One Financial CorporationDiscover Financial Services  HSBC Holdings plcBNP Paribas  Banco Santander, S.A.  Industrial and Commercial Bank of China Limited  China Construction Bank Corporation  Mitsubishi UFJ Financial Group, Inc.  DBS Group Holdings Ltd  Standard Chartered PLCPayPal Holdings, Inc.  Block, Inc.Affirm Holdings, Inc.  SoFi Technologies, Inc.  Synchrony FinancialKlarna Bank ABNubankVisa Inc.Mastercard Incorporated

Get in-depth industry insights on the consumer finance market research report: https://www.mordorintelligence.com/industry-reports/consumer-finance-market?utm_source=prnewswire 

Explore related reports from Mordor Intelligence 

Securities Brokerage Market Size: The Securities Brokerage Market is expected to grow from USD 1.74 trillion in 2025 to USD 1.91 trillion in 2026, reaching USD 2.85 trillion by 2031 at a CAGR of 8.34% during the forecast period (2026-2031). Market growth is being driven by the increasing adoption of digital trading platforms, mobile investing applications, and lower trading barriers, making securities trading more accessible to both retail and institutional investors. 

Mobile Banking Market Share: The Mobile Banking Market is segmented by service type (fund transfers, bill payments, and others), transaction type (consumer-to-consumer, consumer-to-business, and others), end user (retail consumers, small and medium enterprises (SMEs), and others), and geography (North America, South America, Europe, Asia-Pacific, and the Middle East & Africa). The market size and forecasts are presented in value (USD). 

Finance Lease Market Analysis: The finance lease market is moderately concentrated, with large bank-backed leasing companies maintaining a strong presence alongside a diverse group of independent, captive, and specialized lessors. While major providers benefit from broad funding capabilities, global reach, and the ability to finance large-value assets, smaller firms remain competitive by offering faster approvals, specialized asset expertise, and close partnerships with equipment vendors. This competitive landscape supports ongoing consolidation among leading players while leaving room for niche providers to grow. 

About Mordor Intelligence:     

Mordor Intelligence is a trusted partner for businesses seeking comprehensive and actionable market intelligence. Our global reach, expert team, and tailored solutions empower organizations and individuals to make informed decisions, navigate complex markets, and achieve their strategic goals.     

With a team of over 550 domain experts and on-ground specialists spanning 150+ countries, Mordor Intelligence possesses a unique understanding of the global business landscape. This expertise translates into comprehensive market analysis and research reports as well as syndicated and custom research offerings that cover a wide spectrum of industries, including aerospace & defence, agriculture, animal nutrition and wellness, automation, automotive, chemicals & materials, consumer goods & services, electronics, energy & power, financial services, food & beverages, healthcare, hospitality & tourism, information & communications technology, investment opportunities, and logistics.

For media inquiries or further information, please contact:    

media@mordorintelligence.com
https://www.mordorintelligence.com/contact-us 

View original content to download multimedia:https://www.prnewswire.co.uk/news-releases/consumer-finance-market-to-surpass-14-trillion-by-2031–with-asia-pacific-holding-a-43-3-market-share-in-2025–says-mordor-intelligence-302830838.html

Continue Reading

Technology

SK hynix Announces 3Q26 Financial Results

Published

on

By

Reports revenues of 104.6155 trillion won, operating profit of 83.3338 trillion won, net profit of 39.7756 trillion won; Quarterly sales surpass 100 trillion won for the first timeSales of HBM4 and high-value-added server products expanded; HBM4 expected to be the mainstream product from the fourth quarterLong-term agreements secured for more than 50% of 2027~2028 production capacity; A structure that reflects market conditions and ensures stable profitabilityMost of the gains from the Kioxia investment to be shared with shareholders, with  approximately 100 trillion won in shareholder returns to be executed this year

SEOUL, South Korea, Oct. 27, 2026 /PRNewswire/ — SK hynix Inc. (or “the company”, www.skhynix.com) announced today that it has recorded 104.6155 trillion won in revenues, 83.3338 trillion won in operating profit (with an operating margin of 80%), and 39.7756 trillion won in net profit (with a net margin of 38%) in the third quarter.

Record quarterly results in both revenue and operating profit and revenue surpasses 100 trillion won for the first time

In a market environment in which prices of key products have risen on the back of growing demand for AI memory, the company once again posted all-time-high quarterly results in both revenue and operating profit, underpinned by the competitiveness of its high-value-added products. In particular, revenue exceeded 100 trillion won for the first time in the company’s history. Revenue and operating profit increased by 32% and 38%, from the previous quarter, respectively.

– Q2 2026: Revenue of 79.3187 trillion won, Operating Profit of 60.5426 trillion won

By product, DRAM results were driven by a significant increase in sales of server DDR5 while HBM4 shipments began in earnest. In NAND, sales of 321-layer TLC eSSD expanded, and high-value-added products for data centers continued to grow across the board.

The company’s financial structure has also become significantly concrete. At the end of the third quarter, cash and cash equivalents stood at 114.5 trillion won, up 26.5 trillion won from the end of the previous quarter, while borrowings decreased by 2.8 trillion won to 15.8 trillion won. As a result, net cash increased to 98.7 trillion won.

Memory supply shortage to persist through 2030

SK hynix analyzed that a virtuous cycle has taken hold in which AI-driven productivity gains and new revenue generation in areas such as software development, customer service, and search lead to greater AI adoption, which in turn drives increased investment in infrastructure. It also projected that, as the drivers of AI investment move beyond the early stage, when a small number of companies accounted for most of it, and broaden to include general enterprises and nation-level initiatives, the global AI data center infrastructure market will continue to grow steadily.

The company likewise expects the memory market to sustain its growth, led in the short term by enterprise and personal AI and, over the mid-to-long term, by physical AI such as autonomous driving and robotics.

The company assessed that supply, on the other hand, is not keeping pace with the growth of the market. Given technical difficulty of leading-edge processes and the long lead time required to build new production facilities, it expects the structure in which demand exceeds supply to persist through 2030.

Expanding production capacity and strengthening product competitiveness to achieve a further step up in growth next year

Building on these favorable conditions, the company plans to accelerate the expansion of production capacity and the strengthening of product competitiveness in order to sustain the current growth momentum, and to scale up revenue and profit one step further next year.

First, the company plans to rapidly increase the portion of its 10nm-class 6th generation (1c) process technology and expand sales of DDR5 and LPDDR5 SOCAMM for AI servers, thereby further strengthening its DRAM portfolio centered on high-value-added products.

To respond to surging HBM demand, the company will ramp up M15X to maximum capacity by the end of the year to increase HBM4 production. Accordingly, the company expects HBM4 to surpass HBM3E in both shipment volume and revenue in the fourth quarter and to establish itself as a mainstream product.

In NAND, the company will raise the ratio of its 321-layer process to more than half of its domestic production capacity in the fourth quarter, and thereby increase the supply of high-performance, high-capacity eSSD. Over the mid-to-long term, the company intends to develop NAND into a core solution that enhances the throughput and economic efficiency of AI services, based on HBF and system optimization technologies.

Long-term agreements secured for more than 50% of 2027~2028 production capacity and the company to drastically expand investment next year

To improve mid-to-long term demand visibility and solidify its growth foundation, SK hynix is expanding long-term agreements (LTAs) with customers. The company has currently signed LTAs with 14 major customers, including leading global cloud service providers (CSPs), and is also proactively discussing with a number of customers the possibility of extending the contract terms, which are typically five years.

The LTA volume secured to date corresponds to more than 50% of total production capacity for 2027 and 2028. In particular, by introducing a mechanism that reflects market conditions within a price range agreed upon with customers, the company has established a structure that secures stable profitability while allowing flexible responses to market changes.

Backed by the demand visibility, the company is also moving to expand its production capabilities. Next year, with the Yongin Phase 1 entering full-scale operation and domestic and overseas infrastructure investment gaining momentum, investment is expected to increase significantly. The company nevertheless plans to adjust the scale and timing of its investment flexibly, after carefully weighing customer demand, product competitiveness, profitability and investment efficiency.

Most of the gains from the Kioxia investment to be shared with shareholders, with approximately 100 trillion won in shareholder returns to be executed this year

As previously indicated in August, SK hynix announced its additional shareholder return plan. For fiscal year 2026, the company will pursue shareholder returns totaling approximately 100 trillion won, comprising cash dividends of 30 trillion won or more and share repurchases and cancellations of 60 trillion won or more in total, including the 40 trillion won announced in August. Through this, the company intends to fulfill its commitment to return 50% or more of free cash flow (FCF). Of this, the 40 trillion won share repurchase announced in August was completed last week, and the shares will be cancelled shortly.

The company also set out its principles: the dividend amount will be determined on the basis of operating results; if significant investment gains arise, they will be returned additionally through special dividends; and share repurchases will continue every quarter.

At today’s meeting, the Board of Directors resolved on a third-quarter cash dividend of 14 trillion won and a share repurchase of 20 trillion won. Of the shares to be repurchased, 10 trillion won, earmarked for shareholder returns, will be cancelled in full, while the remaining approximately 10 trillion won will be used for employee compensation and is not included in the shareholder return total.

The third-quarter dividend is 20,000 won per share, consisting of a 10,000-won dividend reflecting improved earnings and a 10,000 won special dividend that shares the gains from the Kioxia investment. The company has decided to return to shareholders most of the gains realized from its Kioxia investment this year.

SK hynix emphasized that it will deliver stable results based on robust memory demand growth and technological competitiveness and the company will consistently share financial achievements with our shareholders.

 3Q26 Financial Results (K-IFRS)

*Unit: Billion KRW

3Q26

QoQ

YoY

2Q26

Change

3Q25

Change

Revenues

104,615.5

79,318.7

32 %

24,448.9

328 %

Operating Profit

83,333.8

60,542.6

38 %

11,383.4

632 %

Operating Margin

80 %

76 %

3%p

47 %

33%p

Net Income

39,775.6

93,922.6

-58 %

12,597.5

216 %

* Financial information of the earnings is based on K-IFRS

* Please note that the financial results discussed herein are preliminary and speak only as of October 28, 2026. Readers should not assume that this information remains operative at a later time.

* Percentage changes are calculated on the basis of unrounded figures.

Disclaimer

This material has been prepared by the Company for informational purposes only, and the information contained herein has not undergone any separate, independent verification process. No representations or warranties are made regarding the fairness, accuracy, or completeness of the information contained in this material, and such information should not be relied upon. Neither the Company nor its employees bear any civil, criminal, or administrative liability for any damages arising from this material or from its use.

Review of the FY2026 Q3 financial results has not been finalized. Figures in this earnings release are subject to changes during the independent auditing process.

All financial information contained in this document is based on consolidated K-IFRS.

This material contains forward-looking statements, which involve risks and uncertainties. These statements are generally identified words such as “may,” “will,” “intend,” “should,” “believe,” “expect,” “anticipate,” “project,” “estimate” and similar expressions, or the negative of such expressions. Forward-looking statements are not guarantees of future performance and are subject to inherent risks, uncertainties, and other factors that could cause actual results to differ materially from those expressed or implied. Readers are cautioned not to place undue reliance on any of these forward-looking statements. These forward-looking statements speak only as of the date hereof. SK hynix undertakes no obligation to update any of these forward-looking statements to reflect events or circumstances after the date of this news release or to reflect actual outcomes, unless required by law.

This material does not constitute a solicitation for the acquisition or purchase of securities, and no part of this material should serve as the basis for any contract, agreement, or investment decision, nor should it be relied upon in connection therewith.

About SK hynix Inc.

SK hynix Inc., headquartered in Korea, is the world’s top tier semiconductor supplier offering Dynamic Random Access Memory chips (“DRAM”) and flash memory chips (“NAND flash”) for a wide range of distinguished customers globally. The Company’s shares are traded on the Korea Exchange, and the Global Depository shares are listed on the Luxembourg Stock Exchange. Further information about SK hynix is available at www.skhynix.com, news.skhynix.com.

View original content:https://www.prnewswire.com/news-releases/sk-hynix-announces-3q26-financial-results-302921407.html

SOURCE SK hynix Inc.

Continue Reading

Technology

DealLabs Builds Travel AI Data Layer with 280,000 Verified Local Records Across Seven Asian Cities

Published

on

By

SEOUL, South Korea, Oct. 28, 2026 /PRNewswire/ — Seoul-based travel data company DealLabs announced that it has built a database of verified local travel information for seven Asian cities: Seoul, Busan, Tokyo, Osaka, Bangkok, Taipei, and Singapore. As of October 13, the database contained more than 280,000 records, each accompanied by its source and verification date. It powers more than 23,000 guide pages and is published in formats AI systems can read directly.

It covers what travelers look for after arriving: subway station exits, timetables, first and last trains, fares, restaurants, tourist attractions, hospitals, closing days for Singapore’s hawker centers, and business hours for Taipei’s night markets. In Osaka alone, the database contains more than 114,000 records, including more than 42,000 medical institutions and pharmacies and more than 30,000 restaurant permits. In Taipei, it contains more than 63,000 records, including 7,200 station-to-station fares.

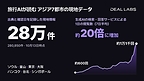
The number of times generative AI search and answer services accessed DealLabs’ data increased from around 600 times per day on a seven-day average in late September to more than 11,000 times per day in mid-October, nearly 20-fold in less than a month.

Travel information changes rapidly. On the same day, public event listings and organizers’ own notices gave different end dates for three of 25 pop-up stores in Seoul, up to 10 days apart. Business hours, closing days, last train times, and fares are among the areas where AI travel answers are most frequently inaccurate. DealLabs continuously updates this information using official sources.

All seven cities have AI-ready guide files (llms.txt) and data APIs, while Seoul also provides a standard API specification (OpenAPI). The seven cities are run using a single common engine, allowing a new city to be added simply by incorporating that city’s data and sources.

DealLabs is also piloting “Visit Plan Check,” which checks travel AI itineraries against official sources daily.

Young Cho, founder and CEO of DealLabs, said, “When travelers ask AI a question, what matters is whether the answer is accurate for that city today. We will establish a standard for local data that travel AI can rely on.”

DealLabs plans to expand its coverage to 10 cities by the end of 2026 and to 30 cities, including New York and Paris, by 2028.

For more information, please visit https://deallabs.net.

View original content to download multimedia:https://www.prnewswire.com/apac/news-releases/deallabs-builds-travel-ai-data-layer-with-280-000-verified-local-records-across-seven-asian-cities-302920425.html

SOURCE DEALLABS

Continue Reading

Technology

Teijin Selects Kharon to Strengthen Export Controls Compliance Across Global Operations

Published

on

By

Kharon ClearView will support Teijin teams in Japan, the United States, and Europe as they navigate Japanese and U.S. export controls requirements.

DENVER, Oct. 28, 2026 /PRNewswire/ — Kharon, a data and technology company that provides risk intelligence solutions to help organizations manage regulatory and business risk, announced that Teijin Limited has selected Kharon ClearView to support its export controls compliance program.

Headquartered in Japan, Teijin operates a global materials business that includes carbon fiber and other advanced materials used in aerospace and industrial applications. Its international operations require compliance teams to navigate export control requirements across multiple jurisdictions, including Japan and the United States.

“As a global company, we need an export controls approach that can support our teams across markets,” said Hitoshi Onodera, General Manager of the Quality Assurance and Security Export Control Department and Manager of the Security Export Control Group at Teijin. “We selected Kharon because of the depth of its risk intelligence, ease of use, and its ability to give our teams greater visibility into the entities and relationships that matter to our reviews. ClearView will help us bring that context consistently into our due diligence processes across our operations.”

Teijin will deploy ClearView across its operations globally. ClearView enables compliance teams to investigate complex entity relationships, including ownership and commercial connections to parties subject to export controls and other trade restrictions.

“Advanced materials companies operate in an increasingly complex export controls environment, where understanding the parties behind a transaction can be just as important as screening the names directly involved,” said Ethan Woolley, Global Director of Strategy at Kharon. “Teijin’s decision to deploy ClearView across its operations reflects the importance of having that level of insight. We are pleased to support its teams as they strengthen their approach to export controls compliance.”

About Teijin

Teijin Limited is a Japan-based global technology company providing products and solutions across advanced materials, healthcare, and other technology-driven fields. Founded in 1918, Teijin’s businesses include high-performance materials such as aramid fibers, carbon fibers, and composites, serving applications across mobility, infrastructure, industry, and other markets. The Teijin Group comprises 126 companies and approximately 15,700 employees worldwide.

For more information, visit https://www.teijin.co.jp/.

About Kharon

Kharon’s intelligence supports compliance, trade, risk, and national security programs at organizations around the world, including seven of the 10 largest U.S. banks, six of the 10 largest EU banks, and over 35 Fortune 100 companies. Kharon’s data can also be directly integrated with AI applications and agentic operations through Kharon’s API, MCP, and agent gateway infrastructure, enabling organizations to embed Kharon’s sourced, structured insights into automated workflows alongside their teams.

Visit kharon.com and follow Kharon on LinkedIn to stay connected.

Media contact

Kharon
media@kharon.com

View original content to download multimedia:https://www.prnewswire.com/apac/news-releases/teijin-selects-kharon-to-strengthen-export-controls-compliance-across-global-operations-302921369.html

SOURCE Kharon

Continue Reading

Trending